Torsten Asmus
By Lydia Hamill, Manager, Fixed Income and Multi-Asset Product and Lena Katsnelson, Senior Manager, Fixed Income and Multi-Asset Product
For fixed income markets, 2022 has been a transformative year, marking the end of 15 years of low interest rates and opening the door to the first global inflationary surge in 40 years. The Federal Reserve’s aggressive moves to bring inflation under control, including a series of rate hikes, have not been kind to fixed income in general, pushing yields higher across the curve. However, some assets have fared better than others.
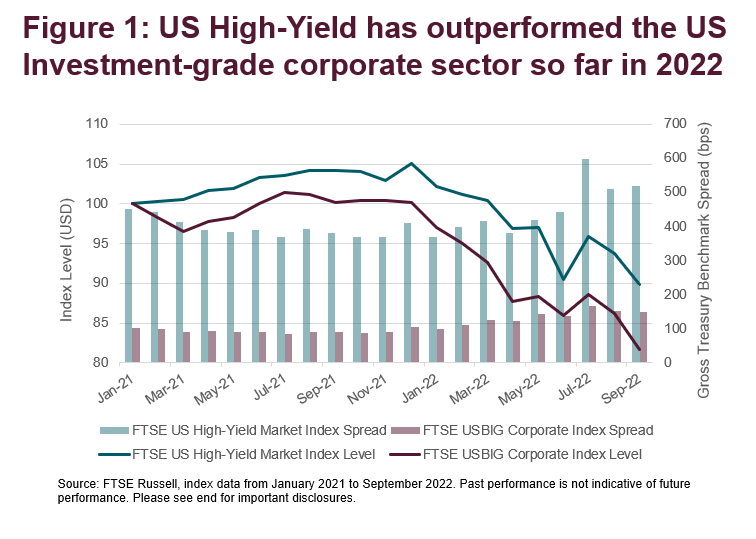
Earlier in the year, markets saw a number of asset managers positioning for rising interest rates by moving down the yield curve into shorter duration assets, including high-yield. This positioning has largely paid off when the great ‘reset’ took place and interest rates rose sharply. The high-yield sector came out on top of the investment stack from a performance angle. For the first six months of 2022, US high-yield bonds outperformed investment-grade in the US, shown by figure 1. US high-yield bond funds received inflows of $4.8 billion in July, 2022,1 perhaps marking a new high tide for high-yield assets.
As with any tightening cycle, the risks of recession are on the rise. The 2s/10s curve keeps inverting, seen by many as a reliable indicator of a slowdown for the US economy2. It is quite common to see a flight to quality accompanying recessionary fears and high-yield, on the surface at least, seemed like an unusual choice. However, this economic cycle could be very different from anything we have seen in the last 40 years, and it could be informative to look at old assets through a new lens. So, what makes the high-yield sector appealing in this environment?
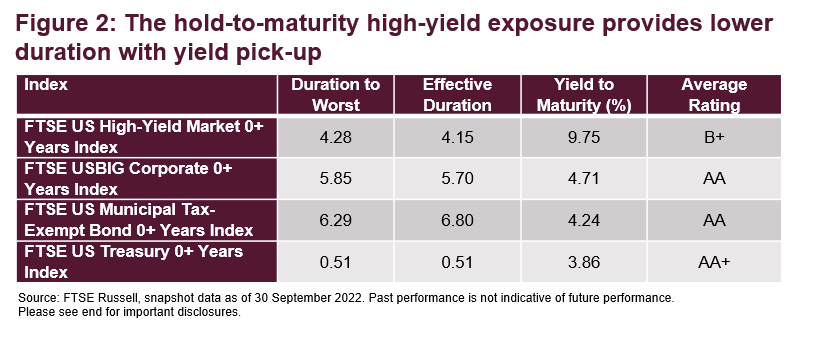
There are a couple of possible explanations for the growing interest in high-yield bonds. Firstly, the high-yield sector tends to be less interest rate sensitive due to the lower duration. This is structural, as investors are generally averse to lending to lower credit tiers for long terms, and prefer shorter exposures. When compared with other assets, the FTSE US High-yield Market 0+ Index has the lowest effective duration across the US fixed income market.
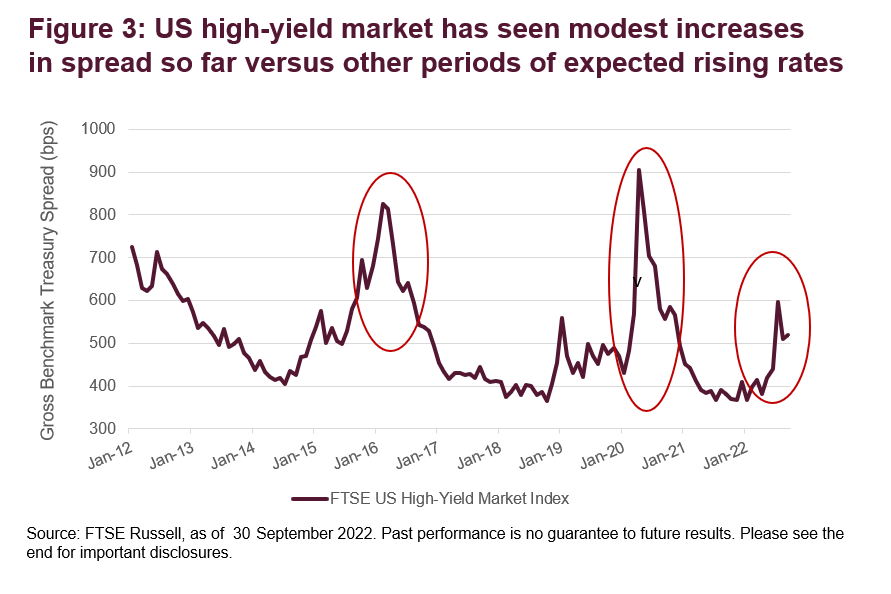
Moreover, the US high-yield market has shown good spread resilience. The FTSE US High-Yield Market Index has widened to just over 500bps in September 2022, remaining significantly below pandemic highs of 900bps in April 2020 and even below March 2015 highs, peaking as a result of the Federal Reserve tightening. This spread resilience can be further attributed to sector fundamentals, where in contrast to previous economic downturns, the high-yield market is entering the down-turn period from a position of strength.
Strong Balance Sheets
The relative financial strength for US high-yield corporates today versus other periods of market volatility reflects the fortification of balance sheets that we saw during the pandemic. At the time, corporate issuers tapped the debt market and replenished cash reserves. Initially, metrics like leverage ratio and coverage weakened, but as the economy recovered, earnings rose, and balance sheets improved beyond pre-pandemic levels – the ongoing uncertainty as a result of Covid led to companies taking a conservative approach to managing their balance sheets. The deleveraging has been significant, and default rates for the high-yield segment are predicted to be low as a result. Although these are expected to rise, they are rising from historic lows, and interest coverage and leverage ratios are at historic highs3. Moreover, many of the high-yield issuers most at-risk of defaulting have done so during the pandemic, meaning that today, the strongest have survived4.
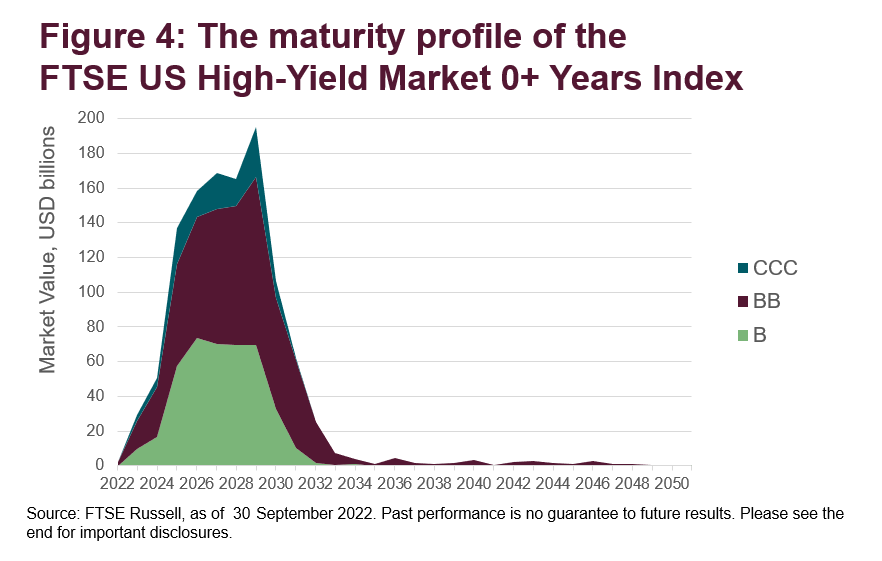
Pushed Out Maturity Wall: Additionally, balance sheets have been strengthened by pushing out the maturity wall. The high-yield market has gone through a re-financing wave during the low interest rate cycle, with 2021 being a record issuance year for the sector. The recent issuance wave reduced the impetus for high-yield issuers to tap the market at higher rates or engage in refinancing activity, reducing the sector’s exposure to the higher rate environment. According to the FTSE US High-yield Market 0+ Years Index, which tracks the US high-yield market to maturity, only 2.6% of debt is scheduled to mature by 2024, and 7.0% slated for maturity by 2025.
Additionally, while a short-term, US high-yield exposure could be used to hedge somewhat against rising rates, the potential for unintended name concentration needs to be considered. While restricting the FTSE US High-Yield Market 0+ Years Index to a 0-3 year exposure reduces the number of individual issuers by 40%, the biggest issuer weight increases from 3.2% to 4.4%[5]. As flows to short-term instruments increase, the single name exposure across multiple assets can present significant counterparty risk. FTSE Russell calculates a FTSE US High-Yield Market Capped Index, where the total debt of any single issuer is capped at $15 billion of par amount outstanding, to support name diversification.
Higher concentration in ‘BB’ tiers
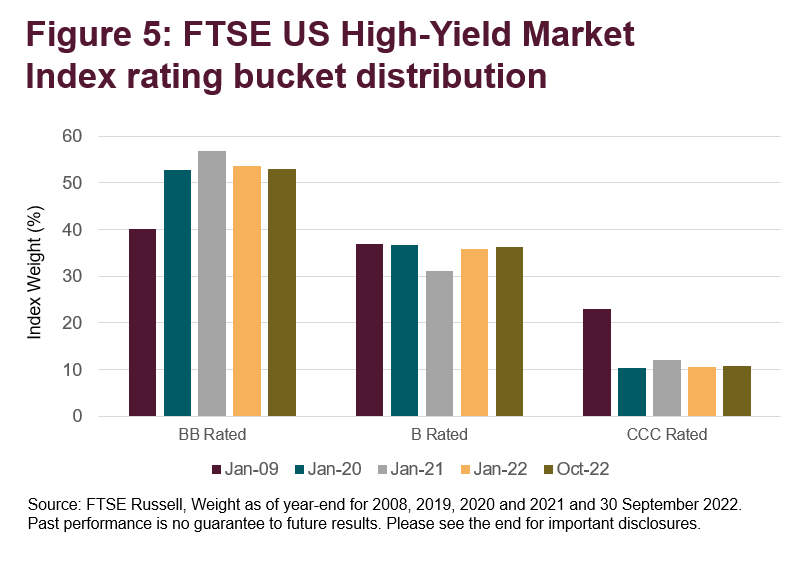
Another interesting consideration is the credit distribution within the US high-yield universe. Compared to previous downturns, the lowest concentration is in the ‘CCC’ bucket of 10.8% weight, compared to 11.1% weight during the pre-pandemic turbulence of 2019. It is also materially less than the 20% concentration in ‘CCC’ going into the last recession of 2008. In addition to overall reduction in lower credit tiers, there is a higher concentration of quality ‘BB’ assets compared to the previous periods, both generally, and within the early stages of the maturity wall, as shown by figure 4. As result, the high-yield sector today has a much stronger credit profile.
Energy Sector
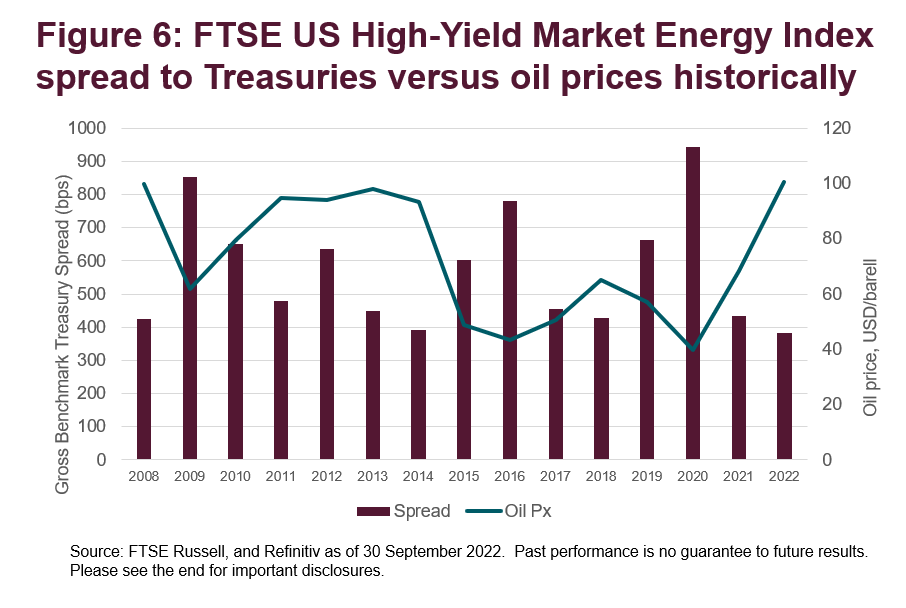
Over the years, high-yield and energy have become quite intertwined, as the US high-yield market amassed one of the highest exposures to energy sectors amongst the fixed income indices. As of October 2022, the Energy sub-index makes up 13.1% of the FTSE US High-Yield Market Index by market value. There is a strong negative correlation between spread to treasuries for the FTSE US High-Yield Market Energy Index and the price of oil, with the index widening during times of oil price declines. Previous economic downturns have been marked by substantial decreases in oil prices. However, the current situation is very different, with oil prices on the rise due to supply-side disruption, delivering a significant windfall to issuers, and strengthening corporate balance sheets.
So, it looks like the US high-yield sector is well positioned and has good tailwinds heading into the new cycle. However, there are always wild cards in play, and with the Federal Reserve prioritizing inflation, the risk of the Fed tightening too much and too fast is significant. Liquidity could dry up faster than the market anticipates, and the economy could become stressed beyond expected scenarios causing a trend reversal for the corporate market and high-yield. However, under less severe scenarios, US high-yield looks quite appealing.
1 Source: Refinitiv
2 U.S. 2s/10s Treasury yield curve inverts, Reuters
3 Is it time to consider high yield? InsightInvestment, August 2022
4 Three Reasons It’s Time to Add High-Yield Bonds, Alliance Bernstein, July 2022
5 FTSE Russell, as of September 30, 2022.
© 2022 London Stock Exchange Group plc and its applicable group undertakings (the “LSE Group”). The LSE Group includes (1) FTSE International Limited (“FTSE”), (2) Frank Russell Company (“Russell”), (3) FTSE Global Debt Capital Markets Inc. and FTSE Global Debt Capital Markets Limited (together, “FTSE Canada”), (4) FTSE Fixed Income Europe Limited (“FTSE FI Europe”), (5) FTSE Fixed Income LLC (“FTSE FI”), (6) The Yield Book Inc (“YB”) and (7) Beyond Ratings S.A.S. (“BR”). All rights reserved.
FTSE Russell® is a trading name of FTSE, Russell, FTSE Canada, FTSE FI, FTSE FI Europe, YB and BR. “FTSE®”, “Russell®”, “FTSE Russell®”, “FTSE4Good®”, “ICB®”, “The Yield Book®”, “Beyond Ratings®” and all other trademarks and service marks used herein (whether registered or unregistered) are trademarks and/or service marks owned or licensed by the applicable member of the LSE Group or their respective licensors and are owned, or used under licence, by FTSE, Russell, FTSE Canada, FTSE FI, FTSE FI Europe, YB or BR. FTSE International Limited is authorised and regulated by the Financial Conduct Authority as a benchmark administrator.
All information is provided for information purposes only. All information and data contained in this publication is obtained by the LSE Group, from sources believed by it to be accurate and reliable. Because of the possibility of human and mechanical error as well as other factors, however, such information and data is provided “as is” without warranty of any kind. No member of the LSE Group nor their respective directors, officers, employees, partners or licensors make any claim, prediction, warranty or representation whatsoever, expressly or impliedly, either as to the accuracy, timeliness, completeness, merchantability of any information or of results to be obtained from the use of FTSE Russell products, including but not limited to indexes, data and analytics, or the fitness or suitability of the FTSE Russell products for any particular purpose to which they might be put. Any representation of historical data accessible through FTSE Russell products is provided for information purposes only and is not a reliable indicator of future performance.
No responsibility or liability can be accepted by any member of the LSE Group nor their respective directors, officers, employees, partners or licensors for (a) any loss or damage in whole or in part caused by, resulting from, or relating to any error (negligent or otherwise) or other circumstance involved in procuring, collecting, compiling, interpreting, analysing, editing, transcribing, transmitting, communicating or delivering any such information or data or from use of this document or links to this document or (b) any direct, indirect, special, consequential or incidental damages whatsoever, even if any member of the LSE Group is advised in advance of the possibility of such damages, resulting from the use of, or inability to use, such information.
No member of the LSE Group nor their respective directors, officers, employees, partners or licensors provide investment advice and nothing in this document should be taken as constituting financial or investment advice. No member of the LSE Group nor their respective directors, officers, employees, partners or licensors make any representation regarding the advisability of investing in any asset or whether such investment creates any legal or compliance risks for the investor. A decision to invest in any such asset should not be made in reliance on any information herein. Indexes cannot be invested in directly. Inclusion of an asset in an index is not a recommendation to buy, sell or hold that asset nor confirmation that any particular investor may lawfully buy, sell or hold the asset or an index containing the asset. The general information contained in this publication should not be acted upon without obtaining specific legal, tax, and investment advice from a licensed professional.
Past performance is no guarantee of future results. Charts and graphs are provided for illustrative purposes only. Index returns shown may not represent the results of the actual trading of investable assets. Certain returns shown may reflect back-tested performance. All performance presented prior to the index inception date is back-tested performance. Back-tested performance is not actual performance, but is hypothetical. The back-test calculations are based on the same methodology that was in effect when the index was officially launched. However, back-tested data may reflect the application of the index methodology with the benefit of hindsight, and the historic calculations of an index may change from month to month based on revisions to the underlying economic data used in the calculation of the index.
This document may contain forward-looking assessments. These are based upon a number of assumptions concerning future conditions that ultimately may prove to be inaccurate. Such forward-looking assessments are subject to risks and uncertainties and may be affected by various factors that may cause actual results to differ materially. No member of the LSE Group nor their licensors assume any duty to and do not undertake to update forward-looking assessments.
No part of this information may be reproduced, stored in a retrieval system or transmitted in any form or by any means, electronic, mechanical, photocopying, recording or otherwise, without prior written permission of the applicable member of the LSE Group. Use and distribution of the LSE Group data requires a licence from FTSE, Russell, FTSE Canada, FTSE FI, FTSE FI Europe, YB, BR and/or their respective licensors.
Editor’s Note: The summary bullets for this article were chosen by Seeking Alpha editors.


Be the first to comment