

Stefano Guidi/Getty Images Entertainment
Data and pricing in this model are accurate as at pre-market 6th July 2022. STLA $11.71 at the time of writing.
Before embarking on an analysis of automobile manufacturer stocks, I had never heard of Stellantis N.V. (NYSE:STLA). Going into my search, I knew to expect names like Tesla (TSLA), Toyota (TM), Volkswagen (OTCPK:VWAGY), General Motors (GM), and Ford (F), to name only a few.
I had certainly heard of most of the brands owned by Stellantis (Abarth, Alfa Romeo, Chrysler, Citroën, Dodge, Fiat, Jeep, Maserati, Ram, Opel, Vauxhall, Peugeot), but behind all these household names sits a powerhouse of the automobile industry, based in Hoofddorp, Netherlands.
In 2022, the auto manufacturing industry faces median gross margins of 18% and median net income margins of 7%. Free cash flow is just 5% of revenues.
In such a tight, competitive industry, firms need to keep a very close eye on the balance sheet, keep a handle on debt, and continue to find ways to cut costs through efficiencies or grow margins through innovations.
For these reasons, and more, Stellantis stands out in its industry. This article seeks to explore where I believe Stellantis has been significantly mispriced, an attempt to value the firm, and, of course, explore both risks to the firm and the macro trends influencing the auto market.
For reference, we will be comparing Stellantis to its peers in the Automobile Manufacturers Industry. All of my data including my peer analysis is available for download here.
Setting The Scene: Rating Stellantis’ Financial Health
When reviewing a firm in any great detail, the first place I will look is the firm’s base financial health and its obligations structure.
I look at just 4 main indicators in a sea of data, and calculate a percentile rank for the firm against its industry peers.
I then assign an overall score for the metric, considering the metric itself (somewhat arbitrarily) with respect to its percentile rank in industry.
For STLA, I rank the firm’s base financial health at 87.5%, where a score below 75% I would consider a risk to profitability or even a downsizing risk exists.
Author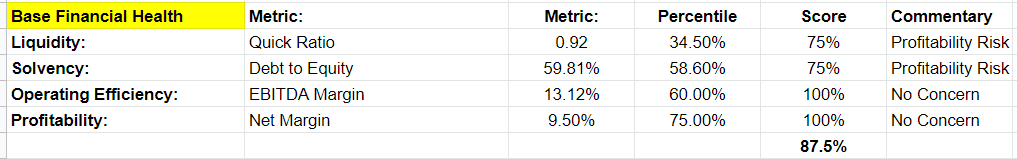
Next is the firm’s obligations structure: how is the firm managing its balance sheet.
Using the same methodology as the base financial health model, I look at it’s debt structure and consider how much risk the firm’s debt presents to the future business.
Here, STLA performs well, with no short term debt, and a net positive current ratio, though it is considerably lower than the rest of the auto maker industry but not outside the realm of a “normal” score.
Author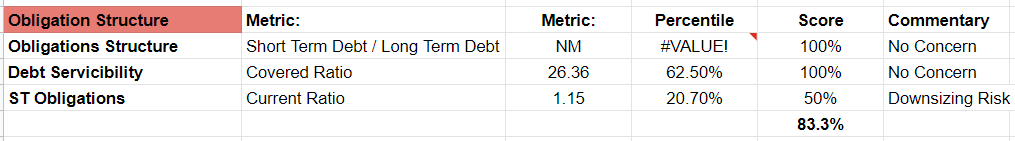
Next is addressing the firm’s dividend. STLA paid a $1.12 dividend in the trailing 12 months, and has good cash flow and earnings coverage. I note that other auto makers have their dividend cash flow coverage much higher than STLA. So, with respect to its industry, I give STLA a 75% score on CF Coverage, but overall it earns a solid 87.5% dividend affordability score.
Author
Lastly, I consider the firm’s financial future and earnings estimates.
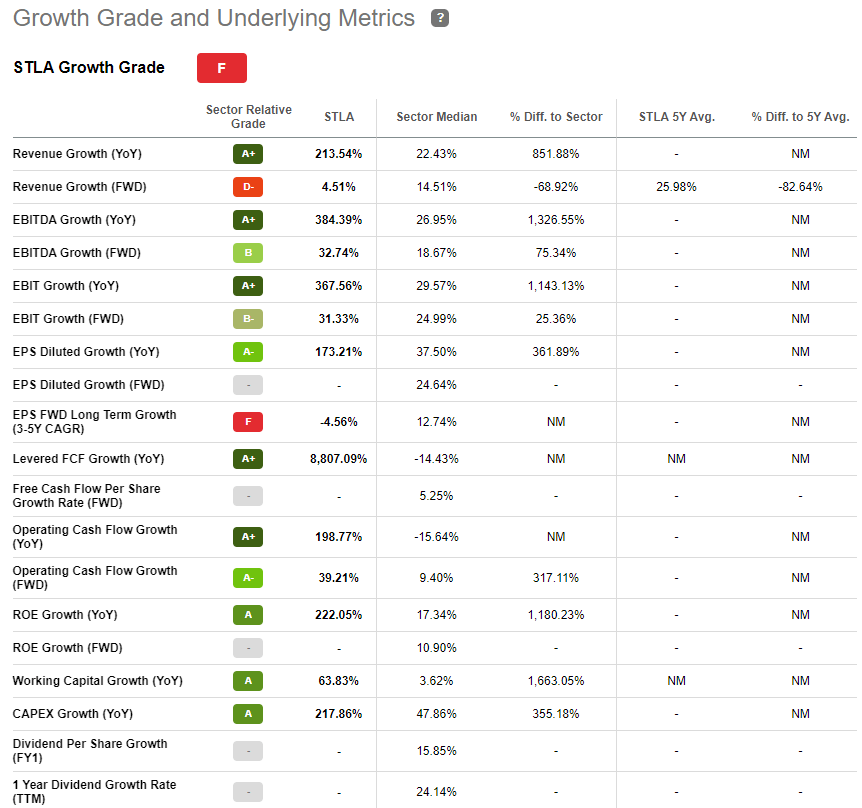
Here is where STLA really shines, and we will explore this a little deeper, later in the article. But as we can see, not only does it have very strong top-line and bottom-line growth outlooks, but it also is a leader within it’s industry for it’s outlook.
Here STLA earns a perfect 100% score.
Author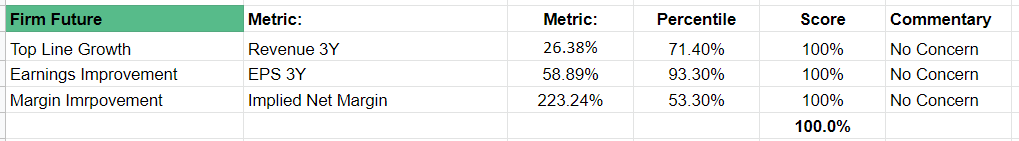
To take a wholistic view of STLA’s financial health, I’ve weighted its base financial health and obligation structure at an equal 35%, as I believe these factors will be important facing headwinds in a changing industry (shift to autonomous vehicles, electrification, a potential recession). STLA’s base financial health means it will be able to operate effectively in most environments, and the healthy balance sheet will allow it to take on additional debt should it need to in order to maintain operations, invest or grow.
Dividend affordability only gets a 10% weighting, as all firms have the ability to make significant changes to dividends in order to maintain financial sustainability, but it’s still important to consider the effect it has on the business.
And lastly, the firm future gets a 20% weighting – less than base financial health or obligation structure, because these are based on estimates, and so we need to maintain a level of conservative optimism about outlooks.
Author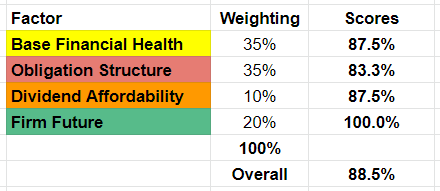
Overall I give Stellaris a very healthy passing score of 88.5% for its overall financial health.
The areas of concern in my eyes are its current liabilities structure (current ratio: 1.15), its liquidity (quick ratio of 0.92), and I would be keeping an eye on dividend affordability with cashflow coverage of dividends lower than its peers (20% percentile rank).
Stellantis’ Valuation Is Extremely Attractive
Next, we consider Stellantis’ valuation relative to its peers.
It’s important to note that at this stage, we are not looking to put a value on Stellantis, but rather, consider how attractive its valuation is when looking at the whole industry.
The same process applies to measuring valuation attractiveness as considering its financial health: rank the metric amongst its peers, although scores are simply calculated as the reverse percentile rank (=1-”Percentile Rank”) given this is a peer analysis, and then assign weights to each metric and calculate a weighted overall score.
Author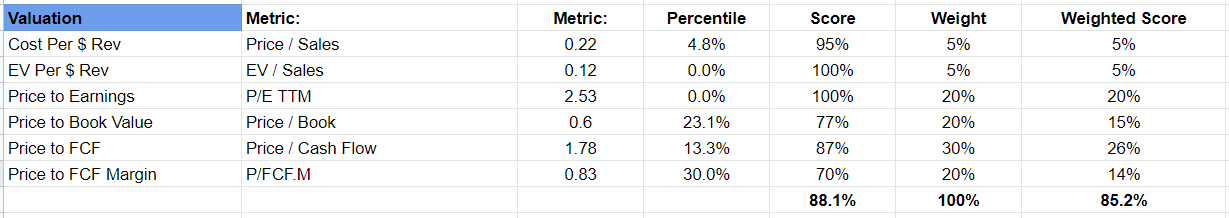
Note Price to FCF margin calculation: take the price and divide it by the free cashflow margin to ascertain the price investors are paying for each 1% increase of FCF margin.
Eyeballing the data above, immediately two metrics stand out (P/E and EV/Sales). Here, STLA leads the industry as the most attractive valuation on the market by these metrics.
STLA performs well across all these metrics, and earns an impressive 85.2% weighted score on valuation.
Noteworthy
What’s also noteworthy is that the book value per share, and cash per share (not shown above) for Stellantis, both exceed the current share price. These two factors combined should give any investor a reason to consider a firm closely.
So rounding out our initial peer comparisons, Stellaris has a solid 88.5% score on it’s financial health, and an 85.2% score on its valuation attractiveness. I feel confident that STLA deserves some serious consideration.
3Y Revenue and EPS Projections More Positive Than Nearly All Other Firms
The next logical step is to look more closely at the firms forward estimates and see how STLA sits compared to its peers.
Unfortunately for us, STLA only has 2 analysts covering it, which means we don’t have a lot to work with here.
The good news, however, is that earnings have been in-line with consensus estimates as far back as we can see, so we know that these analysts have a reasonable handle on the firm.
Seeking Alpha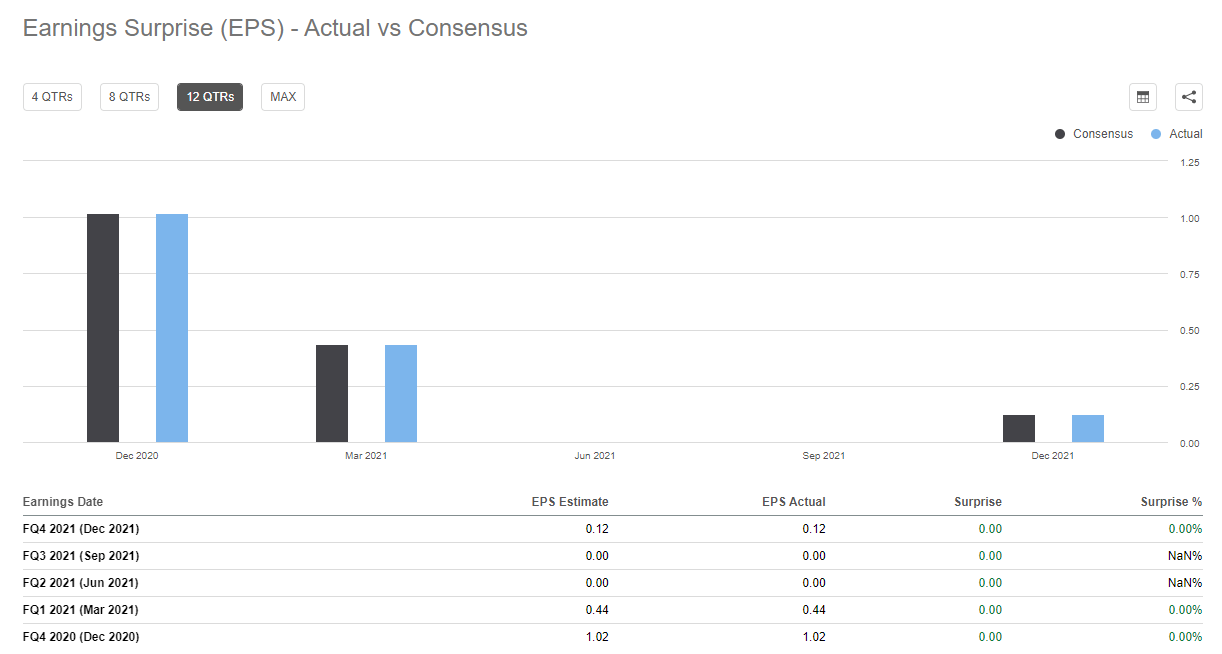
Next is consensus revisions. These haven’t moved too dramatically over time, but with only 2 analysts covering the firm there’s not a lot to look at here.
Seeking Alpha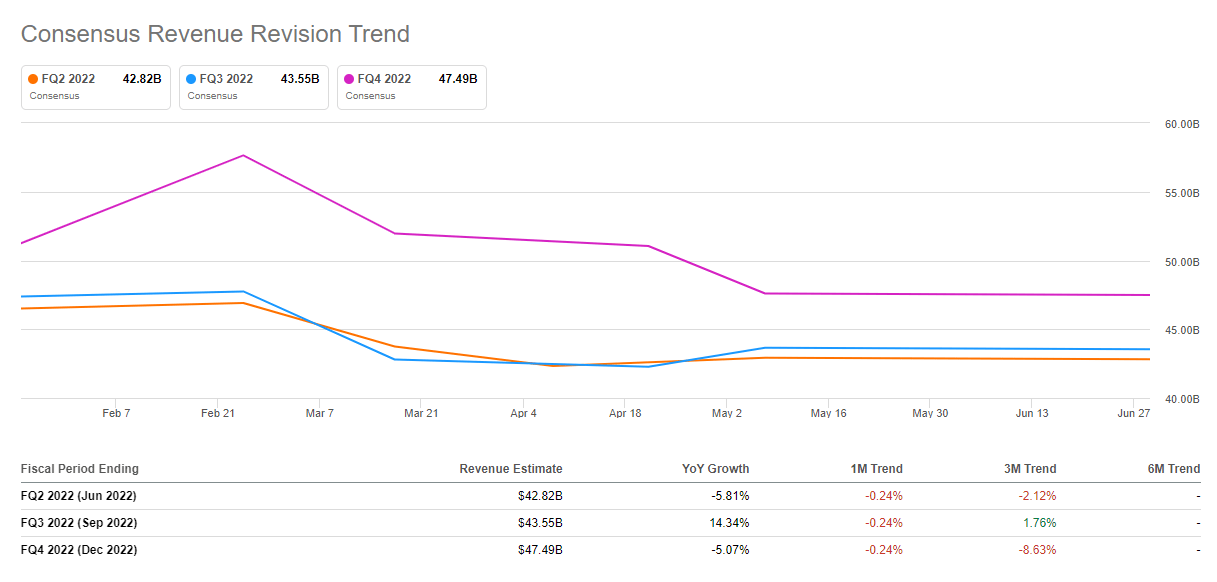
Seeking Alpha’s Quantitative Ratings system agrees with my positive assessment of the firm’s valuation and profitability, but is more critical on STLA’s growth prospects. With that said, I’m unsure where the Quant system is pulling it’s 3-5Y EPS data from showing a negative outlook.
Seeking Alpha Seeking Alpha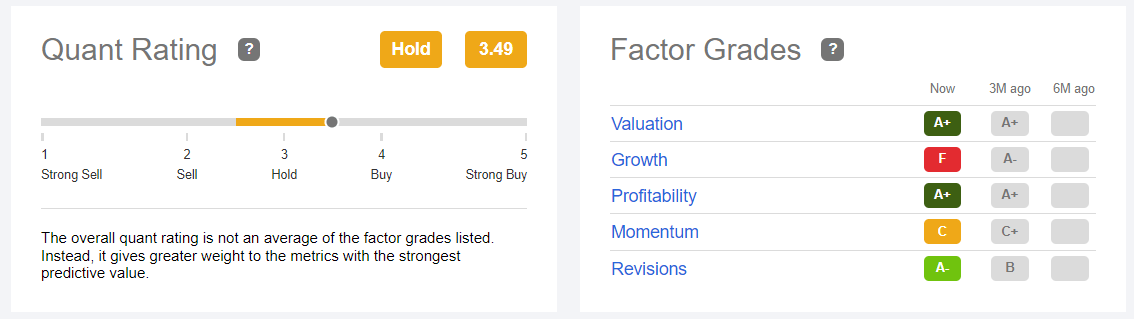
Seeking Alpha Authors however are unanimous in their assessment of STLA as a Buy, highlighting the firm’s unlevered balance sheet allowing the firm to invest freely, its strategy to double sales by 2030, and a positive residual earnings valuation of the firm.
Seeking Alpha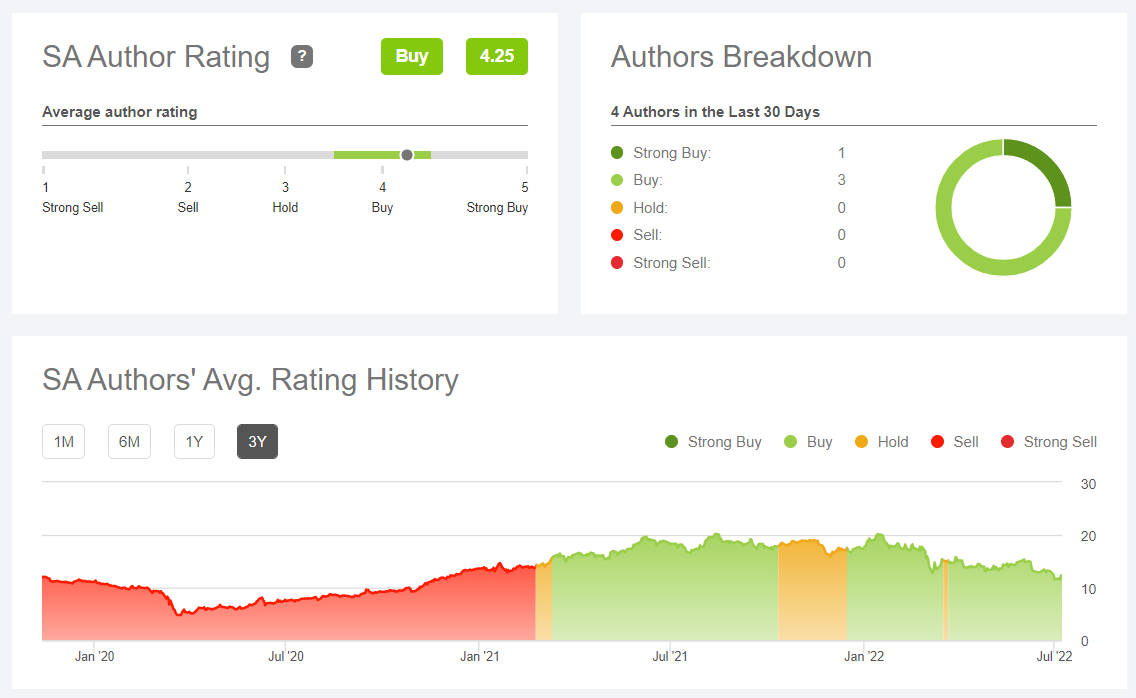
The firm’s own guidance in earnings calls shows stable growth, very safe numbers here, but unfortunately there’s still not a lot for us to go on.
There’s not much stated either in the earnings call transcript. The outlook slide only receives a mention as follows:
As regards AOI margins, we expect to continue to operate with double-digit margins and to offset headwinds in 2022, which include continued semiconductor scarcity, supply chain constraints due to labor costs and absenteeism, particularly in North America, and raw material inflation of around €4 billion year-over-year, up from the €2.25 billion in 2021.
Stellantis N.V.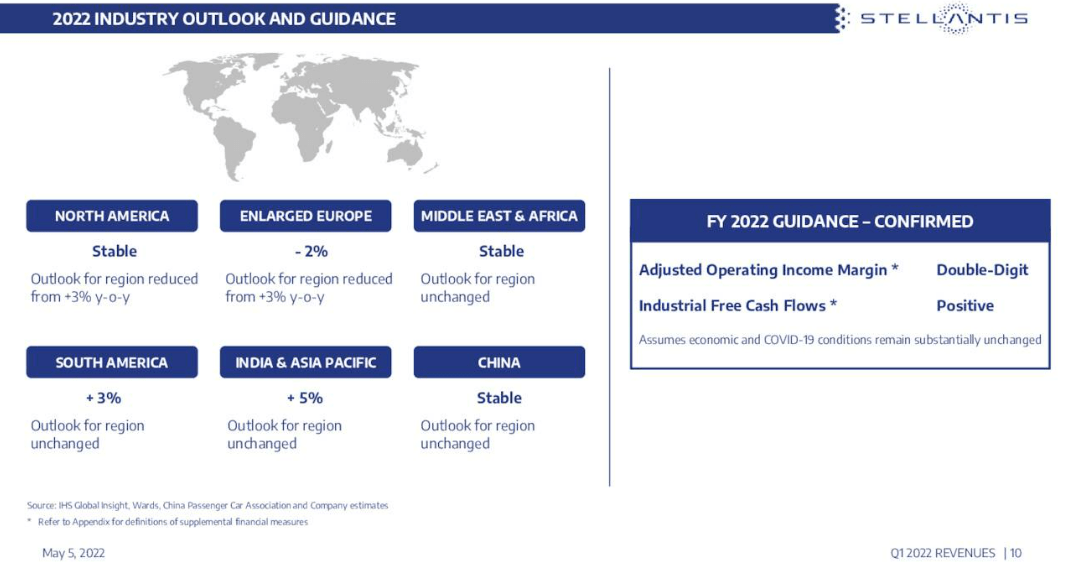
Overall, it’s hard to draw much out of the above, given the lack of coverage and data, and the firms guidance is positive but lacks much for us to go on. Perhaps we need to look at the macro environment.
Macro: Recession Fears, Shared Vehicles, Electrification, Autonomous Driving
Looking more broadly, the automotive industry is facing tough economic times. These include a potential U.S. recession, changes in the use of their product, wholesale change to their product design and build, and a change to who (or what) is actually behind the wheel of their vehicles.
A Looming Recession
High Charts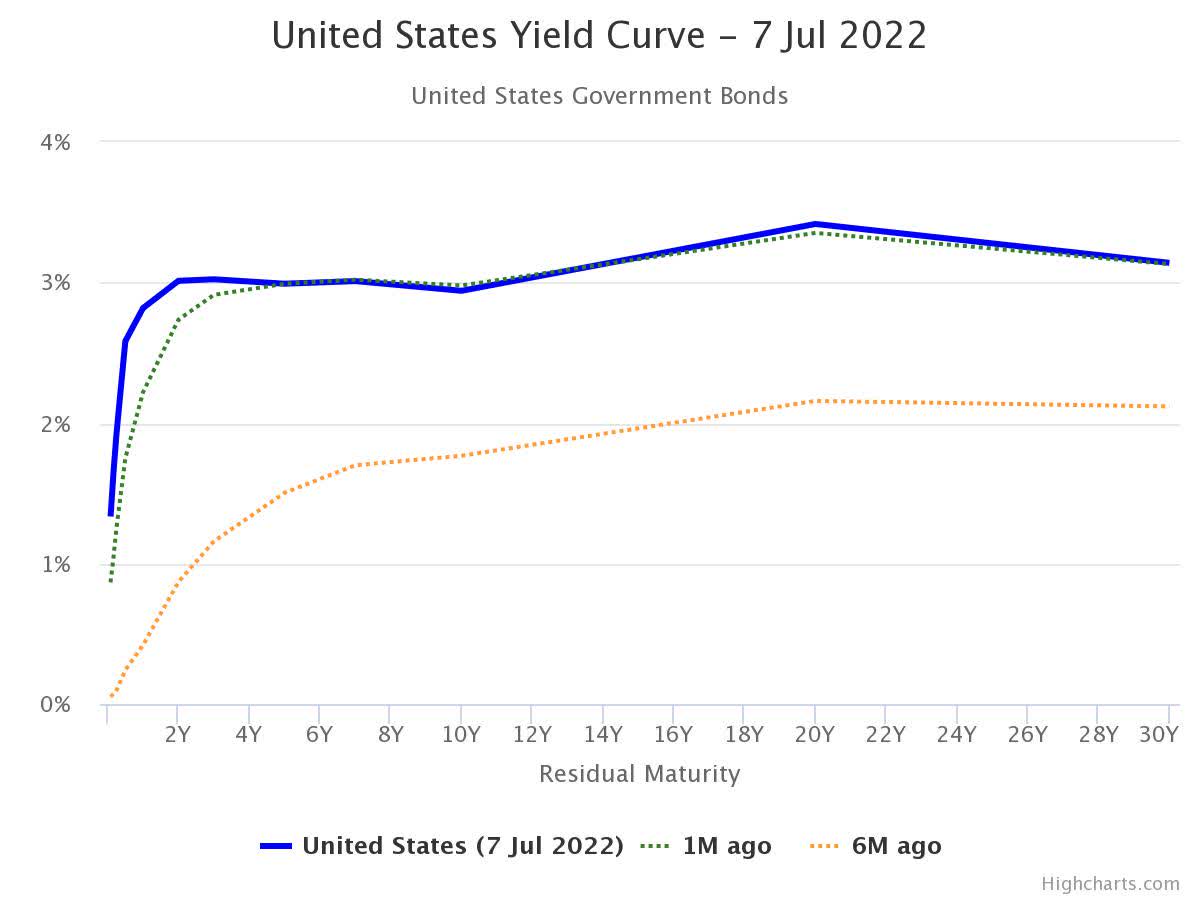
U.S. yield curves indicate a chance of a recession, and with interest rate hikes being employed to stave-off record-high inflation, those fears could be realized as spending slows.
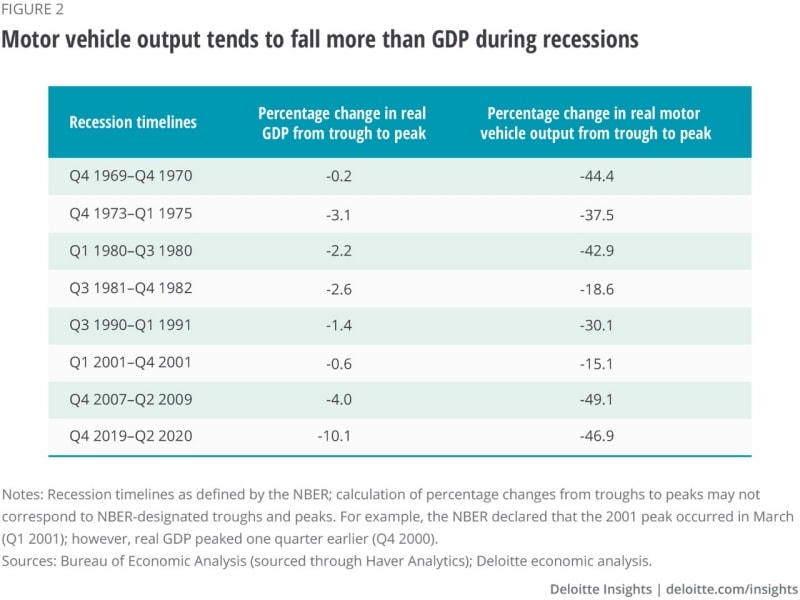
Recessions are, unfortunately, a very painful time for automakers, with a 45% correlation between the depth of a recession and the reduced output of auto manufacturers according to Deloitte Insights.
Automakers facing a recession would need to hold a healthy balance sheet capable of sustaining a significant downturn in spending on new vehicles. Luckily, this is something STLA should be capable of withstanding, given its unlevered balance sheet and good overall financial health as discussed earlier.
Shared Mobility Trend
Further changes to the automaking industry is the way in which their product is used, being shared vehicles (where consumers either ride-share or car-share). A McKinsey & Co report suggests that the shared mobility trend is likely to continue well into the future, and will play a part in a slowdown of new car sales, though not likely to cause a reversal.
Electrification
Electrification of vehicles is already a major focus of the industry, as manufacturers begin the transition away from ICE vehicles, and begin to create EV fleets and phase out fossil fuels, though not all manufacturers are doing this at the same pace.
Stellantis has already committed to an electrification strategy, and states;
We are setting the course for 100% of sales in Europe and 50% of sales in the United States to be battery electric vehicles (BEVs) by the end of this decade. And we plan to offer more than 75 battery electric vehicle models and reach global annual BEV sales of 5 million units by 2030.
Autonomous Vehicles
The other trend that is already beginning to play a part in changes to the auto manufacturing industry is the rise of autonomous vehicles.
Beyond driver assistance systems, the auto industry is racing to build vehicles that are completely independent of human input. The 3 major factors here that I feel will govern the shift in this space are consumer taste (those who want an autonomous vehicle vs those who like driving), regulation (is automated driving legal, how will the vehicles or owners be licensed, who has the insurable interest, who is responsible for an accident), and the technology itself.
Stellantis has already delivered what it calls the “L3Pilot Automated Driving Project,” a study used to showcase the viability of SAE Level 3 automated driving functions on public roads, and to evaluate user acceptance, driving behavior and the impacts on traffic and safety of autonomous vehicles on European roads.
Its next project is called HiDrive, a 4 year project which focuses on testing, demonstrating, and evaluating robust high automation functions.
On a general note, while the industry is set to see some big macro trends and changes occur, there is nothing here that gives me particular concerns for the long-term view of STLA, particularly around a 5 year and beyond timeframe.
Risks: Supply Chain, Probe Into Potential Abuse of Labor Rights
With all the positivity, there do exist a number of potential risks to the firm, including potential regulatory risks surrounding labor relations in one of the firm’s manufacturing plants, and the ongoing supply chain challenges affecting raw materials and semiconductors.
The issue of labor relations comes from a probe requested by the U.S. into whether workers were blocked from “being represented by the group of their choice, the Miners Union, and that it dismissed workers who backed the group.”
The concern here is that companies that violate workers rights under the USMCA trade pact could lose their tariff-free status.
Regarding supply chain issues, investors would be familiar with the same narrative playing out for Stellantis that affects all manufacturers relying on imports of raw materials and processed inputs, particular semi-conductors.
Stellantis’ particular woes come in the form of sharply falling output, which a report by The Italian Federation of Metalworkers claimed that output would fall by as much as 220,000 vehicles through 2022.
Valuing Stellantis
Relying on peer analysis, I calculate the following scenarios for STLA.
STLA valued based on median industry metric values
If we consider Stellantis “just another car manufacturer,” with no particularly special qualities about it, then we can build a base valuation for the firm around median pricing of it’s metrics.
I start with the most basic and common valuation metrics, Price to Earnings, Price to Book, Price to Cashflow, and a Price to Cash Flow Margin metric.
Author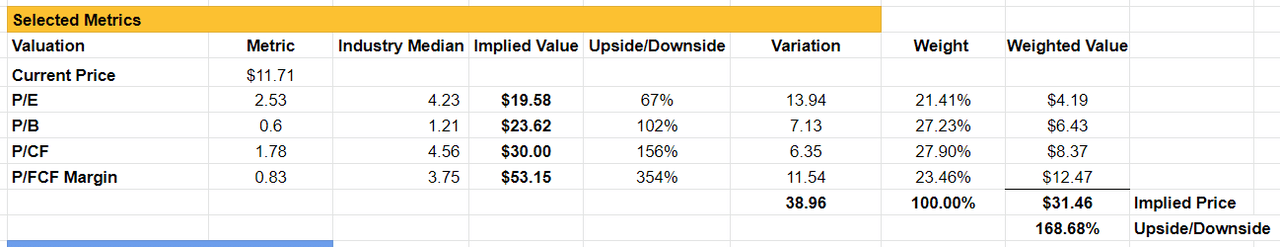
I’ve assigned weights to these metrics based on each metrics’ standard deviation from the mean across the industry, starting by trying to find which metrics produce the least noise. “Noisier” metrics are assigned a weaker weight than those that feature less variation.
With a relatively even distribution of weighting, we build a base positive upside of ~170% at $31.46.
STLA valued based on median industry metric values, with respect to metric correlation to pricing
Taking into account the correlation between each of these metrics and the industry price to sales, P/E has a negative correlation ~5%, P/B has no correlation (a perfect 0%), P/CF has a positive 16% and P/FCF Margin is positive 89%.
Using these correlations as weights, we see an even further bullish case for STLA.
Author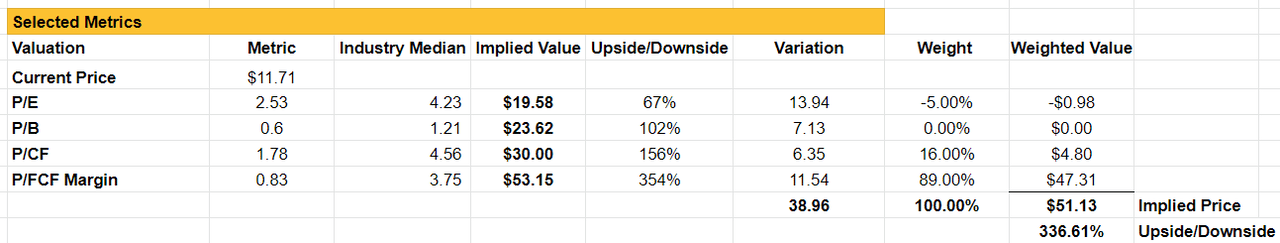
It’s worth noting that a peer analysis relies heavily on the market’s attitudes towards the industry overall, with the industry median P/E sitting at 4.23 vs the S&P P/E Median of 14.89, suggesting that the market overall is bearish on the industry vs the wider market. No surprises there given a looming recession, supply chain issues and significant changes in electrification and automation.
(If STLA was valued in line with the S&P median P/E, it would be valued at a $68.92, a 480% upside, giving it a market cap of $222B, and making STLA the second most valuable car manufacturer on earth, slightly larger than Toyota (TM) at $213B, but still well short of Tesla at $706B).
multipl.com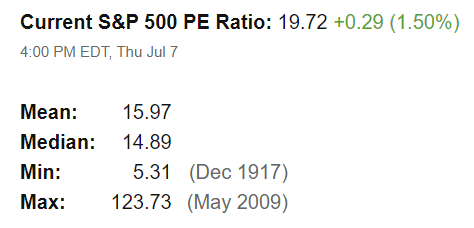
Looking closely at the metrics and correlations, I feel most confident in using P/CF as a base metric for valuation, given it has a 16% correlation but with a less noisy standard deviation. This gives STLA a price of $30, and a 156% upside, which is within the same ballpark as other analysts. At $30, STLA would have a market cap of $97B, making it the fourth most valuable auto manufacturer behind Tesla (TSLA), Toyota (TM) & BYD Company Limited (BYDDF, OTCPK:BYDDY).
Explaining The Mispricing Of STLA
If I were to hazard a guess at why the mispricing of Stellantis exists, I would point to the fact that the firm has only been a listed entity since mid-January, 2021. STLA was formed after a merger between PSA Group and Fiat Chrysler Automobiles.
In my mind, this means two major factors are at play:
Firstly, the newly created STLA does not have a long history of financials as a single entity for investors to rely on for their research and understanding of how the firm will operate. This could create hesitation in the minds of some investors who would rather wait and see how STLA performs as a consolidated group before putting money into the firm.
Secondly, given that the entity is fairly new, there may be individuals like myself who had never heard of the firm before, despite being familiar with the brands it owns.
And given that a firm’s pricing is the result of demand and supply, potential investors on the demand side may have no awareness of the firm, and therefore it doesn’t benefit from a strong following of investors in the market providing a solid base of buyers propping up the price.
In support of this theory is a Google Search trends history indicating that interest in the search term “Stellantis” in the context of “Automobile Manufacturer” currently sits at around 28% of peak search volume, where peak occurred in the week of the announcement of the merger.
Google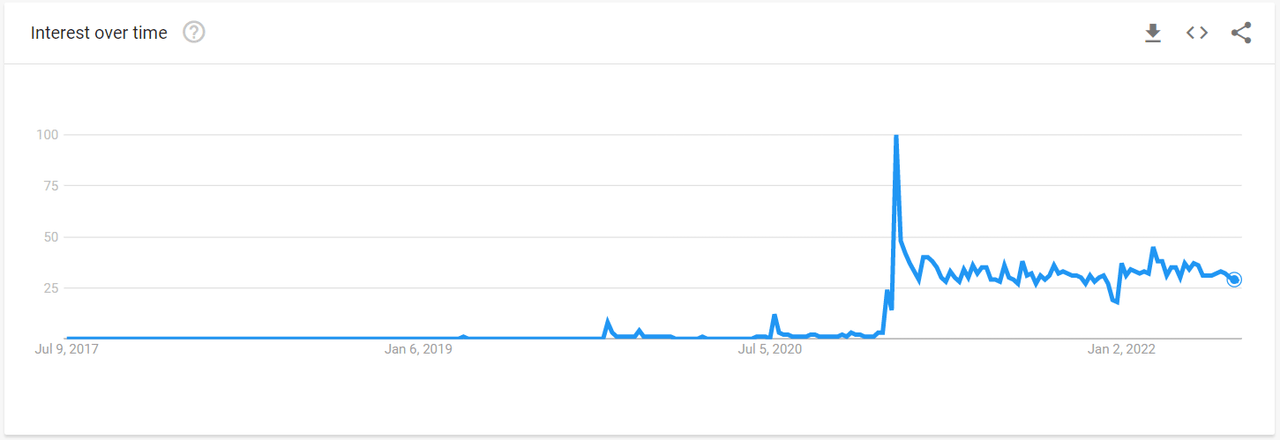
Where this theory may come unstuck however, is that the general public and “Other” owners make up the second-largest ownership type at 32%, with a combined market value of 12.47B shares. And as far as trading volume goes, STLA average trade volume sits at a little over 5.5m shares per day, making it one of the top traded shares in its industry.
Seeking Alpha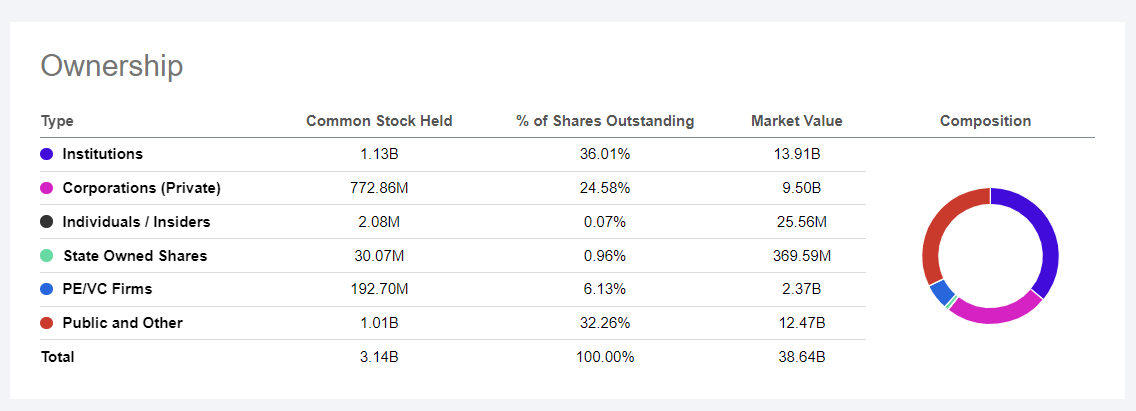
Another theory, is that perhaps smarter investors than I know something about the firm that I don’t.
Be the first to comment