

Taiyou Nomachi/DigitalVision via Getty Images
Investment Thesis
Costco Wholesale Corporation (NASDAQ:COST) investors must not be fooled by the pessimistic market reaction, since the stock market has also been noticeably flat since October’s CPI results and Powell’s dovish commentary. There will be more volatility in the short-term, due to the overly bullish November labor market and service industry reports, significantly worsened by the November CPI report released on 13 December and, consequently, the Feds supposed 50 basis points hike on 14 December. However, we choose to look at the bright side, despite the high possibility of a recession in 2023 and the raised terminal rates to over 6%.
With the addition of two new locations in China by the end of FY2023, COST will likely report a remarkable boost in sales over the next few quarters, significantly aided by China’s unexpected reopening cadence. Analysts are already projecting a flurry of ‘revenge’ spending, with the country’s GDP recovering tremendously to 5% by 2023, against the projected 3% in 2022 and the previous 6% in 2019.
Though COST has not historically broken down its specific geographical revenue in regard to China, the international segment has previously accounted for 13.2% of the company’s revenue in FY2022. Its popularity in the country is not to be reckoned with as well, since the first store opening in 2019 has previously triggered an early closure and a three-hour jam due to the massive consumer appetite. Given how China has been under lockdown for the past three years, we reckon the pent-up demand to be significantly over the roof indeed.
COST Continues To Execute Brilliantly
COST Revenue, Gross %, EBIT %, Net Income ( in billion $ ) %, and EPS
S&P Capital IQ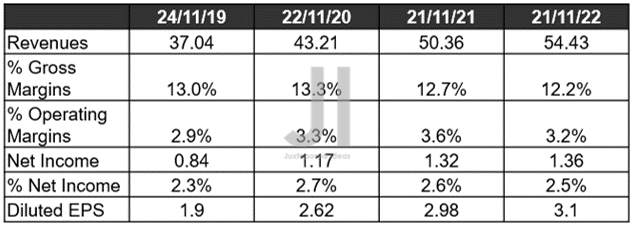
Inflationary pressures have not spared COST, due to the notable -0.5 percentage point YoY impact on the gross margins in FQ1’23. However, we must also highlight that these numbers represent a notable 0.4 point QoQ expansion, pointing to the mastery of its global supply chain thus far. Its EBIT margins have also improved by 0.1 point QoQ, despite the rising operating costs. Thereby, pointing to the strength of the management’s operating cost efficiency, triggering a 4.37% YoY expansion on its EPS to $3.10.
Furthermore, the quarter’s result includes a -$0.15 charge due to the downsizing of its charter shipping activities though a $0.12 benefit on Stock-Based Compensation. Therefore, it is not quite a fair YoY comparison, given the -$0.03 EPS shortfall from the FQ1’22 results, of a -$0.2 write-off and $0.21 benefit on Stock-Based Compensation. Combined with FX headwinds of -$0.12 per share, it is immediately evident that COST has continued to perform brilliantly.
COST Membership Growth ( in billion $ )
S&P Capital IQ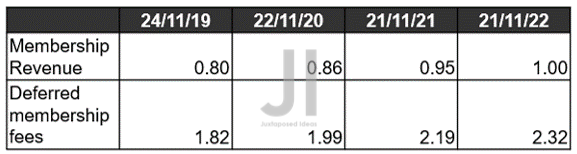
Furthermore, its membership revenue continues to expand excellently by 5.26% YoY in FQ1’23, despite the tougher YoY comparison and supposed peak recessionary fears. We must again highlight the FX headwinds in its membership revenues by up to -$32M for the quarter, which would have indicated an adj YoY growth of over 9%. Combined with the robust deferred membership fees of $2.32B, it appears that there is no demand destruction at COST indeed, as renewal rates in the UCAN region remain excellent at 92.5%, with the worldwide rate coming in hot at 90.4%.
COST Cash/ Investment, Inventory, and Debt ( in billion $ )
S&P Capital IQ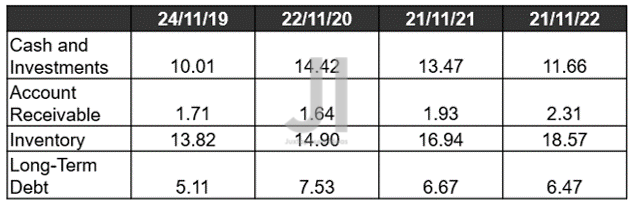
COST’s balance sheet remains stellar, with $11.66B of immediate liquidity and $2.31B of accounts receivable for FQ1’23. While inventory has also increased by 3.74% QoQ and 9.62% YoY to $18.57B, we are not concerned as well, since the company continues to move $54.43B worth of inventories for the latest quarter, while sustaining its debt levels at $6.47B. Impressive indeed.
COST Projected Revenue, Net Income ( in billion $ ) %, EBIT %, EPS, FCF %, and Dividend
S&P Capital IQ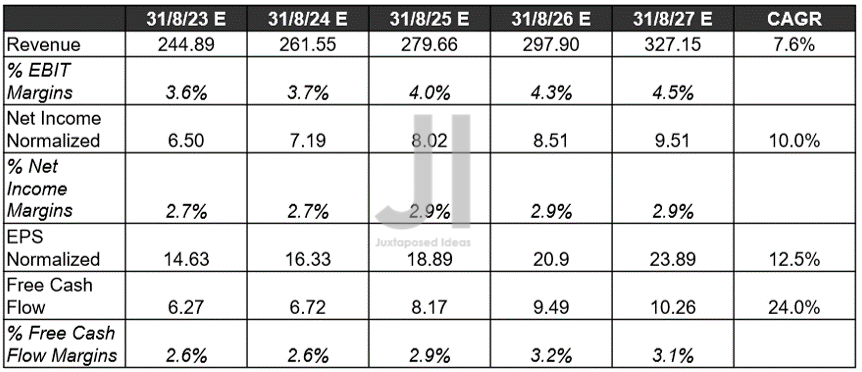
Furthermore, the growing pessimism about the slowing economic growth has not impacted COST’s top and bottom-line growth through FY2027 at all. In fact, Mr. Market has notably upgraded its Free Cash Flow generation by 6.49% for the next two years, potentially triggering an improved dividend payout ahead. We’ll see.
In the meantime, we encourage you to read our previous article, which would help you better understand its position and market opportunities.
- Costco: Waiting For A Discount That Is Never Coming
- Costco: More Expensive Than Ever – Maybe Its Premium Is Justified
So, Is COST Stock A Buy, Sell, Or Hold?
COST 5Y EV/Revenue and P/E Valuations
S&P Capital IQ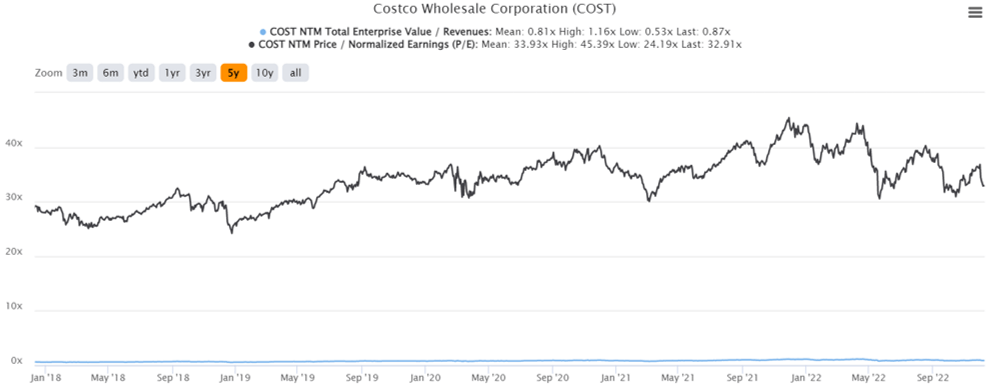
COST is currently trading at an EV/NTM Revenue of 0.87x and NTM P/E of 32.91x, relatively in line with its 5Y mean of 0.81x and 33.93x, respectively. Otherwise, under-valued based on its YTD mean of 0.96x and 37.18x, respectively.
COST YTD Stock Price
Seeking Alpha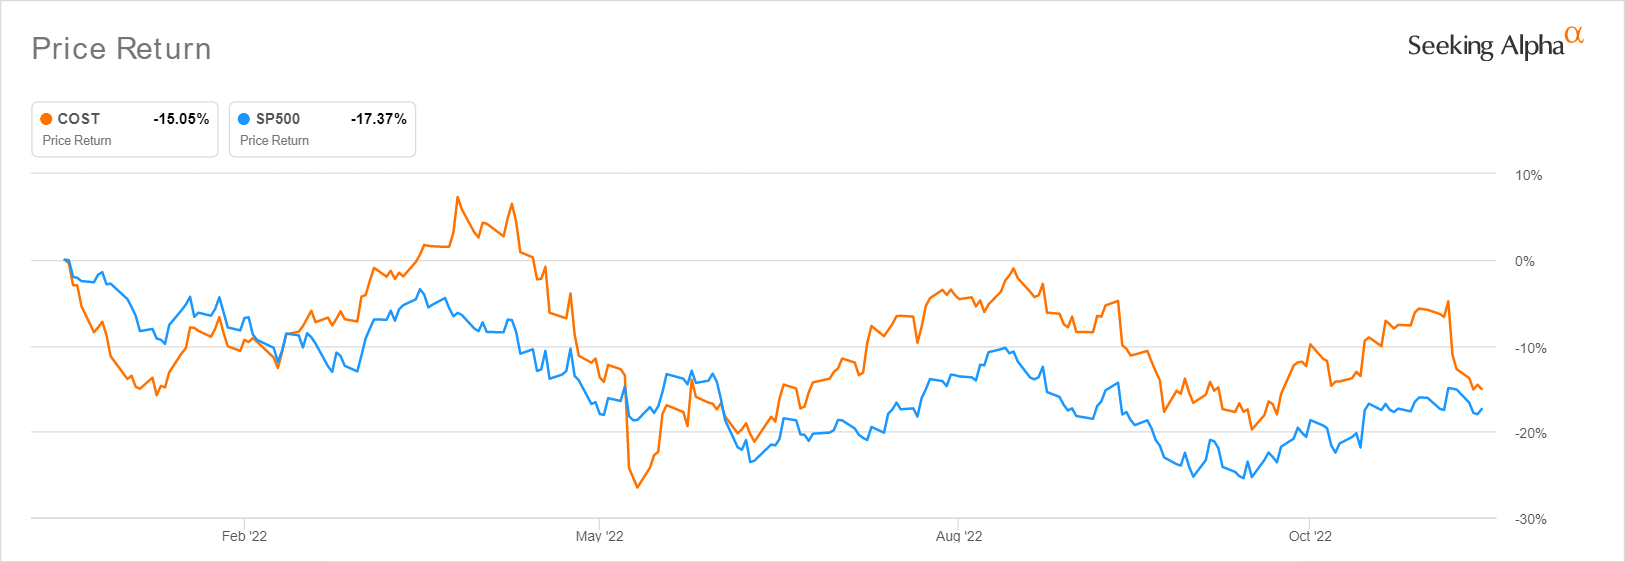
Furthermore, the COST stock is trading at $480 (after-market), down -21.6% from its 52 weeks high of $612.27, though at a premium of 18.07% from its 52 weeks low of $406.51. Consensus estimates remain bullish about COST’s prospects as well, due to their price target of $555.00 and a 15.28% upside from current prices. Combined with the factors discussed above, we continue to rate COST stock as a Buy at the low $400s, for an improved margin of safety and next decade portfolio growth. Otherwise, there is always no harm nibbling at every dip, depending on individual investors’ dollar cost average. Good luck, all.
Be the first to comment