

Eric Thayer/Getty Images News
Thesis
Costco Wholesale Corporation (NASDAQ:COST) has demonstrated strong revenue growth, improving margins and industry-leading efficiencies. The company may not be a value play to the short-term investor; however, this is a quality stock and offers stability during this time of uncertainty and upside to the long-term investor. We will demonstrate why you want this defensive and quality company as an anchor in your portfolio.
Costco scores high on various quality measures. This quality comes at a price and we do not expect the company to offer up a bargain. Even though it is currently 15% off its 52-week highs, the 10-yr total return is still a strong 23% CAGR, including dividends.
Every company is looking down the double-barreled gun of high inflation and recession, and a squeeze in discretionary consumer spending is expected across the board. However, Costco is well positioned due to its structure where it gets better deals by volume purchasing, working on thin margins, rapid inventory turnover, and passing on the savings to its loyal customers/members.
Cash Flow Returns on Investment have been persistent and improving year after year. This is expected to continue going forward.
“It’s far better to buy a wonderful company at a fair price than a fair company at a wonderful price” – Warren Buffett. Ironically, Berkshire Hathaway sold its holdings in Costco in 2020 missing out on over 60% appreciation in the share price.
Overview
Costco Wholesale Corporation operates membership warehouses offering members low prices on a limited selection of products in a wide range of categories producing high sales volumes and rapid inventory turnover. As of November 2022, Costco operated 842 warehouses with 686 in North America and the remaining 156 stores spread worldwide.
Over the last 10 years, Costco has significantly outperformed the S&P 500, and its rivals. We will investigate why Costco has been such an excellent performer and whether we can expect this to continue.
Costco Comparative 10yr Share Price Performance (ROCGA Research)
Value Drivers – Financial Breakdown
Let us now try and identify the drivers of value, similar to a DuPont-like breakdown. The secret of long-term value generation is growth, efficiency, and returns.
Retail Companies Value Drivers (ROCGA Research)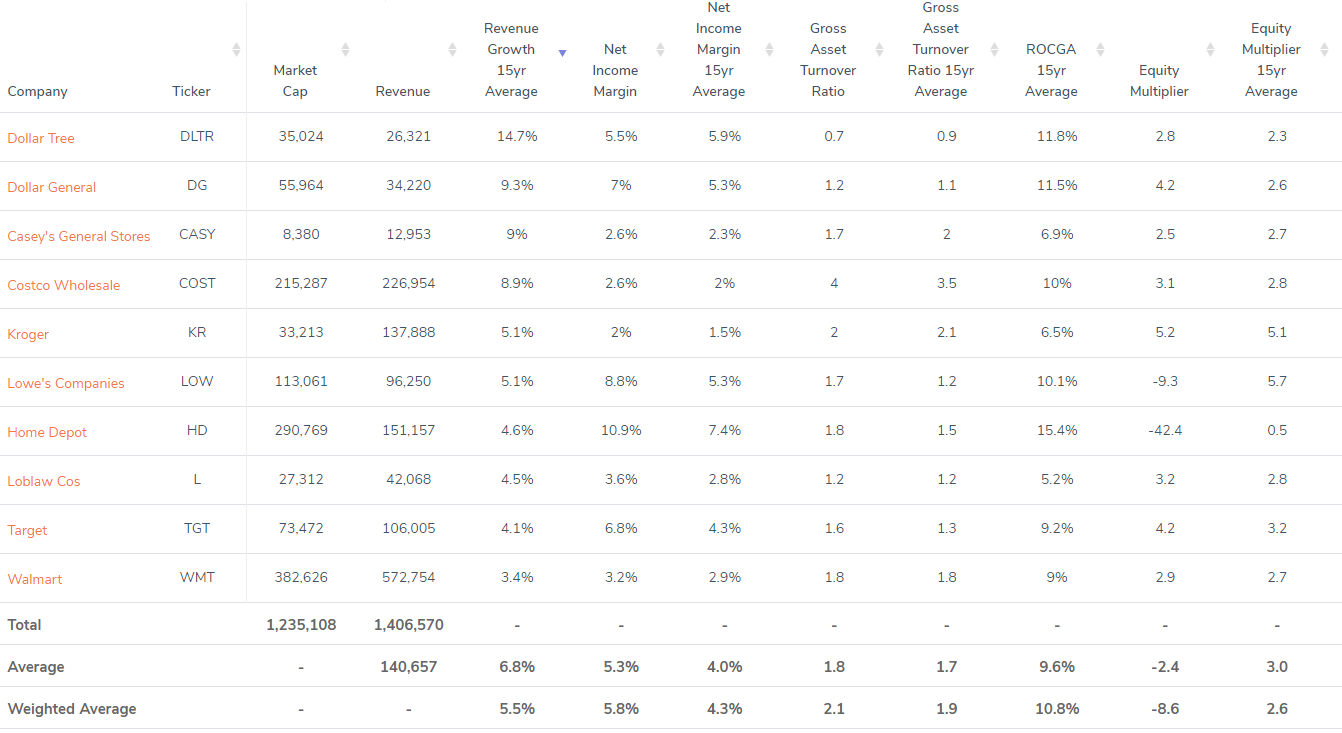
Among its peers, Dollar Tree (NASDAQ:DLTR) has the highest average 15-yr revenue growth, and this is due to its acquisition of Family Dollar in 2016. The next three on the list are hovering around 9% and then this drops to 5% and below. We will only compare the top three companies, Dollar General (NYSE:DG), Casey’s (NASDAQ:CASY), and Costco. Of these, Costco has the lowest average net income margin but the highest asset turnover, giving it the highest returns of gross assets at 7%.
Costco Financial summary (ROCGA Research)
Costco is a high-growth business, with revenue growth of 15.8% in 2022, EPS growth of 16.6%, and DPS by 13.4%. The 15-yr CAGR for revenue has also been very strong at 8.8%, EPS at 12.0%, and DPS at 12.9%
For efficiency, we look at asset turnover, using revenue over gross assets. Instead of using the book value of the asset, these are standardized to estimate a replacement value. The more notable adjustments are capitalizing operating leases and inflation adjustments. More information on gross assets, gross cash, and Cash Flow Returns on Investments can be found on Bartley Madden’s page, and in the paper “The CFROI Life Cycle“. Bartley Madden has been a significant contributor to the Cash Flow Returns on Investment methodology. A more user-friendly breakdown can also be found here.
Retail Companies Valuation Ratio (ROCGA Research)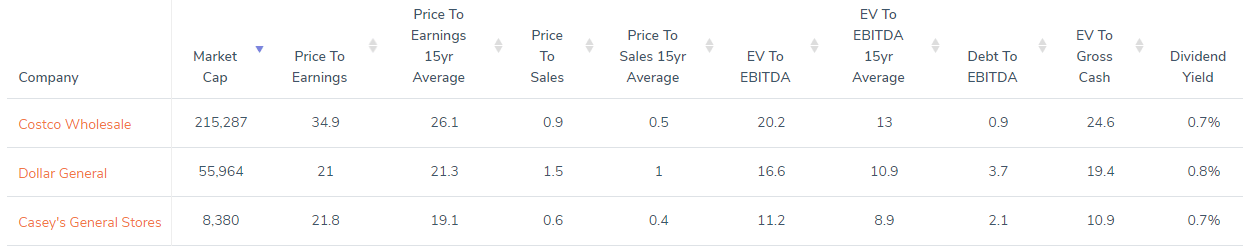
Strong top-line growth and the highest returns on assets translate to Costco having the highest valuation ratios. What are they doing right and is it sustainable?
Costco Gross Asset Turnover (ROCGA Research)
Total Cash Generating Assets have been increasing at varying rates on a yearly basis (see below). Asset turnover (see above) has been consistently high indicating any additional investment has always been utilized to generate revenues without delay.
Total Cash Generating Assets (ROCGA Research) Costco Income Margin (ROCGA Research) Costco Returns on Cash Generating Assets (ROCGA Research)

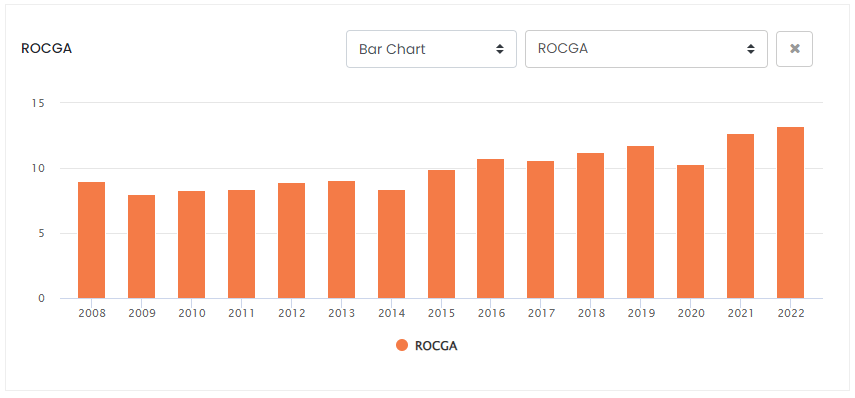
Consistent gross asset turnover, increasing revenues, and improving margins have resulted in improving economic returns, the Returns in Cash Generating Assets, and the Cash Flow Returns on Investments equivalent. This has also propelled the share prices from $70 ten years ago to the current $526, an increase of 650%, or 680% if you include dividends. This equates to a CAGR of 22.5%.
Financial Analysis
During the pandemic, revenue increased by 17.5% in 2021 and 15.8% in 2022. This is significantly higher than the 15-yr average of 8.8%. EPS over the same period increased by 24.9% and 16.6%, again higher than the 15-yr average of 12%.
For the nine weeks that ended October 30, 2022, the Company reported net sales of $39.19 billion, an increase of 9.0% from $35.97 billion last year. Consensus estimates also peg revenue growth to moderate to about 7-8% for FY23 and FY24. Estimated EPS growth is about 11% for the next couple of years. The estimated revenue and earnings growth is in line with the 15-yr averages.
We put the estimated earnings into our model and the forecasted Returns in Cash Generating Assets continue the upward trend, increasing from 13.2% in 2022 to 13.6% in FY23, 13.9% in FY24, and 14.6% and 14.9% for the next two years.
Costco Returns on Cash Generating Assets Forecast (ROCGA Research)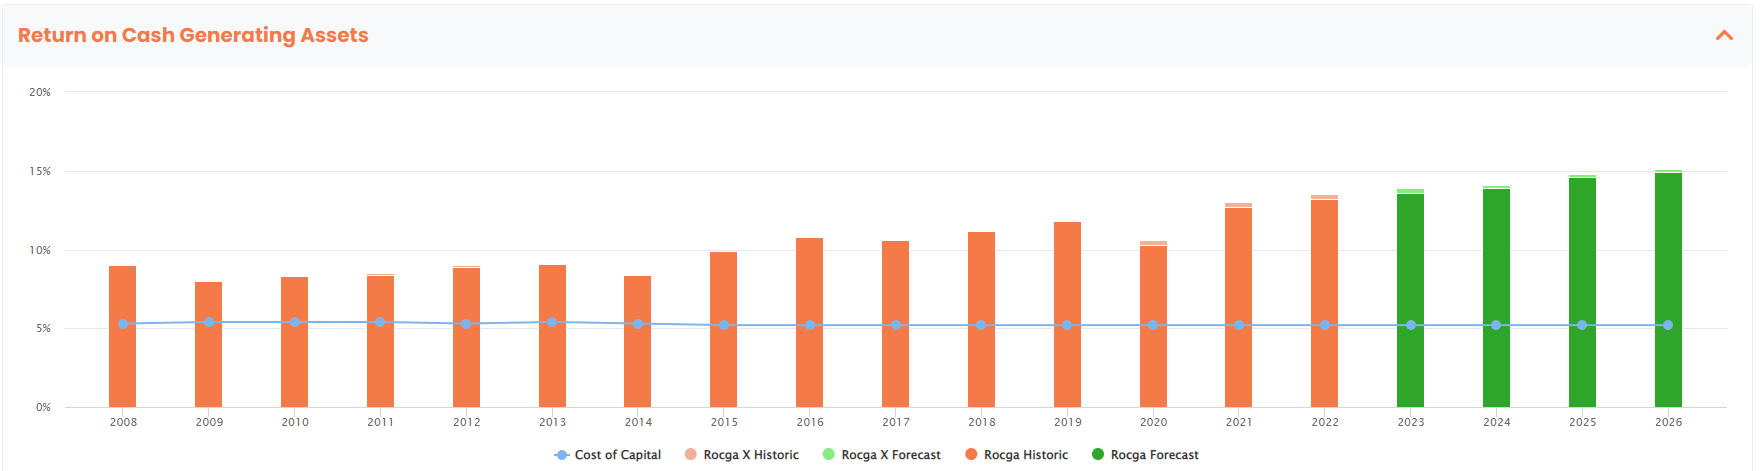
Conclusion
The average 3-yr historical PE ratio is 34. This is significantly higher than the 15-yr average of 26.1. Costco has commanded a higher valuation recently due to the higher growth during the pandemic and the quality and stability it offered. With the pandemic behind us, the FY24 PE of 31.9 is still higher than the long-run average, indicating future growth may already be baked into the current share price. The 15-yr average PEG ratio is just over 2 and the forecast is pointing toward 3.
Costco has been a growth stock but now as we enter a period of uncertainty, is also taking on the role of a defensive stock. The high valuation does not offer a short-term value play but Costco is for long-term investors looking to allocate a portion to a quality company with a strong record as a value compounder. Also, as a cushion, the company has $11 billion in cash. When the tide goes out, expect Costco to emerge with its dignity intact. Buy.
Be the first to comment