

Alberto Masnovo/iStock via Getty Images
Investment thesis
Corteva Inc. (NYSE:CTVA) has been in an uptrend since July 2020, while greatly outperforming both the basic materials sector and the agricultural producers’ industry since its IPO in 2019. The stock could repeatedly break out after forming a sound base, a great stock for swing traders who trade this type of setup. Since my last article on the company, where I categorized the stock as a buy position, especially in a high inflationary environment, the stock could confirm its leadership and after some consolidation, progress to higher heights. My most likely price target is set at $71, resulting in a 14% medium-term upside potential from its latest closing price, with limited downside risk.
A quick look at the big picture
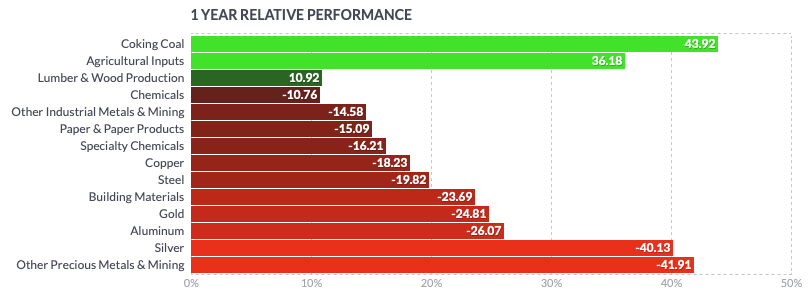
The basic materials sector in the US is among the losers in the last 3 months, with especially precious metals but also industrial metals and chemicals leading down the sector. The agricultural inputs industry could instead keep up very well, despite giving some recent signs of a slowdown, the industry is among the leaders of the group in the past year.
finviz finviz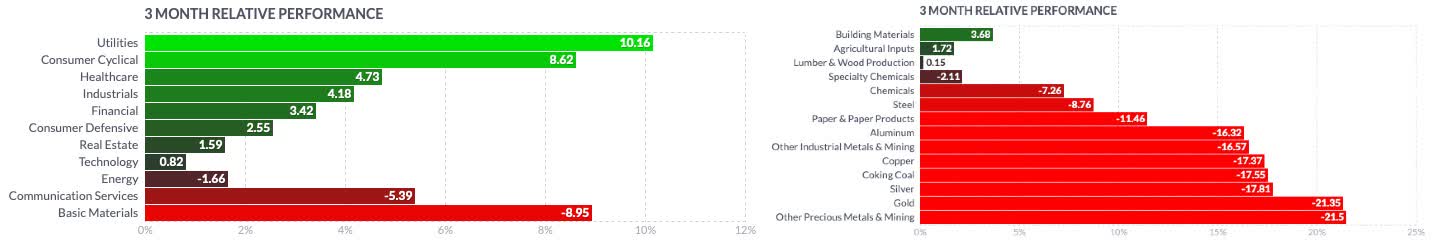
The MSCI Global Agriculture Producers ETF (VEGI) began to show relative strength in July 2020 and has since then outperformed its reference by peaking in April 2022. Despite a recent pullback and consolidation around its EMA200, the industry reference seem to be set for further growth, as some signs of relative strength are building and the recent macroeconomic events seem to further support this industry.
Author, using TradingView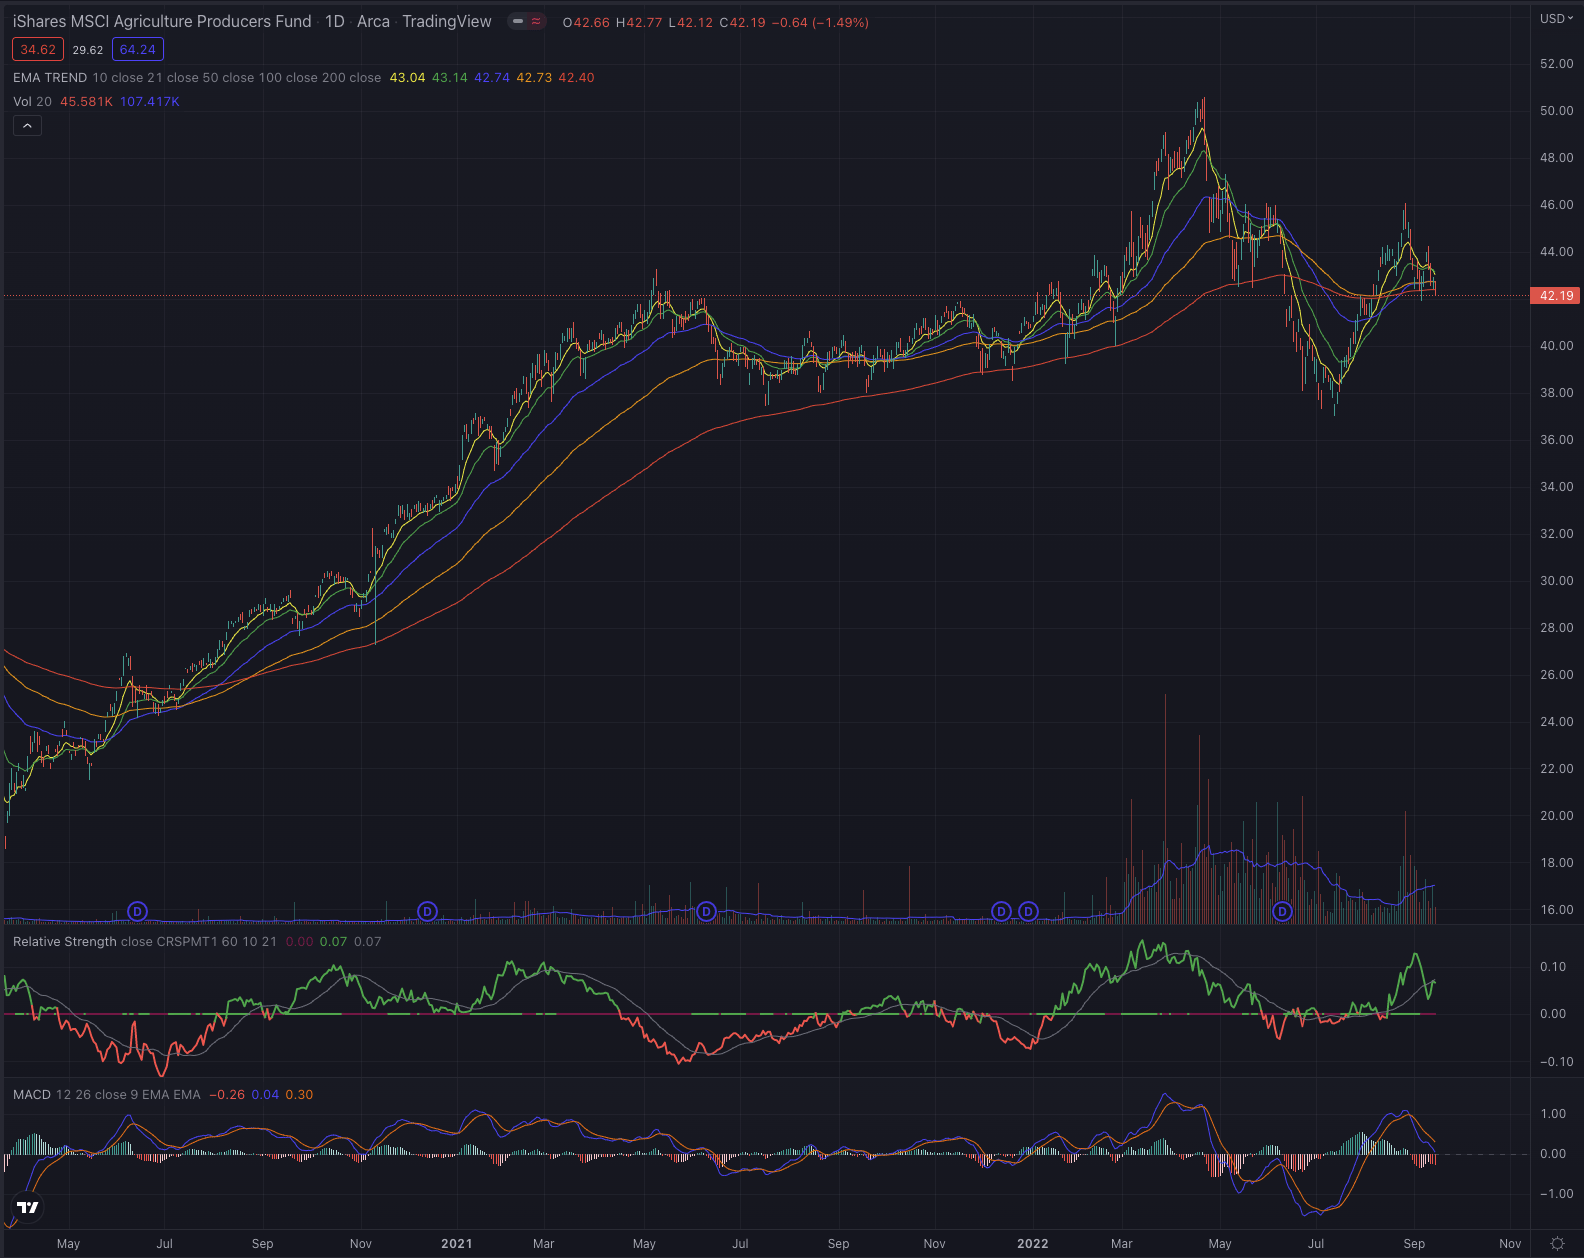
Looking back even further, Corteva significantly outperformed its main sector reference and could establish itself as a leader in its industry, reporting 111.29% performance over the past 3 years, 120% better than its industry reference, and even more than 3 times the performance of the S&P 500.
Author, using SeekingAlpha.com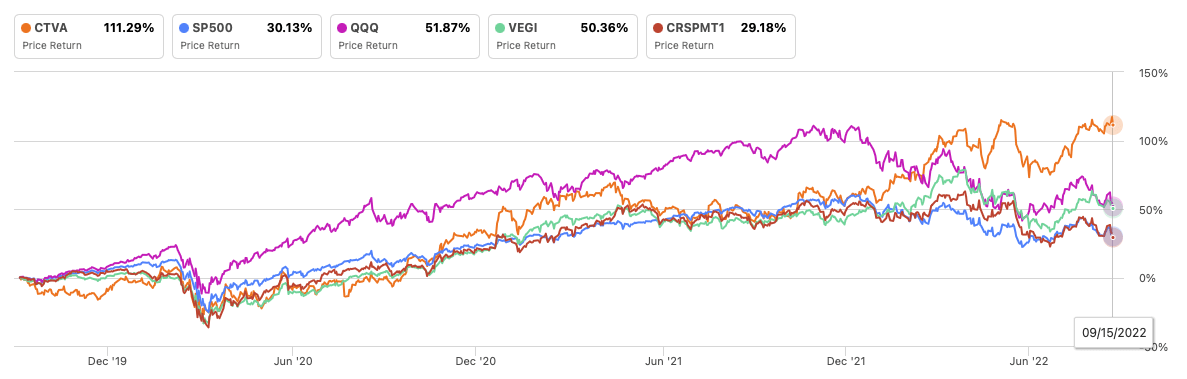
Where are we now?
Corteva is a strong leader in its group as shown by the following chart, which shows the stock price action since its IPO in June 2019. Besides some short periods of weakness, the stock has repeatedly formed sound bases from which it started a new strong uptrend.
Author, using TradingView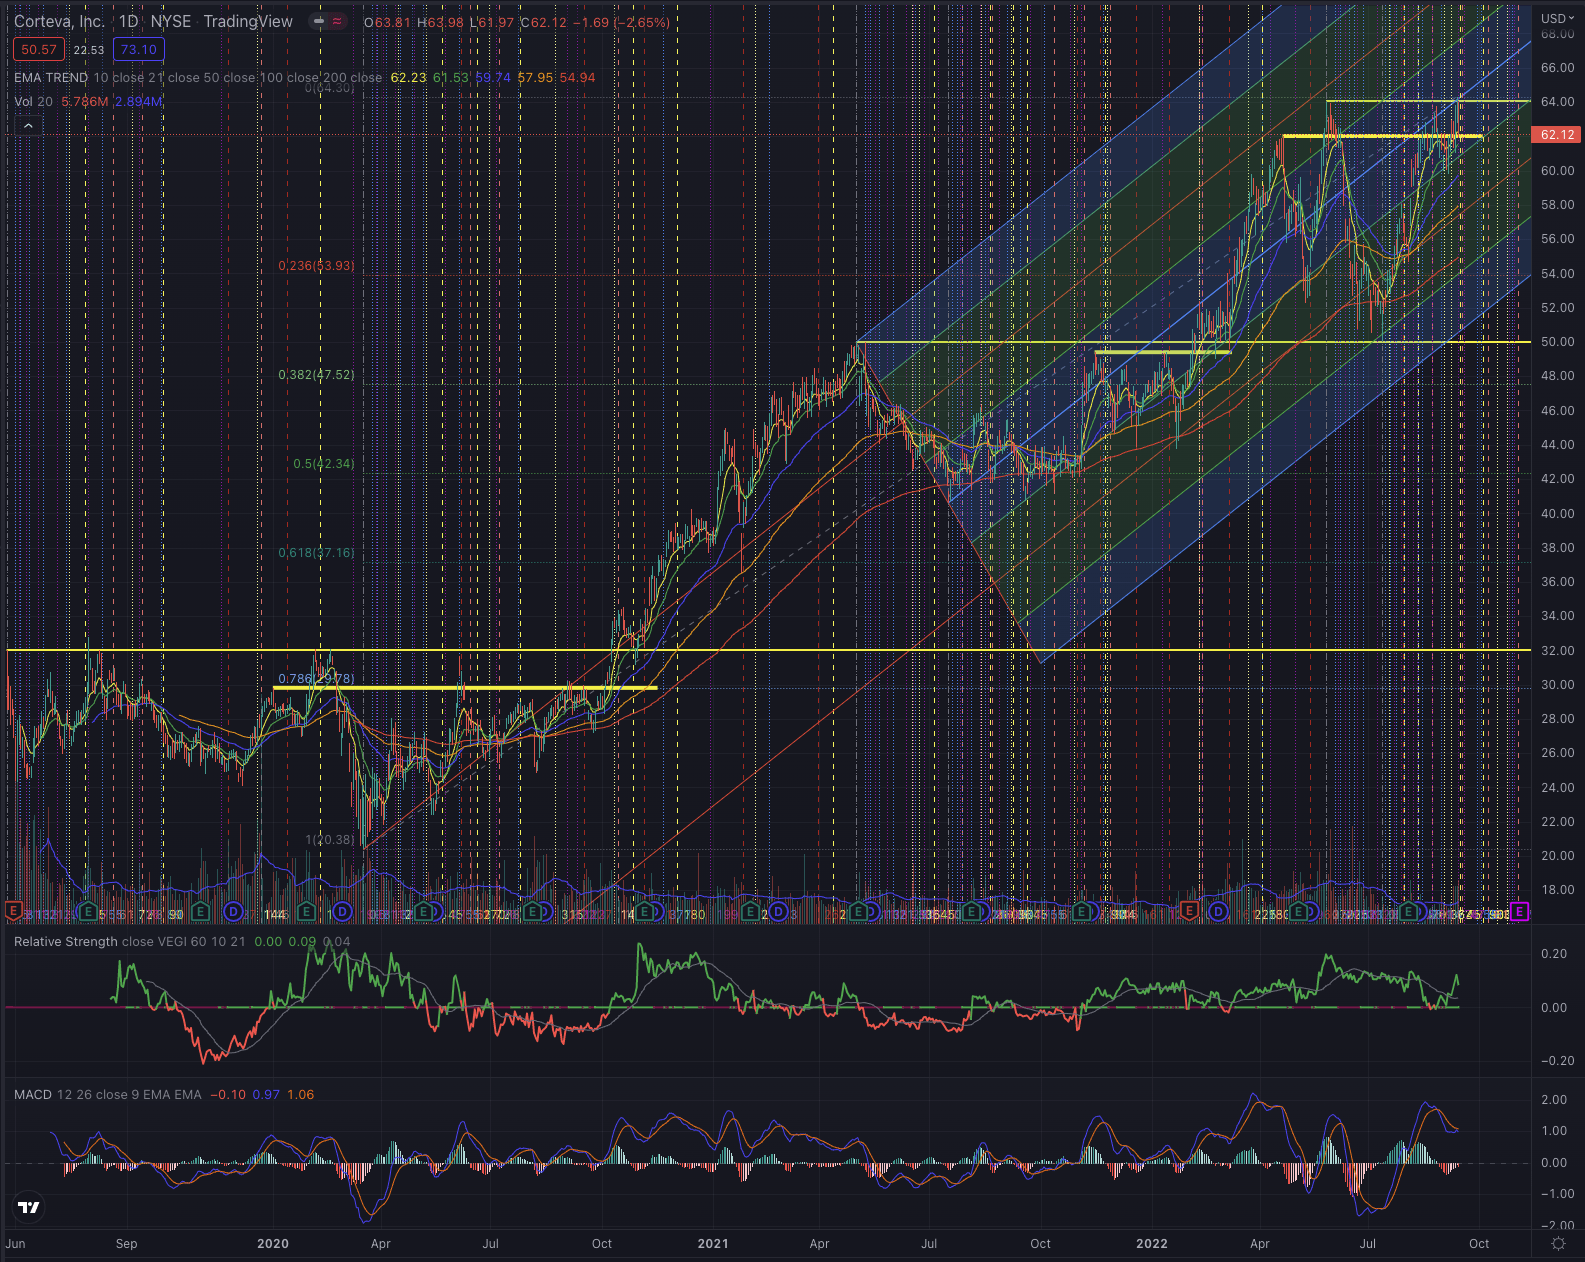
Since my last article Corteva: A Top Pick For A High-Inflation Environment, the stock has without surprise consolidated, as I mentioned would be likely the case, since the stock was quite extended at that point. The stock has tested its previous breakout level, retracing until $50, and immediately bounced back on increasing volume. In the past month, the stock is forming a new sound base from which it has now reached new highs, showing significant relative strength and supported by its most important trailing moving averages, which are all still hinting at a strong positive trend.
Author, using TradingView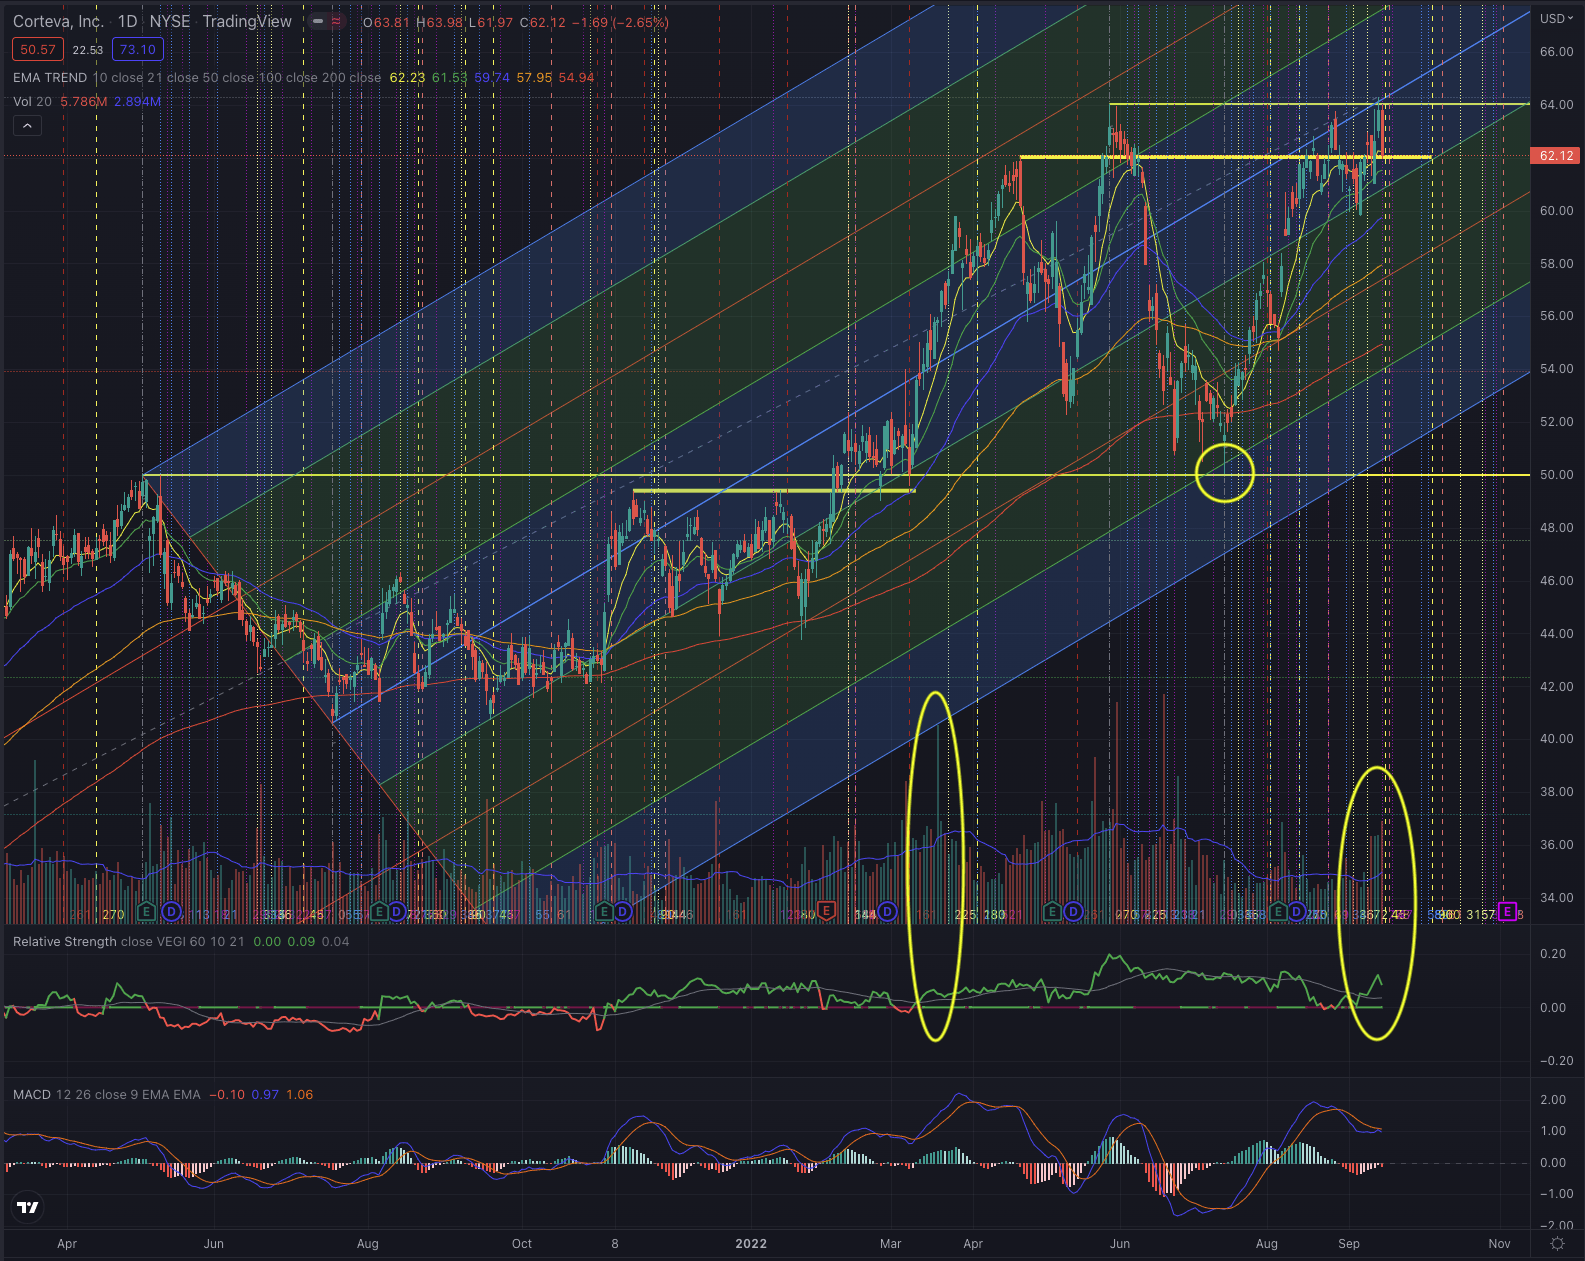
The stock is now testing its overhead resistance and this situation is normally characterized by some progressive contractions in volatility and volume until the stock would either break out on higher volume or fail in its attempt while being rejected, and start a new pullback. Although the stock seems quite extended, some significant relative strength is building up again and the momentum is also confirmed by its MACD, which could be rising over its signal line.
What is coming next
The actual situation is not uncommon for Corteva, as the stock has shown to be a strong leader and after some periods of consolidation, its price has reached new highs. I expect the stock to continue to outperform its reference sector and industry in the near term, as the stock is still in my opinion fundamentally undervalued, considering my previously set target price at around $71. Technically the stock seems to be more likely to continue its outbreak attempts, which could lead to some short pullbacks, and investors should consider giving the stock enough space to breathe to avoid being stopped out too early.
Author, using TradingView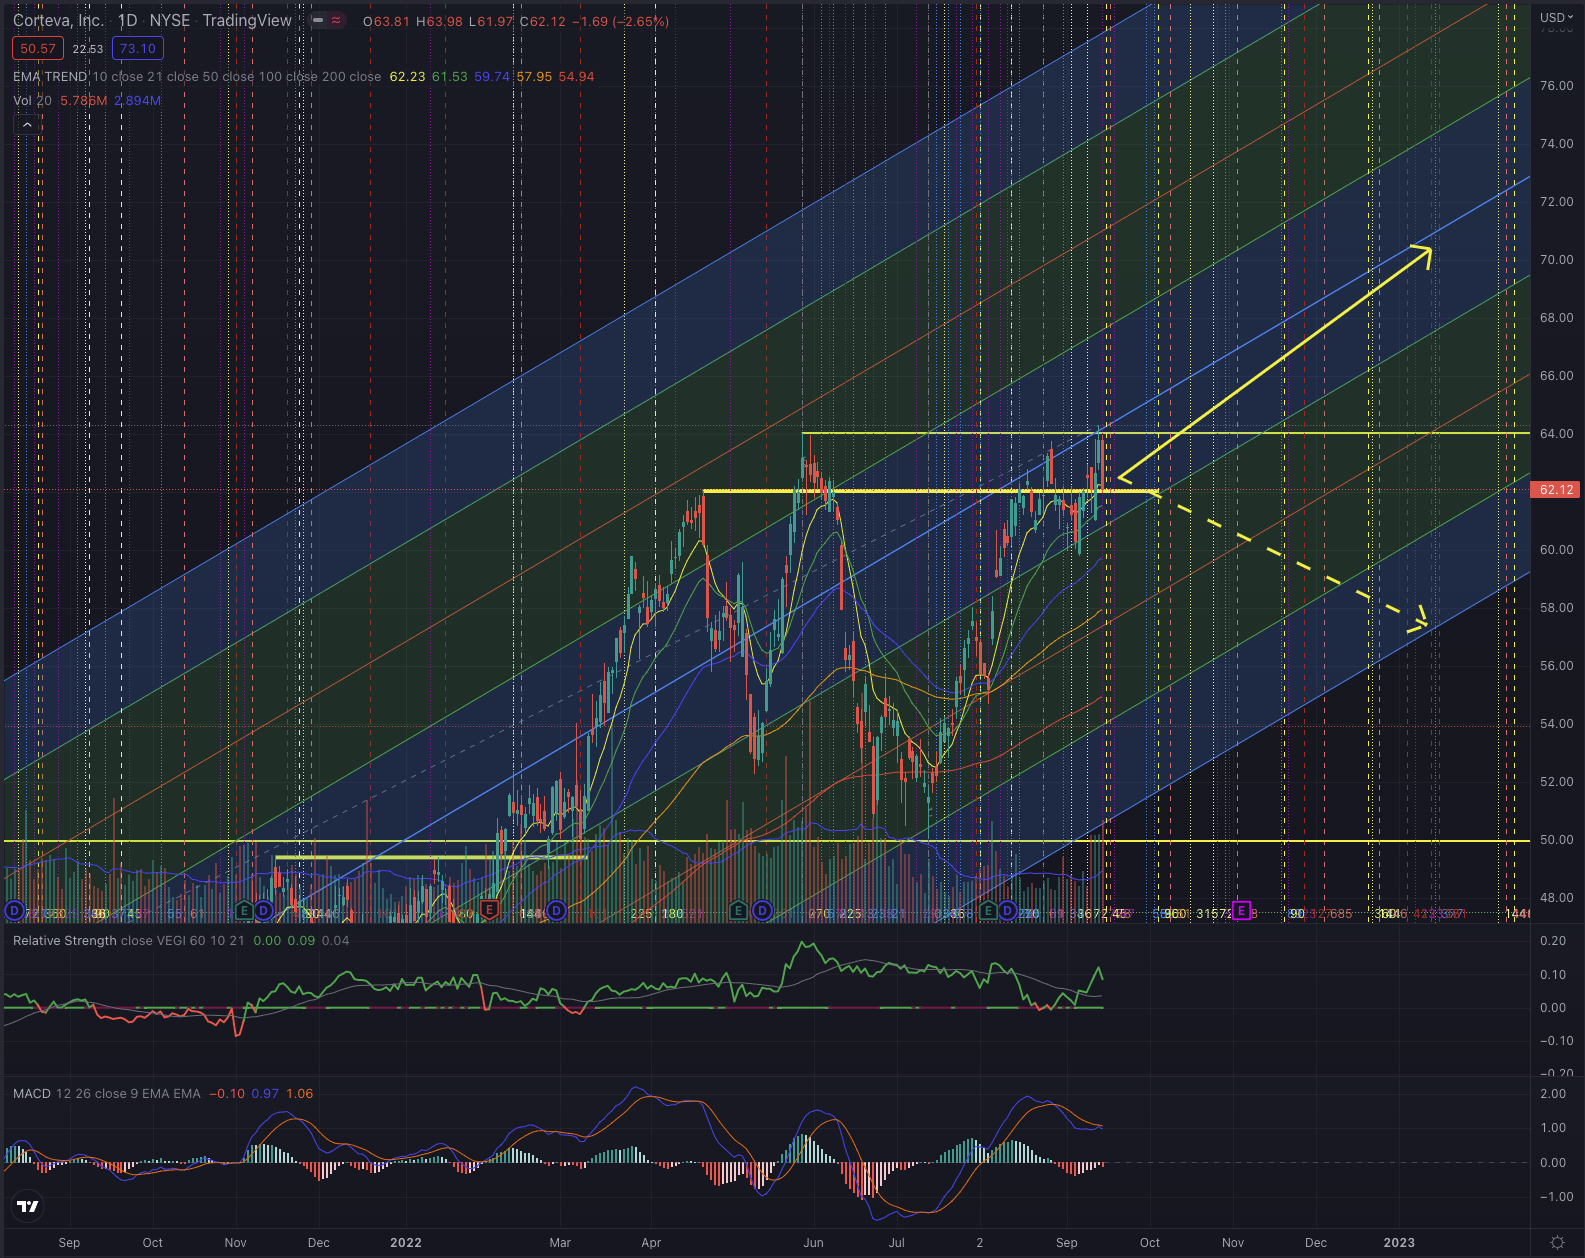
The EMA50 is an important technical support for the stock and violations under that price level could bring the stock to retrace until around $57-$58. Any violation under the EMA200 could be a big red flag for the stock and should act as the very last sell signal, while actual stop-loss levels are seen in a more aggressive way under $60, and further under $57.
If the stock succeeds in its breakout from the actual base, my calculations suggest the most likely price target being around $71, which is in line with my fundamental valuation of the stock’s price.
Investors should observe the price action and how the stock behaves at the next support and resistance levels evidenced in my chart, and how an eventual attempt to overcome its resistances is confirmed or rejected, by particularly observing the trading volume in both directions and the relative strength.
The bottom line
I consider techniques based on the Elliott Wave Theory, as well as likely outcomes based on Fibonacci’s principles, by confirming the likelihood of an outcome contingent on time-based probabilities. The purpose of my technical analysis is to confirm or reject an entry point in the stock, by observing its sector and industry, and most of all its price action. I then analyze the situation of that stock and calculate likely outcomes based on the mentioned theories. Corteva likely bottomed on July 14, as it tested its former resistance level and has since reached new highs and is forming a sound base. The stock is likely set for further growth as both my fundamental and my technical price targets are pointing to a stock price of around $71. While showing significant relative strength, the stock is also reinforced by strong support levels and its positive-trending moving averages, while its volume recently greatly increased. Any significant violation of important support levels should not be ignored and appropriate stop-loss levels should be set, even though in the near term, I see the stock more likely continuing in its positive trend and reaching new highs.
Be the first to comment