

Juanmonino/iStock via Getty Images
Investment Thesis
My previous article on Cornerstone Strategic Value Fund, Inc. (NYSE:CLM) garnered some interest, so I have formulated this piece as an elaborate extension of the previous article.
As a diversified, closed-end management investment company, CLM has a well-performing portfolio of investments and has set a well-received tradition of making attractive monthly distributions in recent years. While the quality of the portfolio is likely to continue delivering significant capital gains and dividends, the reducing ratio of dividend income to declared distributions to shareholders, as well as the declining ratio of dividend income to assets, means that the company has to increasingly rely on return-to-capital to support distributions.
With company policy-imposed restrictions on investment exposure expected to come more into play, limiting the Fund’s options to grow its holdings in the key technology sector, the Fund may soon have to review and adjust its distribution and investment policies and strategies.
This, coupled with enhanced regulatory scrutiny as heralded by the adoption of rule 2a-5 under the Investment Company Act of 1940, could invite the market to recalibrate the valuation of CLM stock.
CLM’s Investment and Distribution Policies have served the Fund well thus far
Over the years, CLM has successfully counted on its investments, distributions, and rights offerings to shore up the value of its shares.
Investments
CLM’s investment policies emphasize long-term investment in equity securities, seeking long-term capital appreciation. CLM has a solid but diversified portfolio spread across many sectors. Allocation based on contribution to the Fund’s total net assets as of December 31, 2021, was 24.5% to the information technology sector, 13.4% to healthcare, 12.2% to consumer discretionary, 10.9% to financials, 10.6% to communication services, 6.8% to closed-end funds, 6.5% to industrials, 5.8% to consumer staples, 3.5% to exchange-traded funds, 1.9% to materials, 1.9% to real estate, 1.4% to utilities, 0.1% to energy, and 0.5% to others. The allocation largely mirrors the weights of the sectors in the S&P 500.
Attesting to the quality of the portfolio, the value of the Fund’s investment in net assets increased from $380 million in 2016 to $1,227.3 million in 2021, growing by an average of 26% per year. The value of the Fund’s investments jumped from $769 million in 2020 to $1,226.9 million in 2021, delivering a remarkable net assets increase of $458 million or 59.6%, compared to a decline of 5% in 2020.
Net asset value per share declined by 32% in aggregate from 2016 to 2021, while net investment income per share declined by 96% from 2016 to 2021. The Fund attained an impressive $203.2 million increase in net assets in 2021 compared to an increase of $103.3 million in 2020, a 97% jump.
CLM shares have been selling at a premium to Net Asset Value in recent years.
|
Date |
Shares Issued |
Net Assets |
Distribution Amount per Share reinvested |
Net Asset Value (NAV) per share |
Sales Price per Share on the NYSE |
Premium to NAV |
|
March 18, 2022 |
121,018,695 |
$9.13 |
$14.01 |
53.45% |
||
|
December 31, 2021 |
1,227.4 million |
$1.92 |
$10.23 |
$14.29 |
47.04%* |
|
|
April 9, 2021 |
$10.02 |
$13.60 |
35.73% |
|||
|
December 31, 2020 |
77,475,671 |
$769.0 million |
$2.23 |
$9.93 |
$11.73 |
31.68%* |
*After reflecting the reinvestment of monthly distributions for the year.
While these numbers suggest that the stock could be approaching a plateau in terms of its ability to generate value per share, CLM nevertheless maintains a very positive market sentiment hence a high premium on its share price.
Cornerstone Strategic Value Fund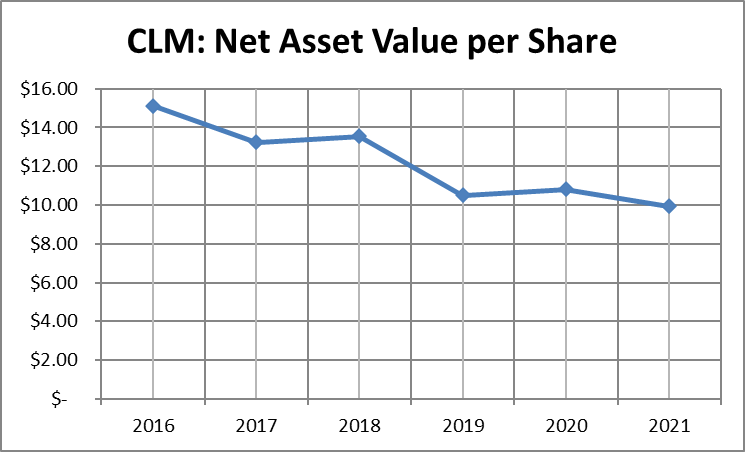
The Fund has substantially grown its net assets by arising from rights offerings, reinvestment of dividends, and capital appreciation. While an increase in size should typically lower the Fund’s expenses as a proportion of net assets, CLM does not derive commensurate benefit from economies of scale. The Fund’s expenses comprise largely of the Fund’s investment adviser fees, set as a percentage of Net Assets.
The Fund’s investment adviser Cornerstone Advisors, LLC, is entitled to receive a monthly fee at the annual rate of 1.00% of the Fund’s average weekly net assets. Hence, costs have tended to move almost in tandem with net assets. In 2021 compared to 2020, dividend income increased by 10% while expenses increased by 38%. Investment management fees made up 90% of total expenses in 2021.
CLM primarily invests in growth companies with large capitalizations. At least 95% of its assets are in U.S. listed companies. The Fund’s top ten holdings as of December 31, 2021, were:
|
Holding |
Sector |
Percent of Net assets |
|
|
1 |
Apple Inc. |
Information Technology |
6.4 |
|
2 |
Amazon.com, Inc. |
Consumer Discretionary |
6.0 |
|
3 |
Microsoft Corporation |
Information Technology |
5.8 |
|
4 |
Alphabet Inc. Class C |
Communication Services |
5.2 |
|
5 |
Berkshire Hathaway Inc. Class B |
Financials |
2.7 |
|
6 |
UnitedHealth Group Incorporated |
Health Care |
2.3 |
|
7 |
JPMorgan Chase & Co |
Financials |
2.2 |
|
8 |
Tesla, Inc. |
Consumer Discretionary |
2.2 |
|
9 |
Meta Platforms, Inc. Class A |
Communication Services |
1.9 |
|
10 |
NVIDIA Corporation |
Information Technology |
1.9 |
Source: The Fund’s top ten holdings
These top 10 holdings are well-established entities that offer stable earnings and have greater potential for capital appreciation. Nvidia, Tesla, Microsoft, Alphabet, and Apple are among the best-performing stocks in the S&P 500, contributing to most of its gains in 2021, constituting about 30% of the S&P 500 by weight. Nvidia Corp. gained 125.3% in 2021, while the five big tech stocks: Microsoft, Google, Apple, Microsoft, and Amazon, returned a 52.5% gain in 2021 and together had a market cap of $7.2 trillion. In 2020, Nvidia gained 122.3%, Apple 82.3%, and Amazon 76.3%.
The fund is highly invested in information technology stocks, with the sector accounting for 24.5% of its total holdings in asset value terms as of December 31, 2021, up from 24.1% in 2020. In terms of individual stocks, Apple, Amazon, Microsoft, and Alphabet Inc. each account for more than 5% of the Fund’s total assets.
The policy places an investment ceiling of 25% in any one sector and 5% in any one stock, which means that CLM will find itself constrained from making any further investments in what has been the most rewarding sector and stocks.
Rights Offerings
Rights offerings, typically offered at a discount on market value, are a regular feature for CLM and are popular with shareholders.
|
Year |
Shares Issued |
Of which oversubscription |
Subscription Price per Share |
Total Offering |
|
2021 |
26,029,753 |
Oversubscribed |
$10.64 |
$420,000,000 |
|
2018 |
26,784,596 |
11,930,479 |
$13.46 |
$360,520,662 |
|
2017 |
14,454,716 |
4,787,408 |
$13.86 |
$200,342,364 |
|
2016 |
6,783,942 |
N/A |
$14.11 |
$95,721,421 |
|
2013 |
3,158,284 |
1,579,142 |
$23.68 |
$74,788,165 |
|
2012 |
970,072 |
N/A |
$23.96 |
$23,242,931 |
|
2011 |
1,433,722 |
716,861 |
$24.36 |
$34,925,455 |
|
2010 |
358,457 |
N/A |
$32.96 |
$11,812,869 |
Source: SEC filings & Home | Cornerstone Strategic Value Fund, Inc.
CLM has been partly using the proceeds from the right offerings to provide funding for future distributions.
Distribution
Under the Fund’s Distribution Policy, CLM makes attractive monthly distributions to stockholders who can reinvest all or a portion of these distributions in additional shares or receive them in cash through the Fund’s dividend/distribution reinvestment plan. A distribution percentage of 21% of net assets was approved for the calendar years 2021 and 2022, with the monthly distribution amount for the year 2022 set at $0.1808 per share and for the year 2021 set at $ 0.1602 per share.
The distribution may include its net income and net capital gains or return-of-capital. Much of the distributions that CLM made to its stockholders for 2016, 2019, and 2020 comprised not of income or gains generated from the Fund’s investment portfolio but a return on its stockholders’ capital.
Dividend and Distributions Paid from 2016 through 2020
|
Years |
Total Dividends and Distributions $ |
Earnings |
Return-of-Capital |
||
|
Amount $ |
Percent % |
Amount $ |
Percent % |
||
|
2016 |
77,460,037 |
21,159,907 |
27.32 |
56,300,130 |
72.68 |
|
2017 |
94,415,301 |
48,183,699 |
51.03 |
46,231,602 |
48.97 |
|
2018 |
158,625,475 |
20,320,936 |
12.81 |
138,304,539 |
87.19 |
|
2019 |
181,607,411 |
45,786,447 |
25.21 |
135,820,964 |
74.79 |
|
2020 |
169,115,831 |
62,663,445 |
37.05 |
106,452,386 |
62.95 |
Source: Cornerstone Strategic Value Fund/fp0064414_497.htm
Distributions from earnings comprised 49% of total distributions to stockholders in 2021, an enhancement from 37% in 2020. Distributions from return-of-capital made up 51% and 63% of total distributions for 2021 and 2020 respectively. Dividends and distributions to stockholders per share declined from $3.4 in 2016 to $1.92 in 2021.
Concerning the payment of $0.1808 per share to stockholders for February 2022, the distribution is estimated to comprise net investment income (0.33%), net realized short-term capital gains (1.11%), net realized long-term capital gains (7.02%), and paid-in capital (91.54%).
With a majority of CLM’s distributions consisting largely of return of its Stockholder’s capital, the Fund’s resources available for investment can’t keep in step with the number of new shares created under the rights offerings contributing toward a trend of reducing distributions per share.
The Fund states that it has no current intent to use leverage. The Fund’s policy reserves the right to borrow money not exceeding 10% of its total assets but only for temporary or emergency purposes.
Comparative Performance
Over the last year, based on Lipper listings, diversified equity funds (DEF) were among the top performers, with an average market return of 10.38% taking position 5 among the 30 Closed-end funds classes on the Lipper listing. The DEFs were only outperformed by Energy Funds with 42.87% average market return, Natural Resource Funds (35.89%), Real Estate Funds (21.58%), and Utility Funds (15.83%).
Among the 28 diversified equity funds on the Lipper list, CLM was the third-best performing fund for the 12 months ended March 31, 2022, with a 14.2% market return, well above the 10.38% average return for diversified equity funds. It was slightly bettered by Liberty All-Star Growth Fund (ASG) with a return of 14.57% and was just ahead of Cornerstone Total Return Fund (CRF) with a return of 13.88%. CLM and CRF are both managed by Cornerstone Advisors LLC, and their success is perhaps indicative of the advisor’s managerial acumen.
Cornerstone Strategic Value Fund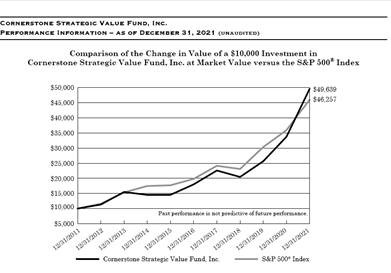
Source: The annual report for Cornerstone Strategic Value Fund, Inc. (the “Fund”) for the year ended December 31, 2021.
Conclusion
The value of CLM’s shares is supported by the quality of its diversified investment portfolio, the vigorous US economic recovery, historically attractive return on shares (attractive monthly distributions), positive market sentiments, and investor confidence, as evidenced by share price premium and oversubscriptions of rights, and the strengths of CLM’s management and advisors. This suggests that CLM shares will continue to perform well in terms of distributions and NAV in the short term.
Over the long haul, however, and unless the Fund’s investment portfolio can achieve the difficult task of replicating the sterling 2021 performance; falling distributions per share and increasing reliance on capital gains and return on capital to fund distributions, self-imposed limitations on investment options, a more or less rigid ratio of costs to net assets, declining ratio of net investment income to net assets, and average performance relative to the stock index (S&P 500), and measures being unveiled by the Fed to save the economy from overheating likely to lead to a more modest economic expansion, increased regulatory scrutiny as indicated by the adoption of rule 2a-5 under the Investment Company Act of 1940, which establishes a framework for fund valuation practices (funds are required to come into compliance with the Final Rule by September 8, 2022), etc., all point to a likelihood that the inherent value of CLM stock may not hold so well in the long term.
It would seem that some of the fund’s strategies, including its distribution and rights offering policies which have served it well in the past, may be about to more or less run their course. CLM will soon have to review its strategies and policies. Otherwise, it will find it increasingly challenging to maintain the trend it has set of high distributions.
Long-term investors may as well start considering other options.
Be the first to comment