

Zorica Nastasic/E+ via Getty Images
Investment summary
Following our previous analysis on The Cooper Companies, Inc. (NYSE:COO), the set of downside risks outlined appears to have materialized accordingly. Namely, systematic and macroeconomic drivers surrounding producer/manufacturer-based cost inflation and central bank tightening have been pulled through into the COO investment debate. Following its most recent set of numbers in September and recent growth catalysts, the medium-term picture appears murky for investors seeking exposure to the name. Shares are now priced back at pandemic lows, as seen in Exhibit 1. Here, I’ve gone into a little greater detail of the company’s growth drivers and reveal why the market may have re-rated the stock so heavily to the downside. With shares trading in line with our price target of $272 per share, we continue to rate the stock a hold.
Exhibit 1. COO now trading back in line with pandemic lows, collapsing from previous highs with authority
- COO 3-year price evolution
Note: COO total price return. 1 (Data: Updata)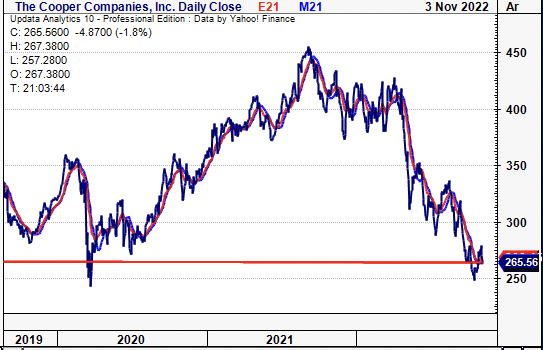
COO: Fair view of fundamentals
The company came in with a mixed set of Q3 numbers, with upsides versus consensus at the top-line. Revenue of $843 million (“mm”) grew 10.5% YoY, pulling down to reported earnings of $3.19 per share, a decline of 645 basis points YoY. Meanwhile, it recorded a $217.3mm free cash inflow, up from FCF of $180mm the year prior, and a substantial 145% sequential jump from Q2 FY22, with the bulk of FCF upside attributed to a $132.1mm YoY gain in CFFO to $263.9mm. Quarterly return on equity (“ROE”) therefore was just 1.38%, or 5.7% on a TTM basis, as seen in Exhibit 2.
Breaking the company’s ROE down further reveals the majority of shareholder profit has been driven by earnings delta over the past 5 quarters, as seen in both Exhibit 2 and Exhibit 3 below. The divergence in asset and equity value to net margin indicates to me a weakening of earnings quality and also that ROE has been propped up by an increase in assets and therefore equity over this period. This is particularly relevant as 31% of COO’s asset base is comprised of goodwill (a non-amortizable, non-cash asset) with another 16.6% comprised of intangible assets, with intangibles increasing ~360bps YoY.
Exhibit 2. ROE delta majorly attributed to softer earnings versus movements in asset and equity value, or a combination of 3
Data: HB Insights, COO SEC Filings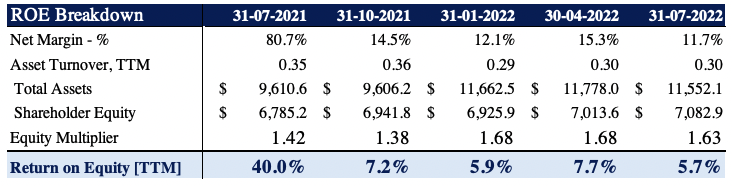
Exhibit 3. Divergence between asset + equity value to earnings (net margin) illustrates impeding headwinds to profitability
Data: HB Insights, COO SEC Filings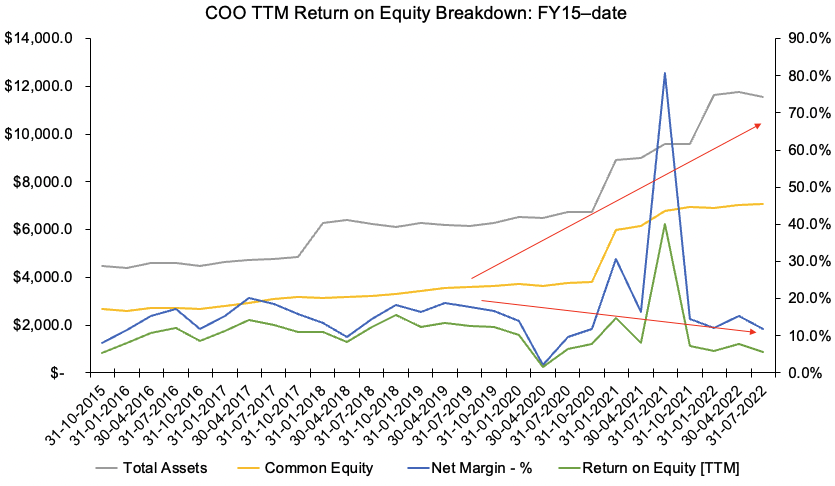
Further examination of COO’s numbers reveals similar trends. As seen in the chart below, whilst realized TTM FCF yields have crept back up into positive territory (currently 5.4% at the time of writing) this has occurred with a corresponding downtick in TTM return on invested capital (“ROIC”). Both FCF and ROIC are clean measures of corporate value and exhibit a company’s management over its capital budgeting cycle(s). As seen in Exhibit 4, prior to the FY20 period, FCF yield had been narrowing from FY16 on a quarterly basis for COO. At the same time, it was exhibiting a robust 500-1,000bps TTM ROIC during this period. However, amid the pandemic’s liquidity-fueled chaos, both FCF yield and ROIC meaningfully spiked back to new highs. It was unsurprising therefore to see the COO share price reach all-time highs in July/August of FY21, exactly the time its ROIC peaked.
As COO has compressed back to pandemic lows on the chart, so too has the return it generated on its investments. With an increasing cost of capital and discount rate, this is not ideal in the current environment. As seen in Exhibit 5, the run-down in ROIC resulted in an economic loss provided by management, whereby the return on capital failed to outpace the WACC hurdle of 7.22%. Further, the divergence in FCF yield to ROIC as seen in Exhibit 4 places questions on the company’s ability to invest sufficiently and see adequate return above its rising cost of capital looking ahead.
Exhibit 4. Bifurcation of ROIC to FCF since mid-FY21 demonstrates headwinds in capital budgeting cycle looking ahead for COO
- Rising FCF yield with declining ROIC is not an ideal situation and indicates difficulty in the company generating return on its capital intensity.
Data: HB Insights, SEC Filings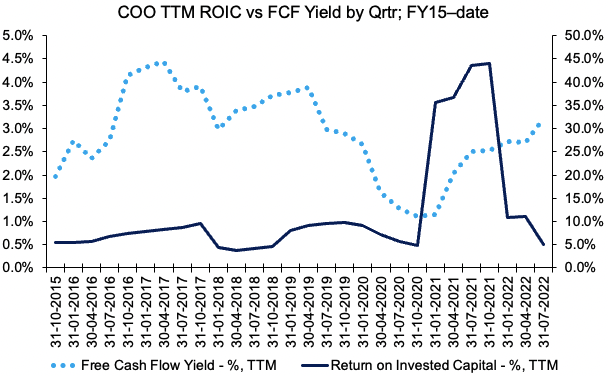
Exhibit 5. Economic value-added dwindled in Q3 FY22 to produce a loss of economic profit (ROIC-WACC)
Data: HB Insights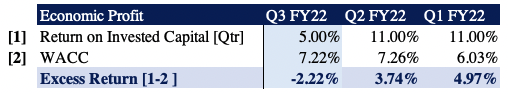
Technical factors equally unsupportive
Given the market’s volatility in FY22, technicals have become equally as important in navigating investment reasoning and decision-making. With COO’s recent price action, I wanted to see what market mechanics were also at play with regards to pricing distribution. As seen in the chart below, COO has been weakening against the S&P 500 healthcare equipment and medical devices index since March this year, whilst equity beta to the index has remained consistently high over this same time. As such, there appears to be a lack of idiosyncratic equity premia available in COO’s case. This aligns with findings in the above sections as well.
Exhibit 6. COO softening in relative strength vs. key indices whilst equity beta is consistently high
Data: Updata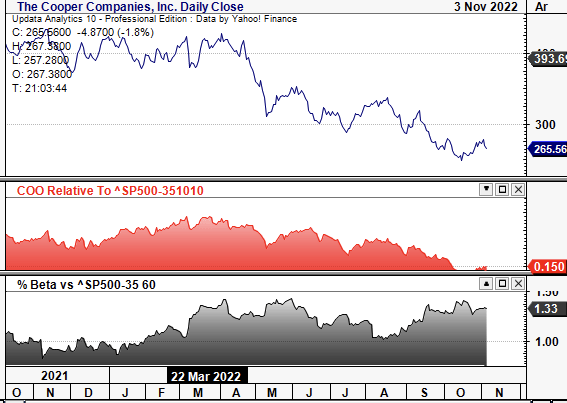
Meanwhile, tracing the fibs down from the FY21 high to the recent bottom indicates the stock has a large recovery ahead to recover from this drawdown. Key levels shown on the retracement, as seen in Exhibit 7, are $249 and $299 at the lower bounds, $330-$355 in the mid-range and $380-$420 at the upper bounds. Therefore, investors should look at price and order distribution at these levels as the COO share price evolves over the next 3-6 months.
At this point, the next key technical level lies at $299 per share, a c.13% upside move from the current share price as seen in the chart below.
Exhibit 7. Key retracement levels from FY21 high(s)
Data: Updata
Valuation and conclusion
Shares trade at 30.5x trailing earnings (GAAP), which is well below the GICS Health care equipment sector’s median trailing P/E of 30.7x. Looking at its financial statements and GAAP earnings are suitable given COO’s relatively low R&D margins, that have a negligible impact if capitalized vs. expensed. The company guides for “low single-digit YoY non-GAAP EPS growth” and there’s no single expectation from consensus on GAAP measures. We estimate COO to print ~$8.90 in EPS in FY22, and this suggests the stock is fairly priced at ~30.5x forward earnings, as seen below. On this level, this sets a price target of $272, ~250bps of upside from the current market value, thus further supporting a neutral view.
Exhibit 8
Data: HB Insights Estimates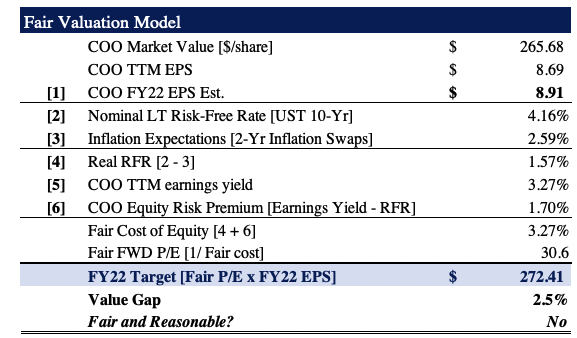
Net-net, COO continues to rate neutral on our books, and at these valuations sitting idle might be warranted. Softening fundamentals (ROIC; ROE) versus longer-term averages, weak price action, and unsupportive valuations each compound the neutral viewpoint in the COO investment debate by my estimation. In that vein, we continue to rate COO a hold, price target of $272.
Be the first to comment