

elijah_sad/iStock via Getty Images
Betting against Apple Inc. (NASDAQ:AAPL) might feel like missing out on a good company, possibly one of the rare companies keeping a portfolio up, but extrapolating past performance is starting to make less sense for a company of this size.
In this analysis, I discuss why the current price premium is about 2 years ahead of the fundamentals, and why the intrinsic value of the company may be $1.8 tn, some 30% lower than the market value.
To be clear, I’m not proposing a short position.
Here is where I see the current value of Apple’s equity:
Our Estimated Intrinsic Value for Apple (Author image with data from FMP)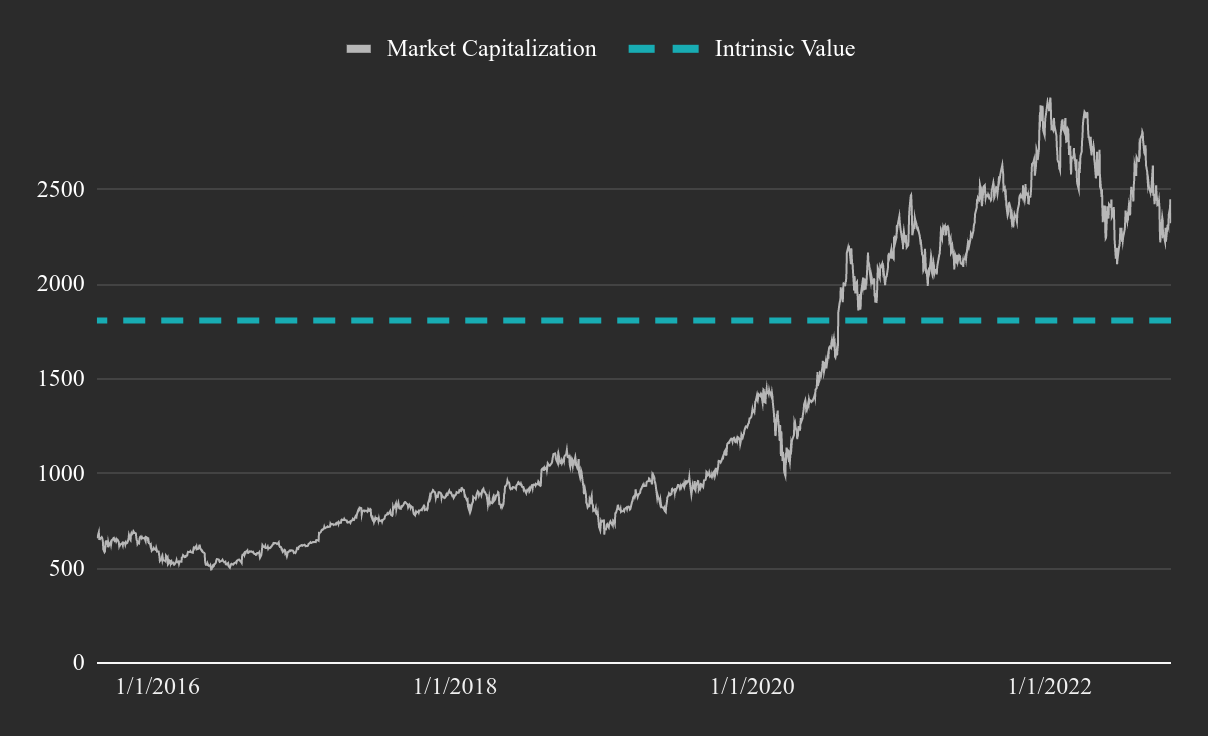
If the predictions of this analysis are close to reality, then Apple can be assigned a 1-year price target of $123.6, implying a 14.5% downside. As the company keeps executing, the intrinsic value will reach current price levels in up to 2 years.
Now let’s consider the fundamentals and assumptions on which I base this valuation.
Remaining Verticals
The major verticals for the company are within the software segment, including:
-
Financial services – Apple Pay, buy now pay later, checkout. These services are rivaling companies like Block, Inc. (SQ)
-
Streaming and media – AppleTV, music. Rivaling Spotify Technology (SPOT), and the media industry.
-
App store and mobile games. Enabling a vast ecosystem of developers to produce apps for the iOS, in direct competition to Alphabet’s (GOOG, GOOGL) Android, and Meta Platforms’ (META) social networks.
-
Electric vehicle (EV) software – Apple is collaborating with the auto industry to develop compatible operating systems for their EVs that are set to compete with Tesla (TSLA).
On the device and hardware side, the company is focused on scaling their M2 chips, which can be distributed across devices, and may find additional potential in EV or other industry applications. The quality of the chips is cutting edge by itself and may enable the company to have a sustained high margin position in the market for many years.
In the longer term, Apple may opt for a slow onshoring production strategy in order to reduce international exposure, increase the quality of their devices, and benefit from government incentives.
Not Really Growing
The after-earnings update from Apple posted some great results, and investors are applauding the well executed performance. When we switch to the bigger picture, we can see that the company has less room to expand than before.
Looking at the growth chart, we immediately see the first issue, the company is not catching up with inflation (as measured by core CPI), which is understandable, but this flips the game for growth. This is going to become a high bar for companies to pass, and stocks will suffer.
Apple’s TTM Revenue Growth in the Last 7 Years vs the Core CPI (Author image with data from FMP)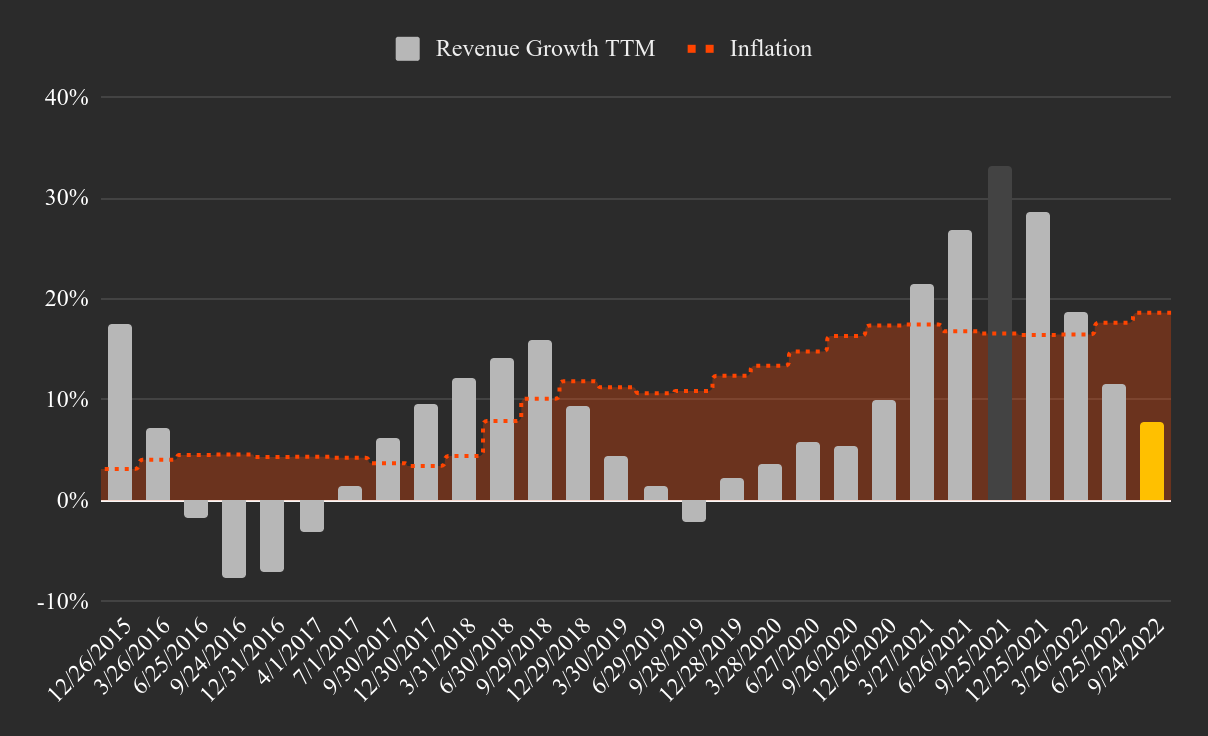
In 2013, Apple made $169.1 bn in revenue, and grew them by 233% to $394.3 bn in the last 12 months (LTM). Even with all the verticals in place, a scenario where they repeat this growth seems unlikely. Given the current landscape and possible verticals, Apple may be in a good position to grow revenue to around $700 bn, roughly 80% in the next 10 years. At this stage of the company, scaling up into new products becomes much more difficult, and Apple is already a well run business, so there may not be too much value to be found from improving it from the inside.
Earnings Outlook
Guidance starts at 25:00 of the earnings call. The company refrained from providing revenue guidance and expects a general deceleration of growth based on a continuing FX impact and an estimated Mac sales decline.
Expected gross margins around 42.75%, opex around $14.8 bn, and an effective tax rate of 16.5%.
The great thing about Apple is that profitability is expected to remain stable and possibly growing. In the chart below, we can see that the company is expecting to keep the elevated gross margins.
Apple’s Non-GAAP Historical Profit Margins on a TTM Basis (Author image with data from FMP)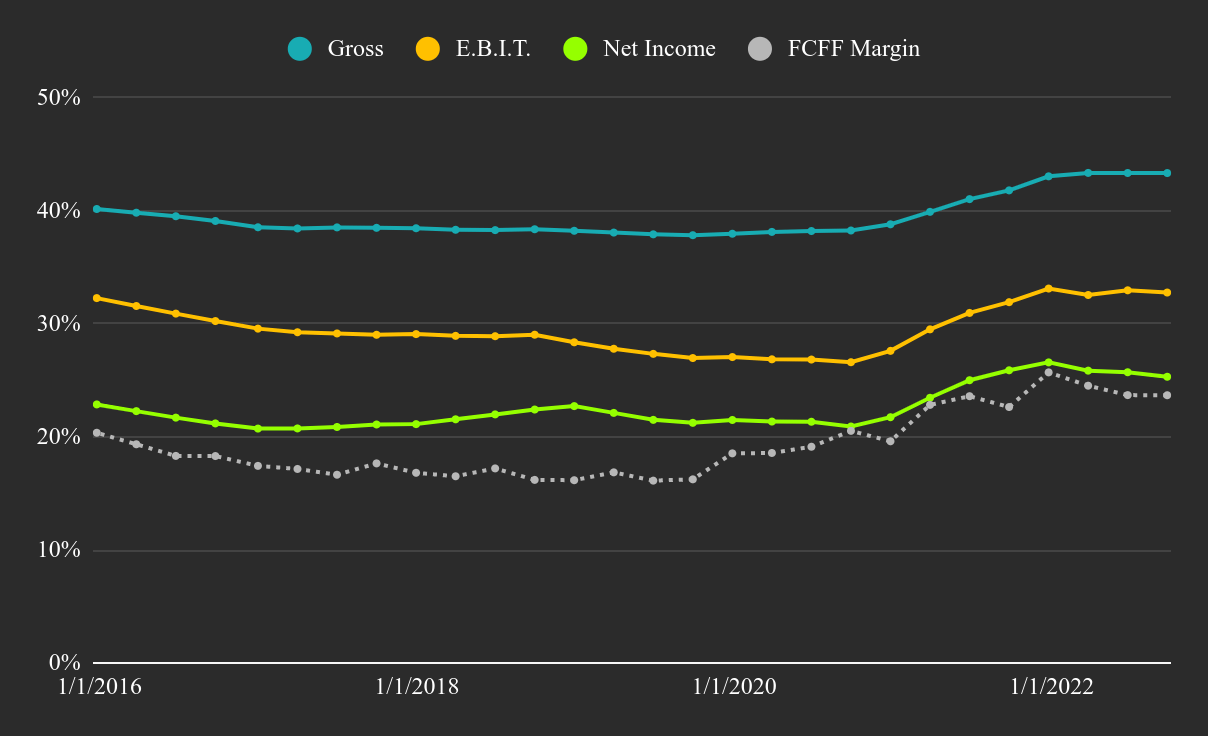
Stable profitability helps with reducing the risk of the stock. However, the increased price of risk and growing interest rates are pressuring the valuation, which is a large part of the reason for the mismatch between the market and intrinsic value of the company.
Given all of the above, I have constructed the following model:
-
Revenue growth 4% in the next 12-months, and 7% in the 4 years after that. This makes revenue.
-
Adjusted EBIT margins (I capitalize R&D) of 35% in year 10, up from the current 32.8%.
-
Efficient tax rate to reach the statutory rate.
-
Starting discount rate of 10.7%, but reduced to 8% in year 10 reflecting Apple’s business stability.
-
Returns of capital 2% higher than the cost of capital at maturity, reflecting lasting competitive advantages of the firm.
The chart below shows the expected performance for Apple, feel free to tweak the model yourself from the link above.
Our Future Estimates Model for Apple (Author image with data from FMP)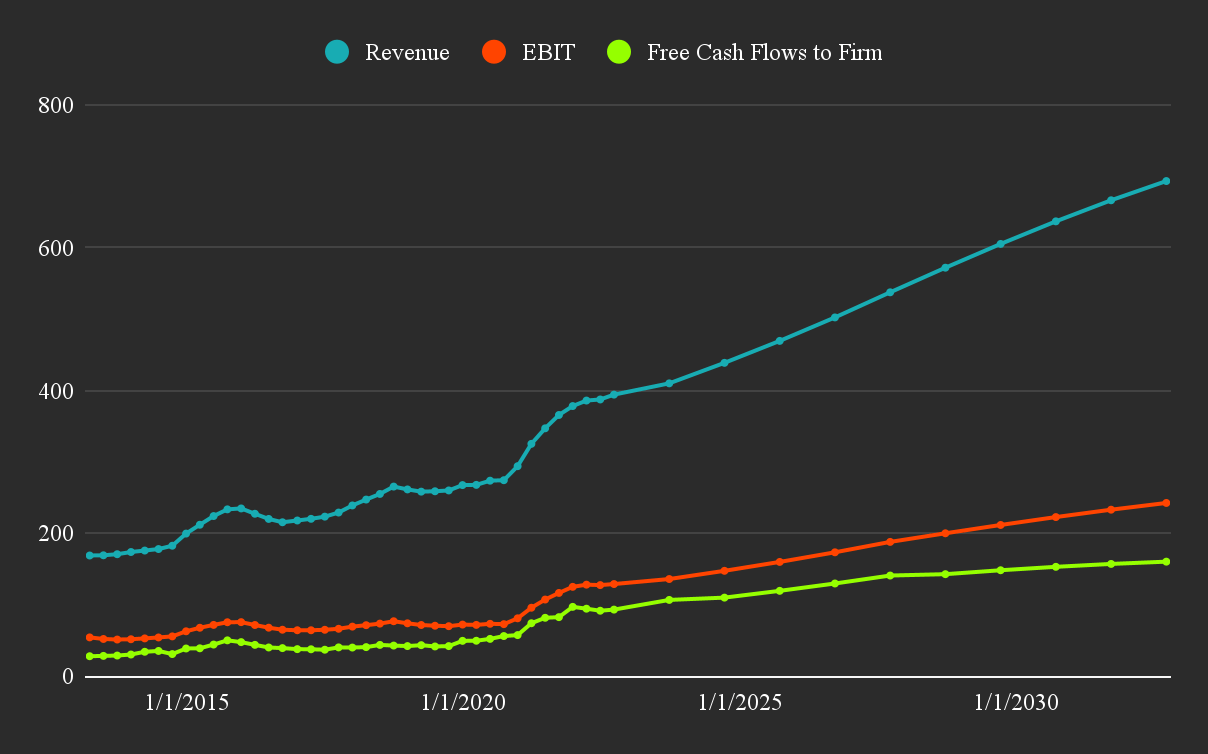
In order to see if this makes sense, we will also take a look at the changes in Apple’s pricing over the years.
Peers and Pricing
Here’s the rub. Pricing multiples have been expanding since 2019, and remain higher than historical levels. However, 2 things have changed which make this pricing inconsistent.
First, the price of risk has changed post 2021, and many companies are feeling the pain.
Second, a higher pricing implies high expected growth across the income statement. Further, it means that the future growth for Apple should be even higher than the historical 5-year revenue CAGR of 11.5%. This may be inconsistent with the available growth verticals for the company, unless Apple moves horizontally and leads a whole new industry such as EVs or financial services – and I mean lead, not participate.
Apple’s Historical Pricing Multiples (Author image with data from FMP)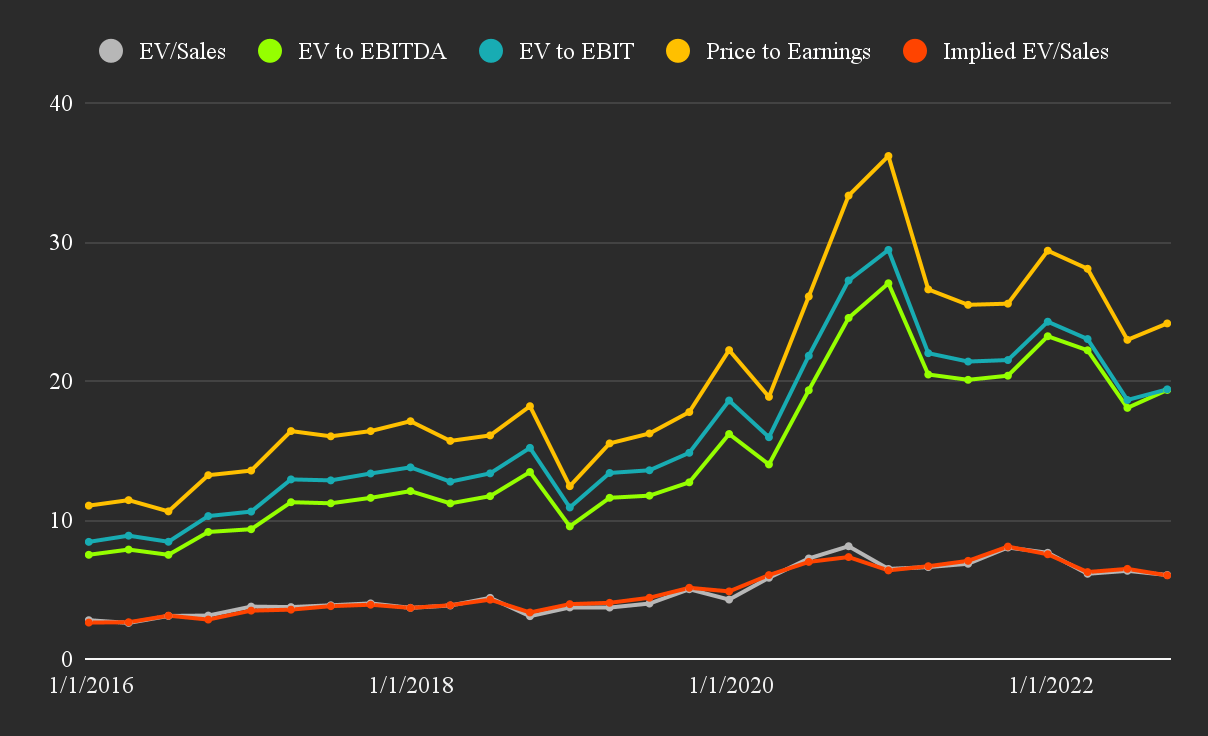
Finally, looking at the peer line-up, Apple seems to be in the bottom right quadrant, implying some relative exposure. The EV to EBIT is close to the 21x peer median, however, the company is somewhat off from the fundamental revenue and profit growth of peers.
Keep in mind that the peer and multiple selection is highly subjective for the chart below, so take it with some reserve.
Apple’s Fundamental Peer Lineup (Author image with data from FMP)
Conclusion & Possible Investment Approach
Apple is undoubtedly a great company that will keep producing value. However, it seems that the market is not factoring-in the new price of risk driven by inflation and its possible effects on real future growth and profitability. The company is also maturing, and expecting continued high performance may be inconsistent with the available expansion avenues.
The current $1.8 tn value model of Apple has priced-in revenues of $700 bn and unlevered free cash flows of $160 bn in 10 years. Investors that believe that the company can outperform this model will find it reasonable to stick to this company. However, simply reaching this performance is not enough to justify the current $2.3 tn market value for Apple, which is why the stock seems to be trading at a premium of 2 years, and investors may want to consider taking advantage of the high pricing.
Investors may also want to ask themselves, at which target value they will be satisfied with their investment in Apple? Given the current environment, some investors may choose to reap their gains in Apple and look for new opportunities.
Be the first to comment