aluxum/E+ via Getty Images
By Maya Beyhan
The widespread global adoption of ESG and climate indices has created an accompanying need for better understanding regarding the performance impact of the various choices made in their design. As introduced in S&P DJI’s new Climate & ESG Index Dashboard, a Brinson-like “carbon attribution” teases out one particularly important source of returns.
Untangling the exact impact of individual goals on ESG and climate index returns can be a challenge, as sophisticated indices can incorporate a range of objectives. For example, the S&P PACTTM Indices (S&P Paris-Aligned & Climate Indices) includes explicit carbon-reduction targets, temperature alignment goals and climate objectives such as mitigation and adaption, while an optimization process is used to target these multiple objectives simultaneously.1 This can make the individual contributions hard to unpack.2
Conveniently, the impact of weighting to higher- or lower-carbon-emitting stocks may be assessed analogously to the way sector or country effects are measured by a Brinson attribution.3 To do so, first, we rank each benchmark security according to their weighted average carbon intensity (WACI),4 and then slice up the underlying benchmark universe into five quintile portfolios, from highest to lowest, each with an equal number of benchmark constituents. Then, for any index based on the same benchmark universe, we can simply apply the standard Brinson methodology (using the performance of our hypothetical carbon portfolios instead of the traditional sector or country portfolios) to measure the allocation effects of over- or underweighting each carbon quintile.
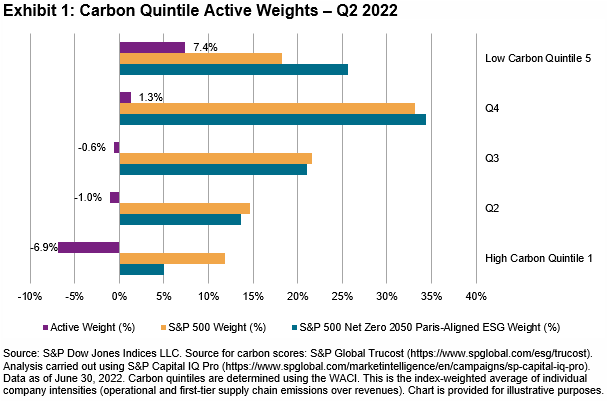
The S&P 500®-based S&P 500 Net Zero 2050 Paris-Aligned ESG Index offers a case study. Exhibit 1 shows the weights of the index and its underlying benchmark, as well as the active weight of the index, in each S&P 500 carbon quintile as of June 30, 2022.

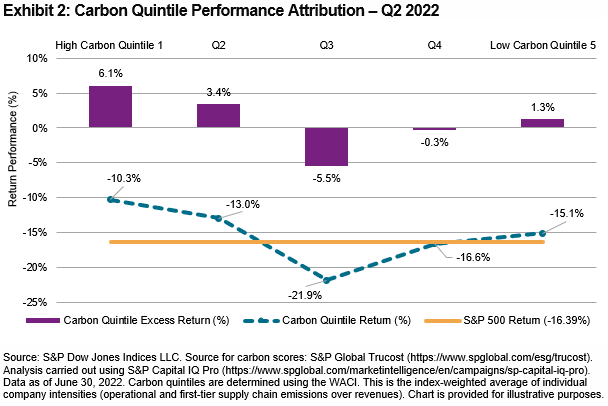
The results of the subsequent return attribution by carbon quintile portfolio—as measured over the prior three months—are shown in Exhibit 2.

Together, Exhibits 1 and 2 measure the extent and impact of carbon-based weights over the period: the High Carbon Quintile 1 outperformed the S&P 500 by 6.1% (see Exhibit 2), and the S&P 500 Net Zero 2050 Paris Aligned ESG Index underweighted this carbon quintile by -6.9% (see Exhibit 1), which detracted from the relative index performance. Conversely, the overweight in the Low Carbon Quintile 5 contributed positively to the relative index performance.
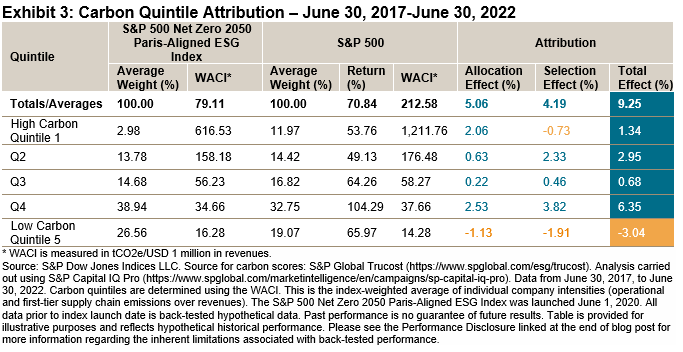
Repeating and cumulating such analysis over multiple periods offers a longer-term perspective, as shown in Exhibit 3 for the five-year period ending in June 2022. Over this longer-term period, an underweight in the High Carbon Quintile 1, and an overweight in the second-least carbon intensive quintile, contributed the most to the index’s overall outperformance.

By quantifying the links between index design choices and index performance, a carbon-based attribution analysis such as that in Exhibit 3 can offer insight and perspective that may prove useful in assessing the merits of one index over another. Investors seeking similar attributions for a range of our flagship indices are now able to find them in S&P DJI’s newly launched Climate & ESG Index Dashboard.
1 For more details, see the full index methodology, available at www.spglobal.com/spdji/en/documents/methodologies/methodology-sp-paris-aligned-climate-transition-pact-indices.pdf
2 www.ssga.com/content/dam/ssmp/library-content/pdfs/insights/reducing-carbon-in-equity-portfolios.pdf
3 Measuring non-US. equity portfolio performance; Determinants of Portfolio Performance on JSTOR
Disclosure: Copyright © 2022 S&P Dow Jones Indices LLC, a division of S&P Global. All rights reserved. This material is reproduced with the prior written consent of S&P DJI. For more information on S&P DJI please visit www.spdji.com. For full terms of use and disclosures please visit Terms of Use.
Editor’s Note: The summary bullets for this article were chosen by Seeking Alpha editors.


Be the first to comment