


Pgiam/iStock via Getty Images
Data from Commodity Futures Trading Commission “Commitment of Traders” is one of the eight sentiment indicators that goes into making up our Master Sentiment Index (see this MSI). It’s there because it has a wonderful track record of signaling bear market lows and on October 11th it did just that. Let’s take a look at recent data.
Commitments of Traders Data
The CFTC (Commodity Futures Trading Commission) just released the latest COT data. Every week the agency tabulates trading positions of five different classes of futures traders. The five trader classes are: dealers, asset managers, leveraged traders, reportable and nonreportable traders. They report the number of contracts that are long, short or spreads in each class.
This data goes back over 70 years and it has been very useful at forecasting market directions. Measuring what percent each class is short the market provides insight into their market expectations.
Asset Managers and the S&P E-Mini Futures
COT data on the CME E-mini S&P futures became available in 2006. In this market professional “asset managers,” account for 40% to 45% of all positions. History has demonstrated that as a group, they almost always have high short positions at the bottom of the stock market. This makes them a wonderful contrary opinion indicator.
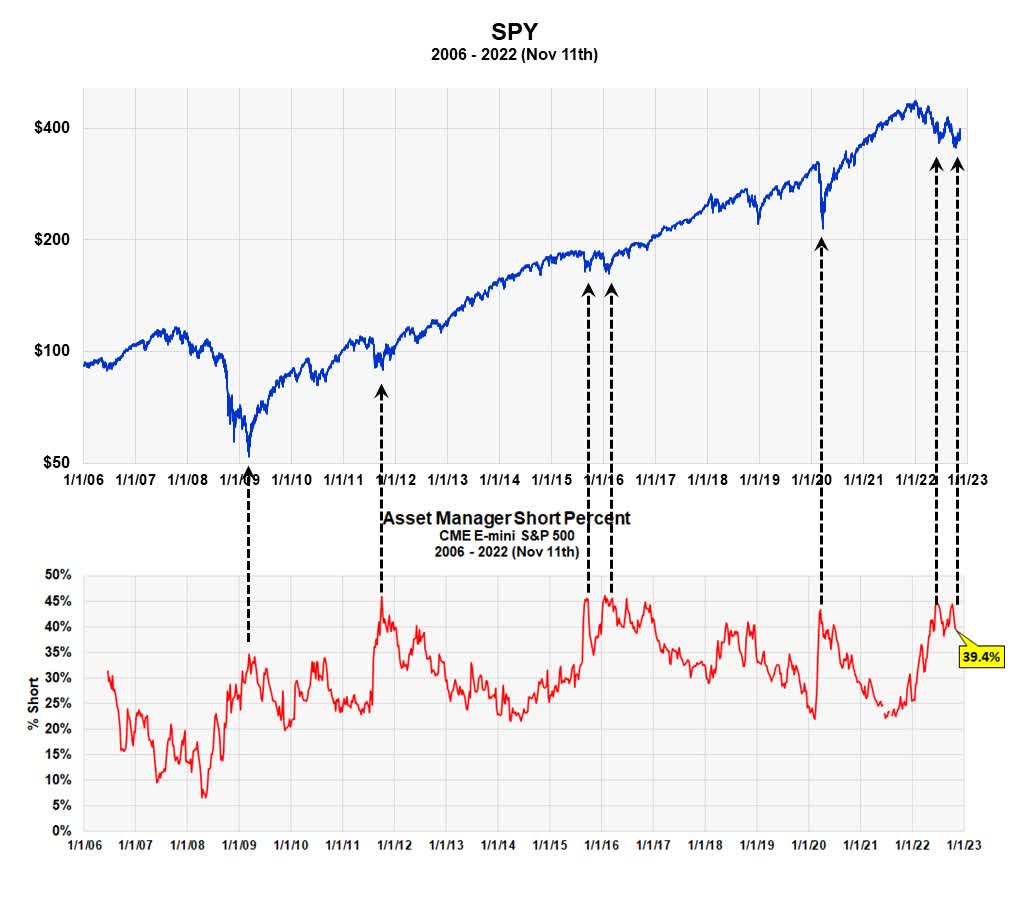
Short Position of E-mini Asset Managers (Michael McDonald)
This chart graphs the percentage short position of asset managers against the Spider ETF from 2006 to present. Major bottoms almost always occur when short selling reaches 40 to 45% of total positions. The last two dotted arrowed lines on the right point to the most recent short selling peaks.
Dealer Positions
Dealers, which are the equivalent of “producers” in the agricultural futures, is the only class of S&P traders who are usually “right” in their positions. In other words, they usually have heavy short positions at market tops and fewer shorts at market lows, just the opposite of the asset managers.
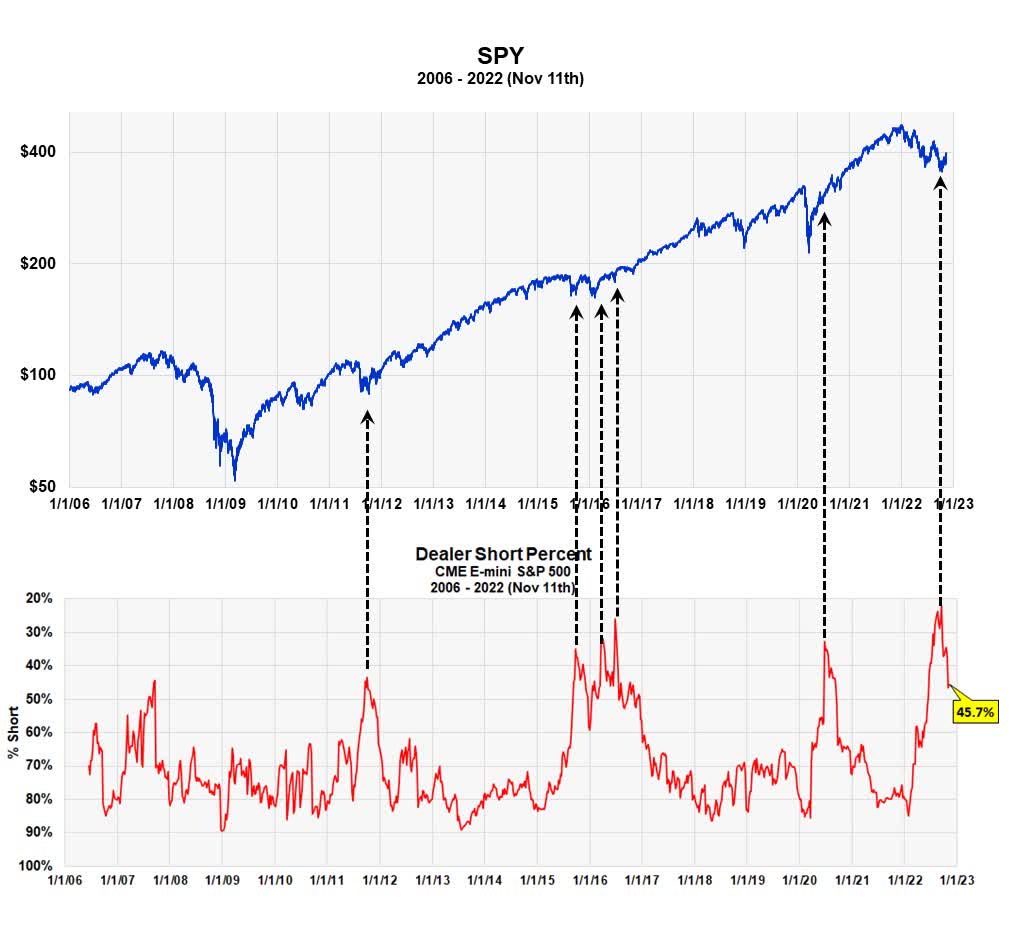
Dealer Short Position vs the SPY (Michael McDonald)
This chart shows the dealer short position as a percent of total long and short positions. The scale is inverted so low short positions are at the top of the chart and high short positions at the bottom. Usually, Dealer short positions hover around 70 or 80% but at market lows it drops down to 30% or 40%. The correlation here is similar to that of the asset manager but in a positive way. The lowest short position was on September 13th, which was right near the market low.
Takeaway
These two COT datasets have a long history of successfully signaling bear market lows. There is nothing to indicate this no longer applies. It confirms what almost every other sentiment indicator has been signaling for some time: that we are at or near bear market lows.
Be the first to comment