

Kativ
Bear markets are exciting, terrifying, and frustrating. Why? Because unlike the Pandemic, the most freakish bear market in history, stocks almost never go straight down, and then straight back up.
Daily Shot Daily Shot 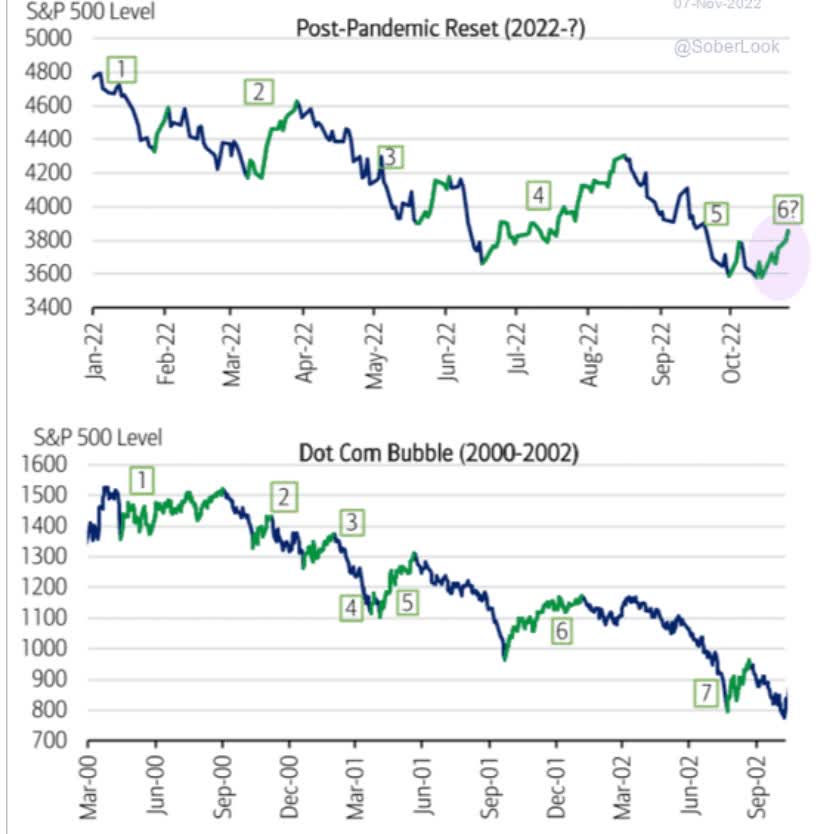
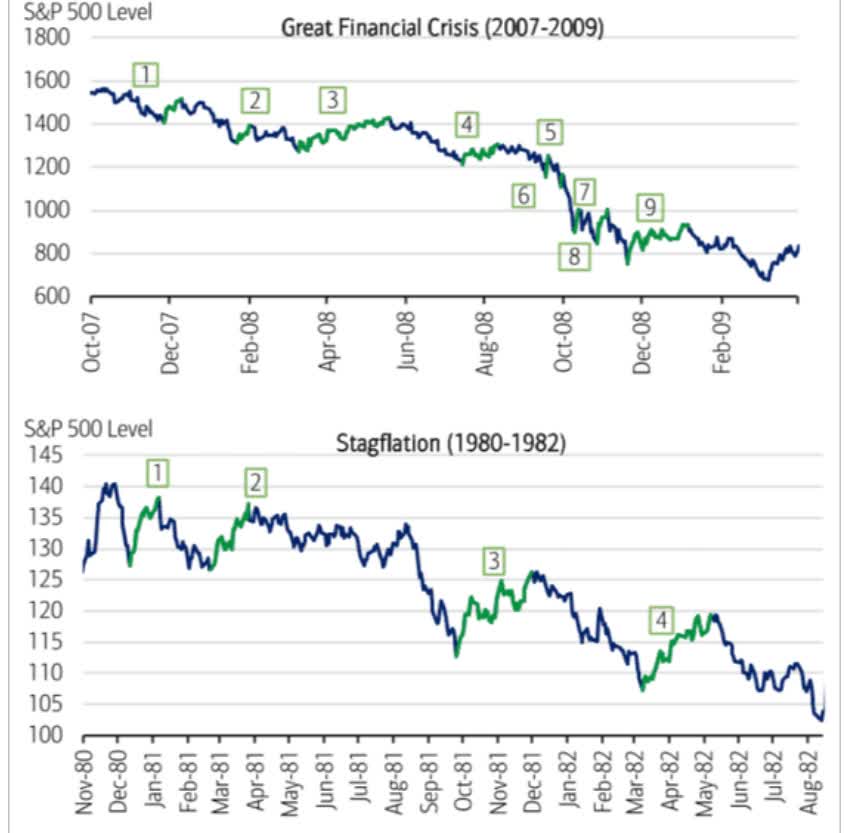
Bear market rallies are the norm, and they can last for weeks and be as large as 26%.
You can always find experienced analysts who can tell you all the reasons why the market might or might have have already bottomed.
- Ed Yardeni and JPMorgan think the bottom is in
- Morgan Stanley, Bank of America, and UBS think we have 11% to 23% further to fall.
In the short term, the stock market is a crap shoot, but in the long term, returns are fundamentals driven by destiny.
Which is why I absolutely love bear markets, which offer incredible opportunities to buy the world’s best companies when the market is selling first, and asking questions later.
Let me show you why Comcast Corporation (NASDAQ:CMCSA) is one of my favorite high-yield A-rated blue-chip recommendations right now.
And also why Legal & General Group Plc (OTCPK:LGGNY) and Manulife Financial Corporation (MFC) are two alternative A-rated high-yield blue chips for those who either aren’t comfortable with Comcast, or simply want a few more high-yield bear market blue-chip bargain ideas to consider.
Why It’s The Best Time Ever To Buy Comcast
(Source: FAST Graphs, FactSet)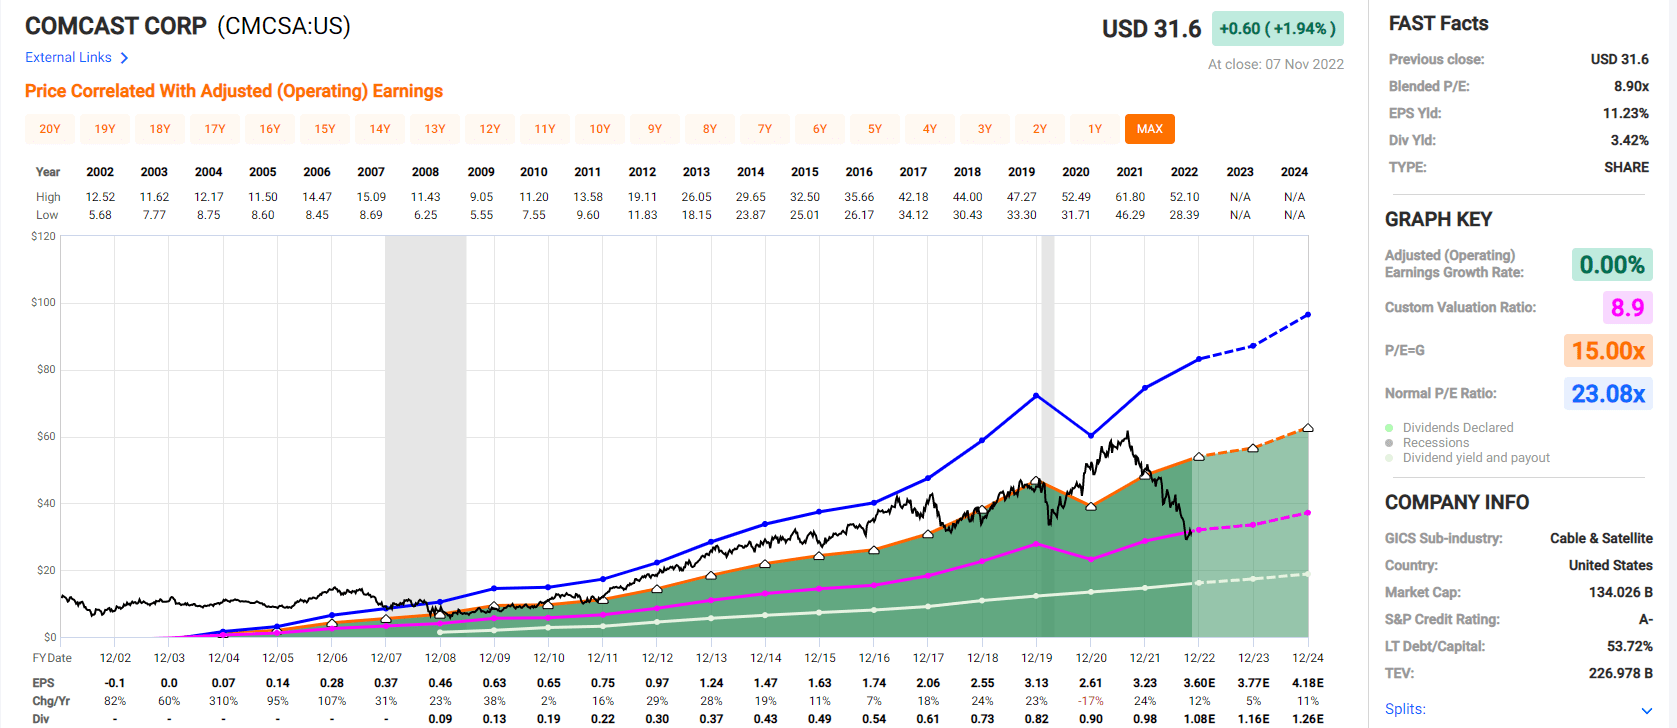
Comcast is trading at a blended trailing P/E of 8.9X, the lowest in its history.
It’s forward P/E is 8.4X and its cash-adjusted P/E is 6.4X, a bargain by even private equity standards.
How cheap is Comcast right now? Consider this. Pre-pandemic bubble, the average private equity deal was for 12X cash-adjusted earnings, and Comcast is trading at half that valuation.
In the first 10 seasons of Shark Tank, the average cash-adjusted P/E multiple for a deal was 7X, and Comcast is trading at a lower P/E today.
What kind of returns can Comcast deliver when trading at bear market lows? In this case the lowest P/E in its history?
Comcast Rolling Returns Since 1988
Portfolio Visualizer Premium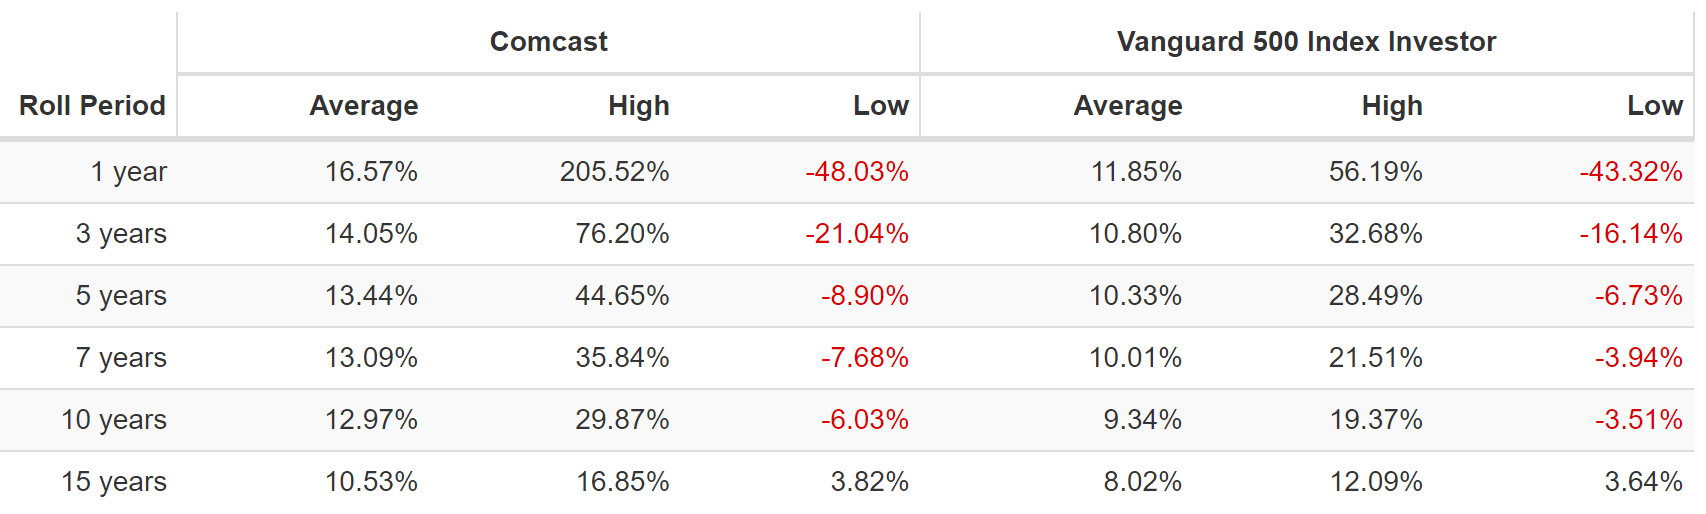
Comcast’s average 12-month rolling return since 1988 is a market- and Nasdaq-thumping 17% annually.
And across every time period, its average rolling return has beaten the market, by a significant amount.
But from bear market lows Comcast is capable of as much as:
- 206% in one year = 3X
- 76% CAGR for 3 years = 5.5X
- 45% CAGR for 5 years = 6.5X
- 36% CAGR for 7 years = 8.6X
- 30% for 10 years = 13.8X
- 17% CAGR for 15 years = 10.5X.
Buffett-like return potential from an A-rated Super SWAN (sleep well at night) quality blue-chip anti-bubble bargain hiding in plain sight.
OK, that’s all very compelling, but surely Wall Street must have a good reason to hate Comcast so much right?
Ycharts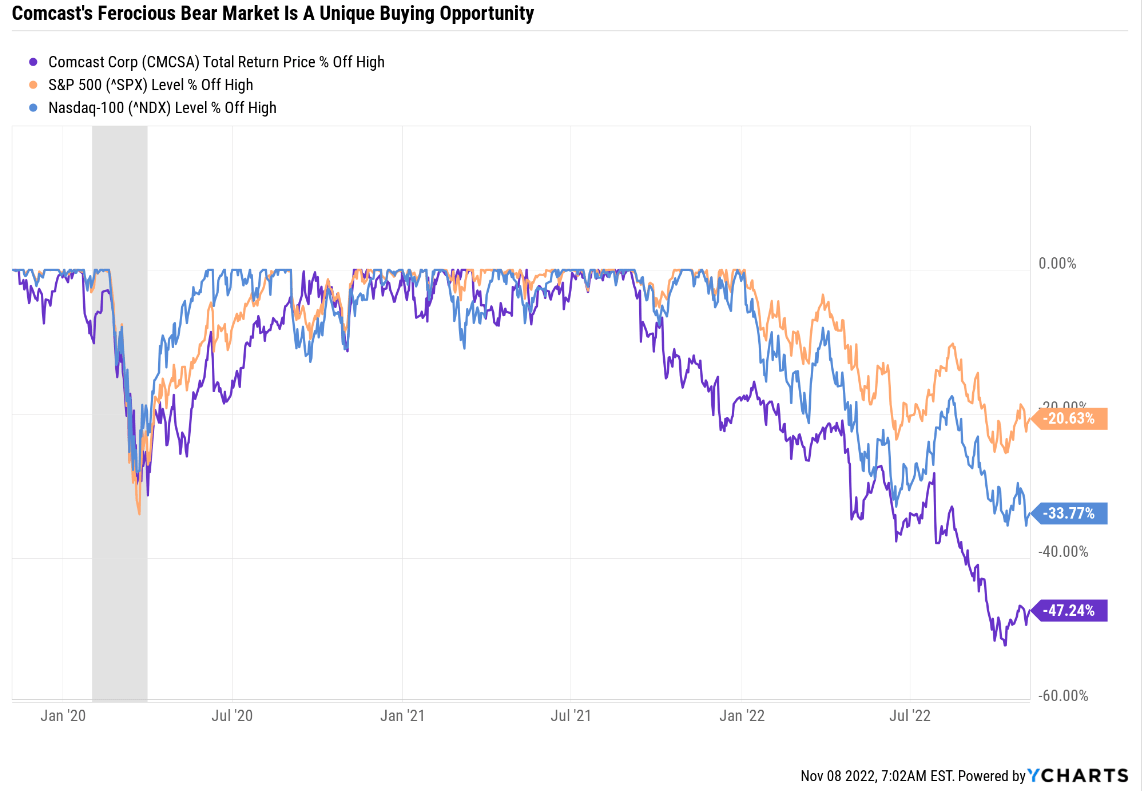
After all, Comcast has been cut in half and no company, no matter its quality, can get cut in half without the market pricing in some kind of risk right?
That’s very true, so let’s take a look at why Wall Street hates Comcast so much right now, and why it’s wrong.
Why Wall Street Hates Comcast Right Now…
Comcast is famous for poor customer service, which isn’t entirely fair.
Customer Service Scoreboard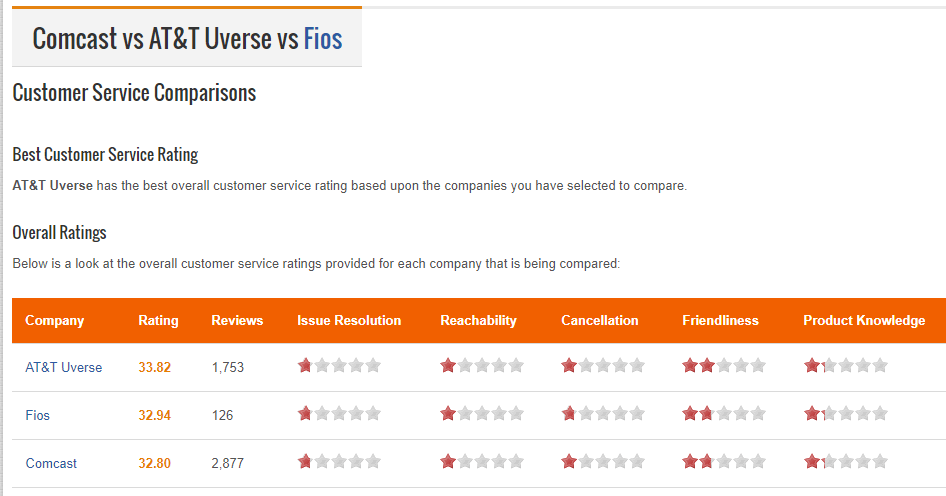
Broadband in general has poor customer service ratings (out of 200) including its main rivals AT&T (T) and Verizon (VZ).
Comcast customer service is ranked #460 out of the 1005 companies that have a CustomerServiceScoreboard.com rating” – Customer Service Scoreboard
In fact, out of over 1,000 rated companies, based on customer reviews, Customer Service Scoreboard considers CMCSA in the 54% percentile, about average.
Now it’s true that it’s better if a company is beloved by its customers, such as Amazon (AMZN) is:
- Amazon: 80th best company = 92nd percentile
- Apple (AAPL): 181st best company = 82nd percentile.
However, you’d be surprised at how some of the world’s best companies score in terms of customer service ratings.
- Microsoft (MSFT): 479th best company = 52nd percentile (lower than Comcast)
- Google (GOOG): 853rd best company = 8th percentile.
The only thing that matters is whether Comcast’s customer service is good enough to allow it to maintain or grow its free cash flow, which supports the rapidly growing dividend.
Comcast has struggled with subscriber growth in recent years, due to cord cutting (for cable) and a mature broadband market.
It added 14,000 broadband subscribers in Q3, which is historically a strong quarter, and management expects a slightly negative quarter in Q4.
However, that doesn’t mean it’s not able to still grow.
- average revenue per user for Broadband +3.7% YOY
- business broadband ARPU +9.4% YOY.
In TV, Comcast reported 16% YOY revenue growth if you exclude the Olympics.
Peacock, Comcast’s streaming service, continues to lose money, but it did add 2 million subscribers.
FactSet Research Terminal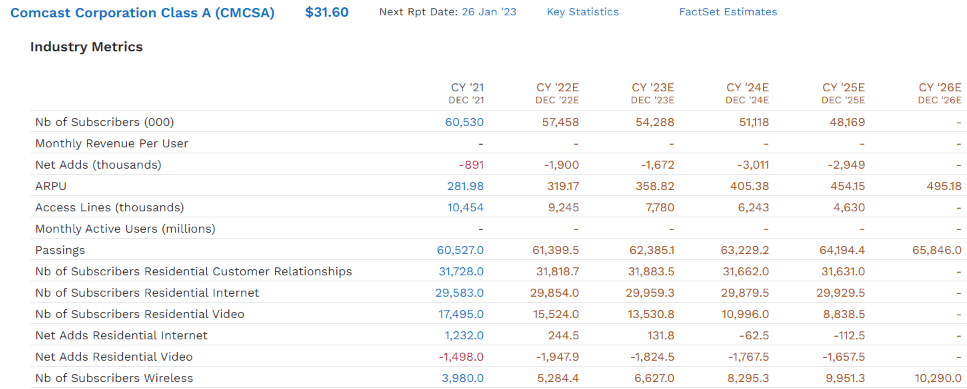
Comcast is expected to lose subscribers, a lot of them, in the coming years. In fact, it’s expected to lose between 1.7 million and 3 million per year through 2025.
Wireless Home Internet, which is expected to double subscribers by 2026, to 10.3 million just can’t offset the decline in cable and broadband.
OK, so that must be it right? Comcast has been cut in half because it’s a dying business with one foot in the grave! Not so fast.
… And Why You Shouldn’t
FactSet Research Terminal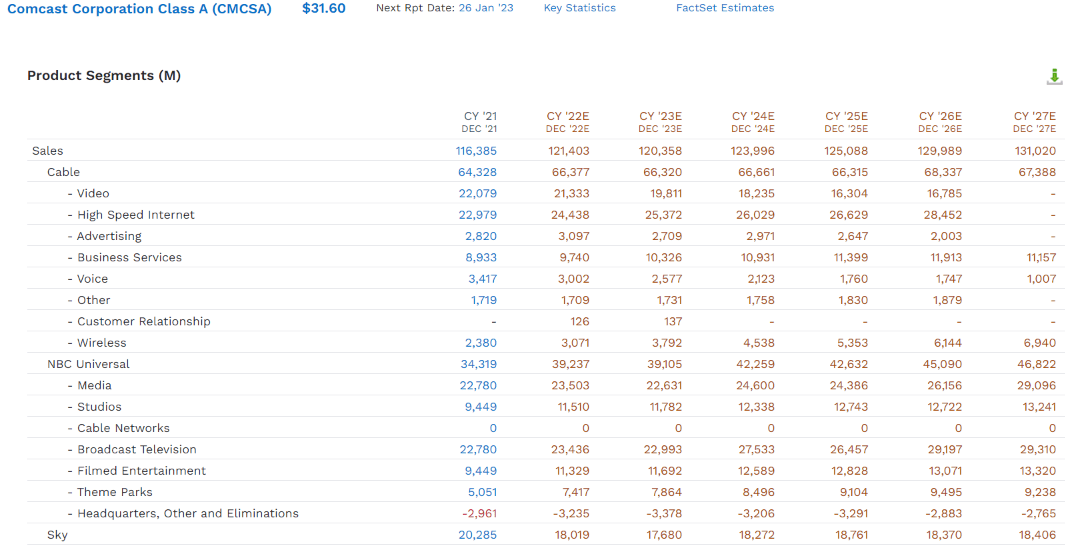
Comcast is still growing its revenue (outside of the anticipated 2023 recession, when sales growth is expected to be zero).
It’s not fast growth, but between 2022 and 2027, analysts expect Comcast’s annual sales to rise by $10 billion or 1.6% annually.
Across almost every part of the business, cable, broadband, NBC, and Sky, sales are expected to grow modestly.
The only parts of the business that might be correctly described as “dying” are advertising and voice.
How is that possible? It’s the same strategy that tobacco companies have used for decades in the face of declining volumes, price hikes.
FactSet Research Terminal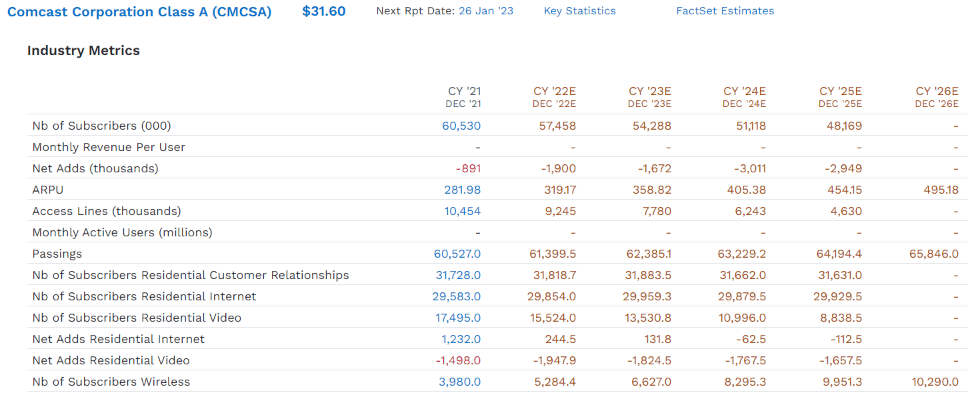
Analysts expect Comcast’s average revenue per user to rise from $282 per year in 2021 to a very impressive $495 in 2026.
And what else can a company do if volumes or subscribers are declining? Control costs.
FactSet Research Terminal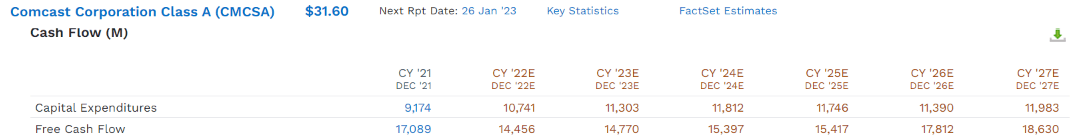
Comcast is a wide moat business with historical profitability in the 90th percentile of its industry.
Ycharts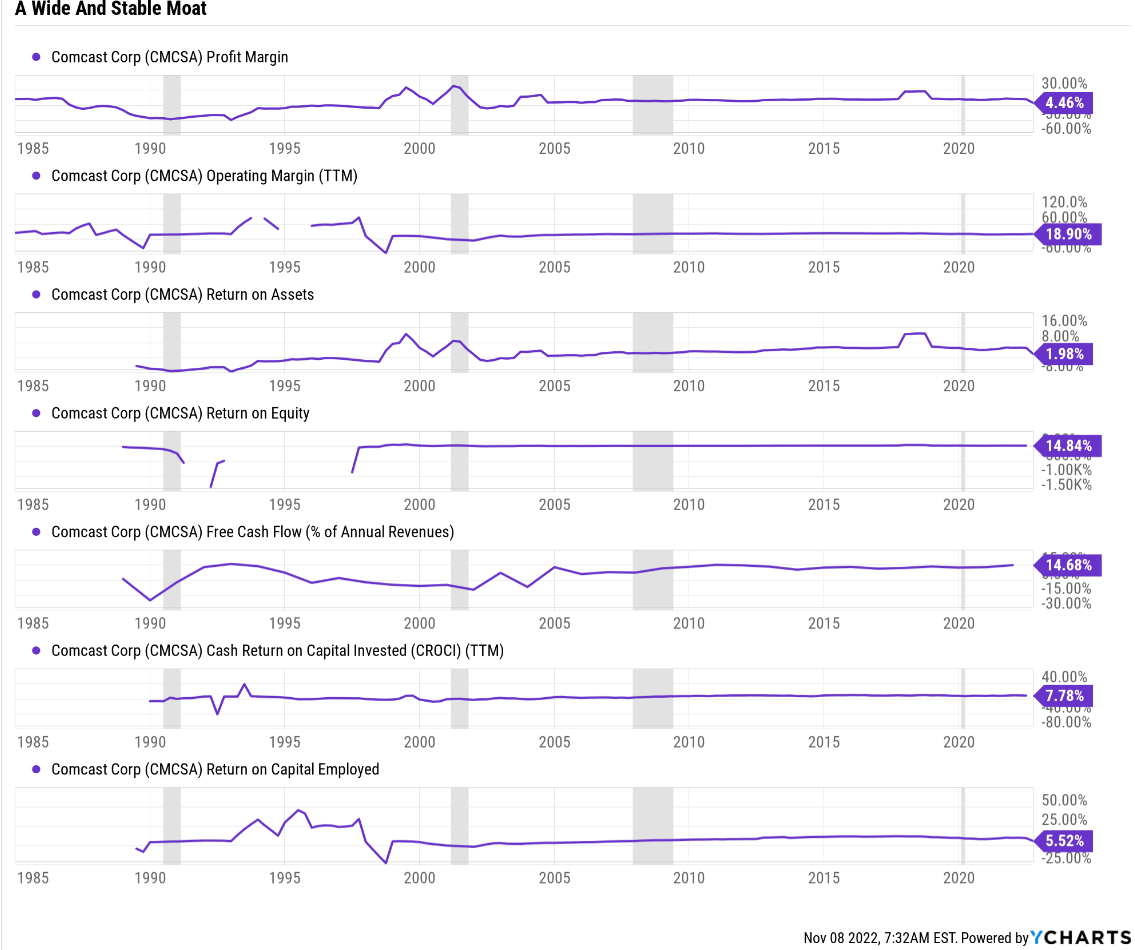
That industry-leading profitability has been relatively stable for 30 years, including free cash flow margins of 15%.
What makes this is a wide moat business is that it’s capital intensive. Competing with Comcast requires massive capex, but Comcast is a mature business and is able to maintain its moat with just $11 to $12 billion in annual growth spending.
That means any revenue growth drops to the bottom line, becoming free cash flow which is expected to grow from $14.5 billion this year to $18.6 billion this year.
That’s 5% annual growth in free cash flow, what ultimately gives any company its intrinsic value.
Wait a second? How can I be so excited about a company that’s growing FCF by just 5% per year? Because intrinsic value isn’t a function of free cash flow alone, but free cash flow PER SHARE.
And that’s the final piece of the Comcast puzzle, whose growth thesis is a function of three factors:
- growing ARPU (slow but steady top line growth)
- cost discipline, margin expansion, and FCF growing faster than the top line
- buybacks to grow EPS, FCF/share and dividends.
Comcast Dividend And Payout Ratio Consensus Forecast
| Year | Dividend Consensus | FCF/Share Consensus | FCF Payout Ratio | Retained (Post-Dividend) Free Cash Flow | Buyback Potential | Debt Repayment Potential |
| 2022 | $1.08 | $3.21 | 33.6% | $9,208 | 6.74% | 9.7% |
| 2023 | $1.16 | $3.52 | 33.0% | $10,202 | 7.47% | 11.0% |
| 2024 | $1.26 | $4.10 | 30.7% | $12,277 | 8.99% | 13.2% |
| 2025 | $1.35 | $4.69 | 28.8% | $14,439 | 10.57% | 15.1% |
| 2026 | $1.43 | $5.62 | 25.4% | $18,113 | 13.26% | 18.1% |
| 2027 | $1.61 | $7.57 | 21.3% | $25,765 | 18.86% | 24.8% |
| Total 2022 Through 2027 | $6.28 | $21.14 | 29.7% | $90,004.86 | 65.88% | 96.63% |
| Annualized Rate | 8.3% | 18.7% | -8.8% | 22.8% | 22.8% | 20.7% |
(Source: FactSet Research Terminal)
Thanks to massive buybacks Comcast is expected to grow its FCF/share by almost 20% annually over the coming five years.
That’s despite a healthy 8.3% CAGR dividend growth rate, resulting in the very safe 34% FCF payout ratio falling to just 21% by 2027.
It means Comcast is expected to retain $90 billion in post-dividend free cash flow which is enough to pay off all of its debt, or buyback stock by the boat load.
- at the lowest P/E in history at the moment.
How much stock is Comcast expected to buy back?
| Year | Consensus Buybacks ($ Millions) | % Of Shares (At Current Valuations) | Market Cap |
| 2022 | $12,967 | 9.5% | $136,620 |
| 2023 | $11,795 | 8.6% | $136,620 |
| 2024 | $12,883 | 9.4% | $136,620 |
| 2025 | $12,863 | 9.4% | $136,620 |
| 2026 | $14,510 | 10.6% | $136,620 |
| 2027 | $14,000 | 10.2% | $136,620 |
| Total 2023 through 2027 | $66,051 | 48.3% | $136,620 |
| Annualized Rate | 12.3% | Average Annual Buybacks | $11,009 |
| 1% Buyback Tax | $661 | Average Annual Buyback Tax | $110 |
(Source: FactSet Research Terminal)
How about $66 billion over the next five years. At current valuations that’s enough to repurchase half its shares or 12.3% CAGR.
Now obviously Comcast isn’t going to stay at today’s absurdly low price for five years. That would be absolutely insane. Why?
Because look at what it would do to the valuation.
(Source: FactSet Research Terminal)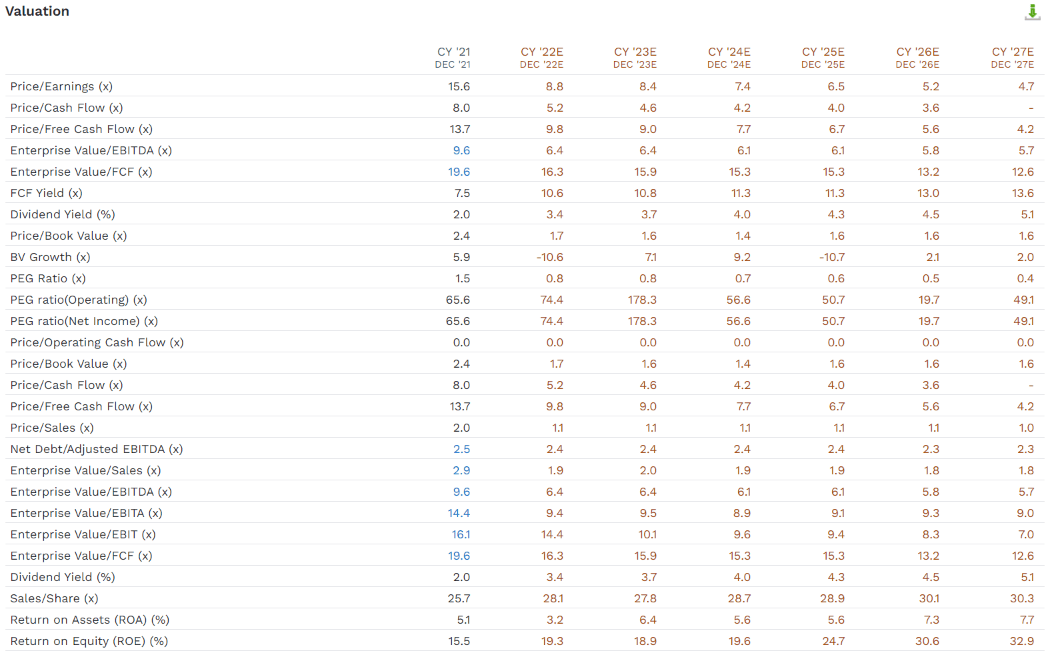
It would mean Comcast’s forward P/E falls from 8.4X today to 4.7X by 2026.
It’s cash-adjusted P/E (EV/EBITDA) would fall from 6.4 today to 5.7X by 2026.
Can I say with 100% certainty that Comcast can’t keep seeing its P/E compress? Of course not. But for today’s 6.4X cash-adjusted P/E to be reasonable, Comcast would have to be growing at -4.2% CAGR.
For a 2026 cash-adjusted EP of 5.7X to make sense, it would have to be growing at -5.6% CAGR.
So, how fast do analysts expect Comcast to actually grow over the medium-term?
- 13.1% CAGR from 2022 through 2027.
What about the long term?
(Source: FactSet Research Terminal)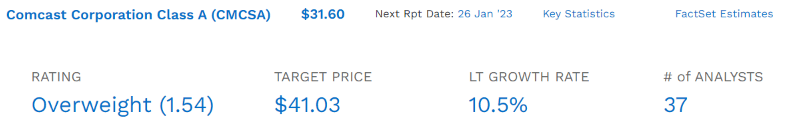
10.5% CAGR, for an A-rated blue-chip that’s pricing in -4.2% CAGR growth.
How’s that for a margin of safety! As long as Comcast grows at least 0% over time, the dividend will always remain very safe and investors literally can’t lose money over the long-term.
- as long as they avoid becoming a forced seller for emotional or financial reasons.
OK, so this is all very exciting, and if analysts are right, Comcast is a table-pounding bargain buy. BUT how often are analysts right about Comcast’s growth?
(Source: FactSet Research Terminal)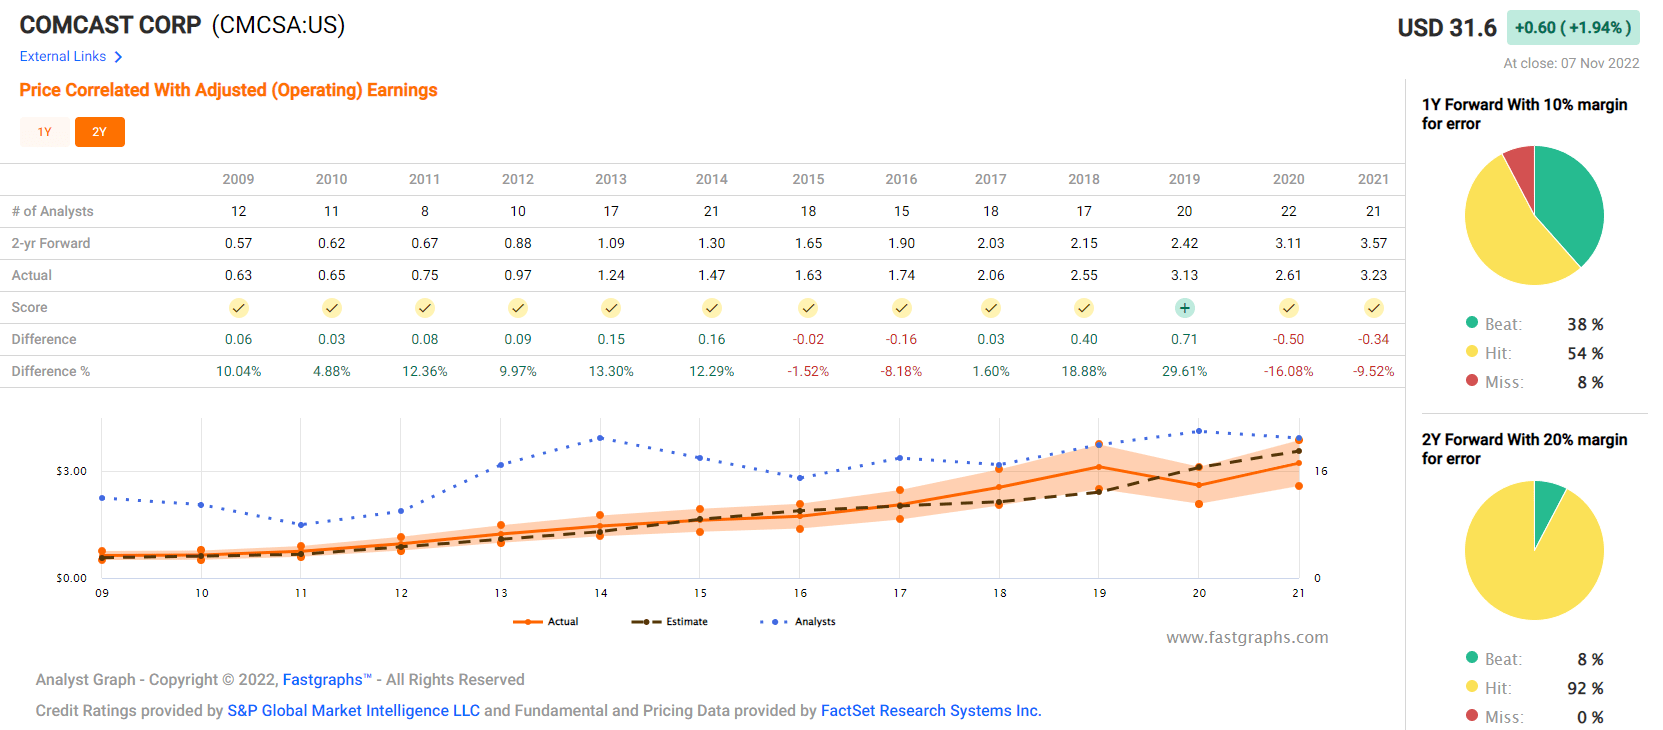
Outside of a reasonable margin of error (about 10% smoothing for outliers), Comcast hasn’t missed earnings expectations for a decade.
It meets or beats analysts estimates, because this is a stable business and management guidance is that good.
OK, so what exactly is Comcast offering long-term investors today?
| Investment Strategy | Yield | LT Consensus Growth | LT Consensus Total Return Potential | Long-Term Risk-Adjusted Expected Return | Long-Term Inflation And Risk-Adjusted Expected Returns | Years To Double Your Inflation & Risk-Adjusted Wealth |
10-Year Inflation And Risk-Adjusted Expected Return |
| Comcast | 3.7% | 10.5% | 14.2% | 9.9% | 7.6% | 9.5 | 2.08 |
| Nasdaq | 0.8% | 11.8% | 12.6% | 8.8% | 6.5% | 11.0 | 1.88 |
| Schwab US Dividend Equity ETF | 3.6% | 8.5% | 12.1% | 8.4% | 6.1% | 11.8 | 1.81 |
| Dividend Aristocrats | 2.6% | 8.5% | 11.1% | 7.8% | 5.4% | 13.2 | 1.70 |
| S&P 500 | 1.8% | 8.5% | 10.3% | 7.2% | 4.9% | 14.8 | 1.61 |
(Source: DK Research Terminal, FactSet, Morningstar, Ycharts)
Comcast at today’s rich yield, is capable of continuing to deliver the same historical market- and Nasdaq-beating returns as it has for 34 years.
What does that potentially mean for you?
Inflation-Adjusted Consensus Return Potential: $1,000 Initial Investment
| Time Frame (Years) | 8.0% CAGR Inflation-Adjusted S&P 500 Consensus | 8.8% Inflation-Adjusted Aristocrat Consensus | 11.9% CAGR Inflation-Adjusted CMCSA Consensus | Difference Between Inflation-Adjusted CMCSA Consensus And S&P Consensus |
| 5 | $1,468.65 | $1,526.66 | $1,752.14 | $283.49 |
| 10 | $2,156.93 | $2,330.70 | $3,069.99 | $913.06 |
| 15 | $3,167.77 | $3,558.19 | $5,379.04 | $2,211.27 |
| 20 | $4,652.33 | $5,432.16 | $9,424.81 | $4,772.48 |
| 25 | $6,832.64 | $8,293.08 | $16,513.57 | $9,680.93 |
| 30 | $10,034.74 | $12,660.73 | $28,934.04 | $18,899.30 |
(Source: DK Research Terminal, FactSet)
It means potentially a nearly 30X inflation-adjusted return over the next 30 years.
| Time Frame (Years) | Ratio Inflation-Adjusted CMCSA Consensus /Aristocrat Consensus | Ratio Inflation-Adjusted CMCSA Consensus vs. S&P consensus |
| 5 | 1.15 | 1.19 |
| 10 | 1.32 | 1.42 |
| 15 | 1.51 | 1.70 |
| 20 | 1.74 | 2.03 |
| 25 | 1.99 | 2.42 |
| 30 | 2.29 | 2.88 |
(Source: DK Research Terminal, FactSet)
That’s more than double what the aristocrats are expected to deliver and 3X the S&P 500’s consensus returns.
But you don’t have to wait for decades to make potentially incredible returns with Comcast.
Here’s what an A-rated blue-chip growing at double digits at the lowest P/E in its history means in the short and medium term.
Comcast 2024 Consensus Total Return Potential
(Source: FAST Graphs, FactSet)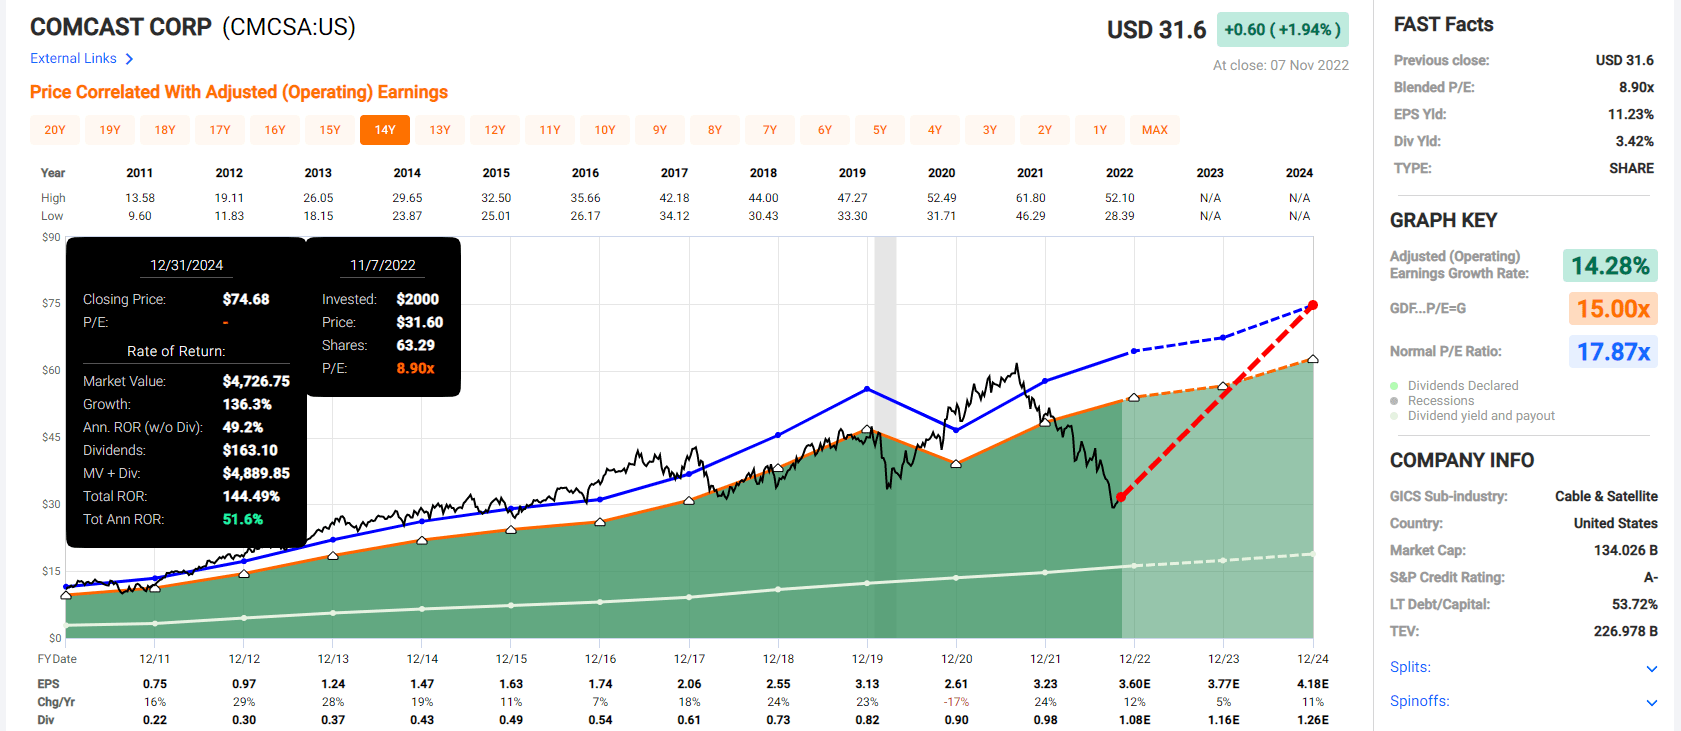
If Comcast grows as expected (it almost always does) and returns to historical market-determined fair value by 2024, then investors could enjoy almost 150% total returns, or 52% annually.
- 5X more than the S&P 500 consensus.
Comcast 2027 Consensus Total Return Potential
(Source: FAST Graphs, FactSet)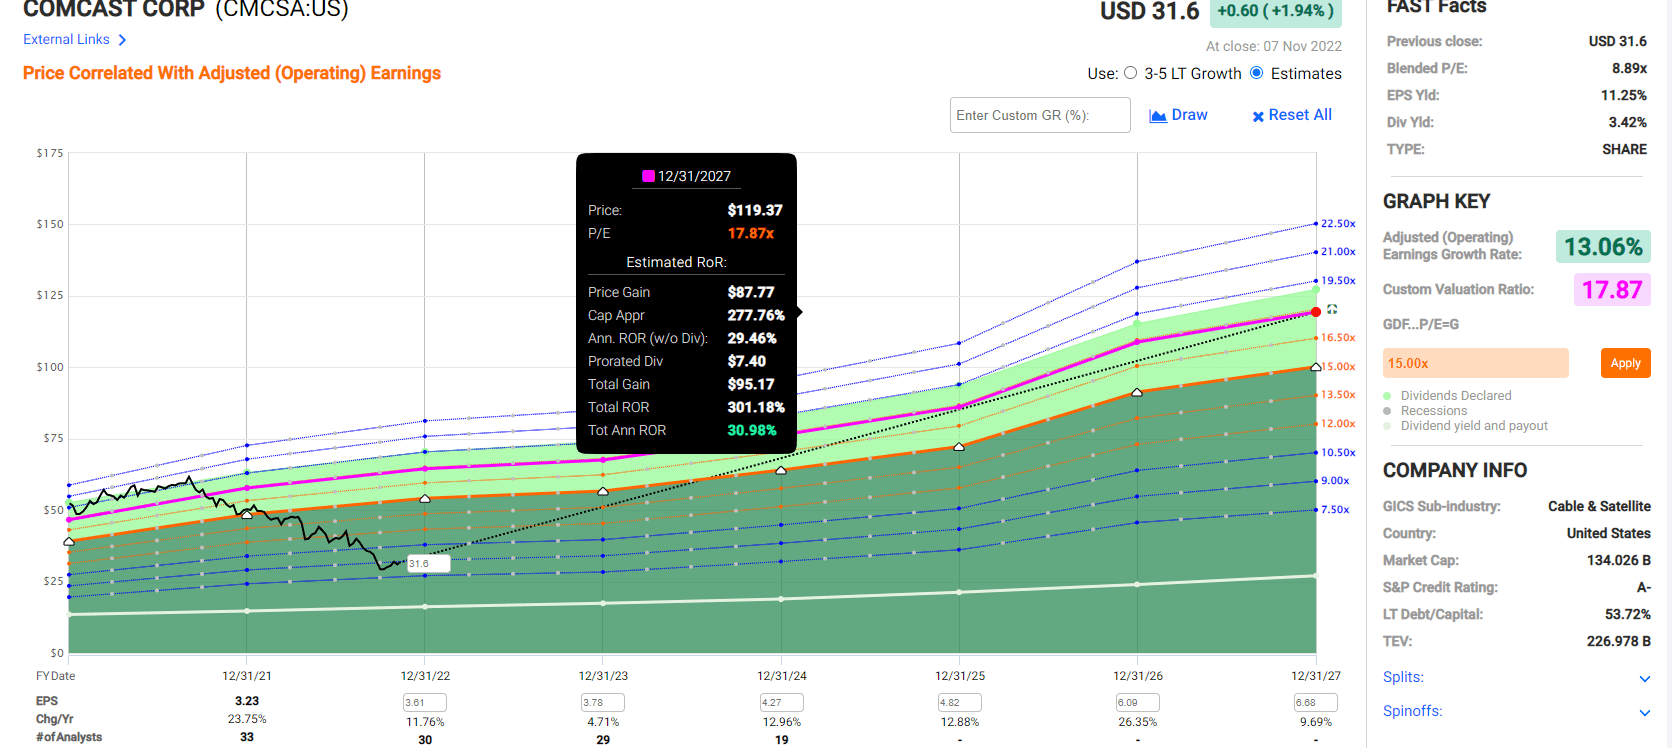
If Comcast grows as expected and returns to market-determined historical fair value by 2027 investors could quadruple their money, enjoying 31% annual returns.
- 5X more than the S&P 500
- Buffett-like return potential consistent with CMCSA bear market low returns.
Comcast Investment Decision Score
DK (Source: Dividend Kings Zen Research Terminal)
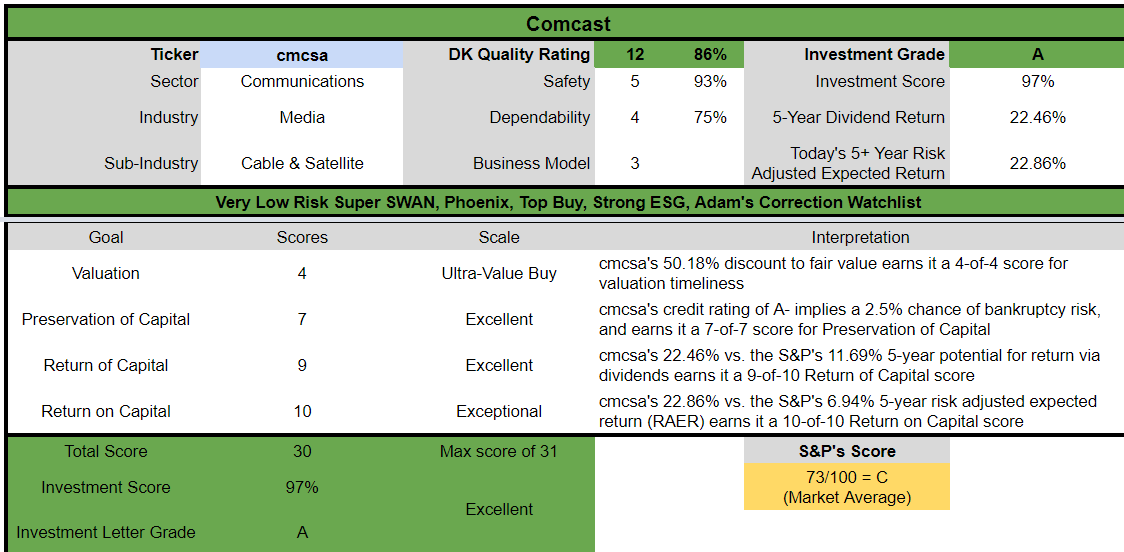
CMCSA is a potentially excellent fast-growing anti-bubble high-yield opportunity for anyone comfortable with its risk profile. Look at how it compares to the S&P 500.
- 50% discount to fair value vs. 3% S&P = 47% better valuation
- 3.4% safe yield vs. 1.8% (2X higher and much safer )
- 40% better long-term annual return potential
- 4X higher risk-adjusted expected returns
- 2X higher consensus dividend income over the next five years.
Ok, so Comcast is an amazing opportunity, but what if you just don’t like the company, for whatever reason. Or what if you just need a lot higher very safe yield than 3.4%?
Then consider Legal and General and Manulife Financial.
Manulife Financial: One Of The Greatest Insurance Companies You’ve Never Heard Of
Further Reading:
- Manulife: A 5.2% Yielding Blue Chip Too Cheap To Ignore
- Manulife: I Keep Putting Capital To Work At A Great Yield
- full investment thesis, growth outlook, and risk profile.
Tax Implications
- MFC is a Canadian company
- 15% dividend withholding EXCEPT in retirement accounts
- own in retirement accounts to avoid the paperwork involved with the tax credit in taxable accounts to recoup the withholding.
If you’re worried about higher rates for longer, insurance blue chips are a great investment.
- their cost of capital is free (insurance float)
- they mostly invest in bonds
- so rising rates benefit earnings growth.
Reasons To Potentially Buy MFC Today
| Metric | Manulife Financial |
| Quality | 87% 12/13 Quality Super SWAN (Sleep Well At Night) Insurance Company |
| Risk Rating | Very Low Risk |
| DK Master List Quality Ranking (Out Of 500 Companies) | 147 |
| Quality Percentile | 71% |
| Dividend Growth Streak (Years) | 9 |
| Dividend Yield | 5.9% |
| Dividend Safety Score | 90% |
| Average Recession Dividend Cut Risk | 0.5% |
| Severe Recession Dividend Cut Risk | 1.50% |
| S&P Credit Rating | A stable outlook |
| 30-Year Bankruptcy Risk | 0.66% |
| LT S&P Risk-Management Global Percentile |
81% Very Good, Very Low Risk |
| Fair Value | $24.88 |
| Current Price | $16.63 |
| Discount To Fair Value | 33% |
| DK Rating |
Potential Very Strong Buy |
| PE | 6.8 |
| Growth Priced In | -3.4% |
| Historical PE | 10 to 12.5 |
| LT Growth Consensus/Management Guidance | 8.8% |
| 5-year consensus total return potential |
16% to 26% CAGR |
| Base Case 5-year consensus return potential |
21% CAGR (3X the S&P 500) |
| Consensus 12-month total return forecast | 22% |
| Fundamentally Justified 12-Month Return Potential | 56% |
| LT Consensus Total Return Potential | 14.7% |
| Inflation-Adjusted Consensus LT Return Potential | 12.4% |
| Consensus 10-Year Inflation-Adjusted Total Return Potential (Ignoring Valuation) | 3.22 |
| LT Risk-Adjusted Expected Return | 10.22% |
| LT Risk-And Inflation-Adjusted Return Potential | 7.93% |
| Conservative Years To Double | 9.08 vs 15.2 S&P |
(Source: Dividend Kings Zen Research Terminal)
Manulife 2024 Consensus Total Return Potential
(Source: FAST Graphs, FactSet)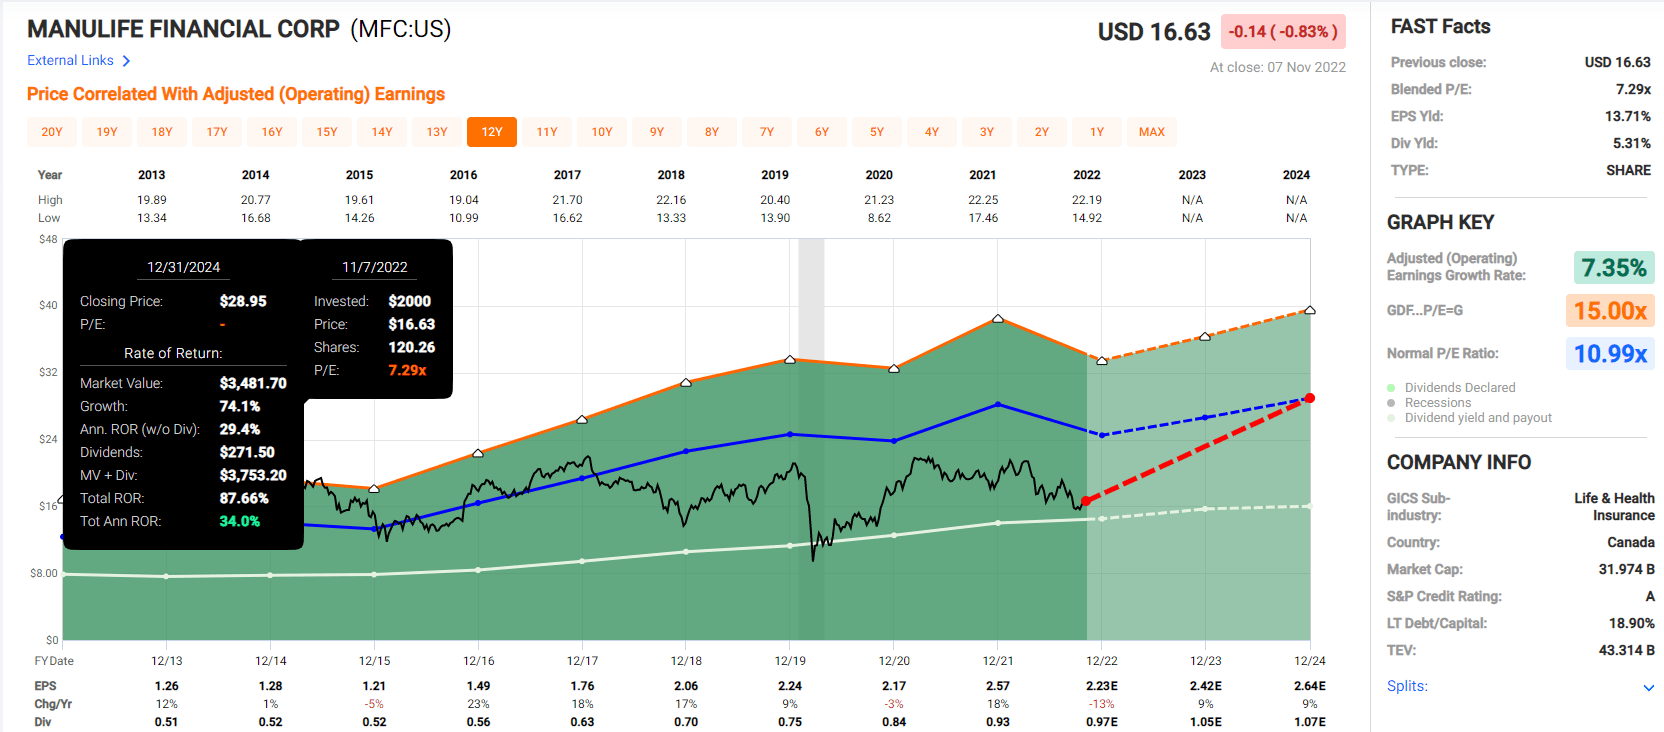
If MFC grows as expected and returns to historical fair value by 2024 that’s a potential 87% total return or 34% annually.
Manulife 2027 Consensus Total Return Potential
(Source: FAST Graphs, FactSet)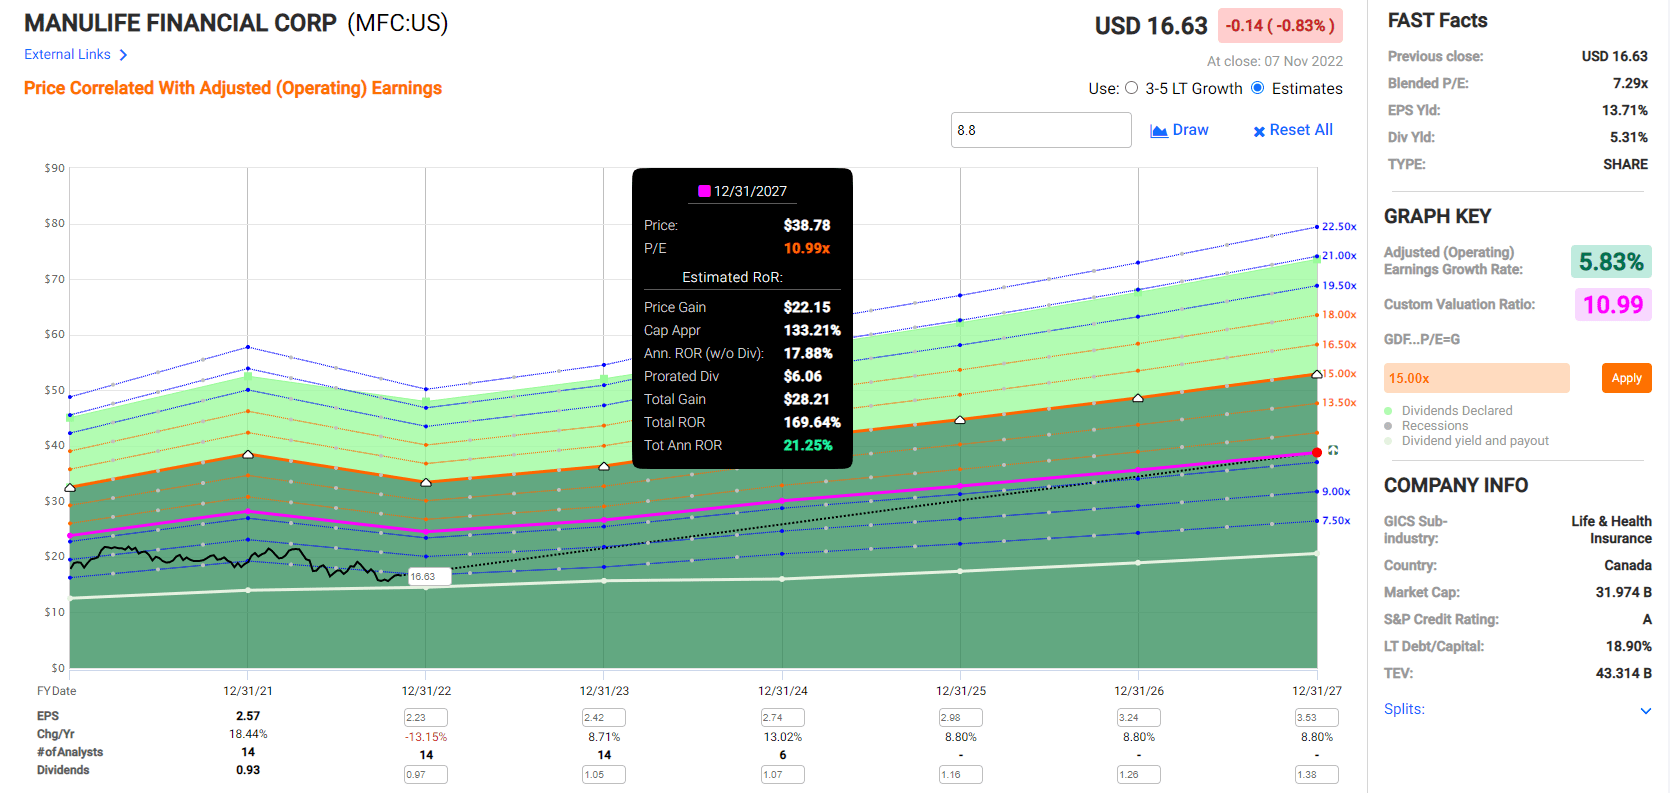
If MFC grows as expected for the next five years and returns to historical mid-range fair value, that’s a 170% total return or Buffett-like 21% annually.
- about 2.5X the S&P 500 consensus.
Manulife Investment Decision Score
DK (Source: Dividend Kings Zen Research Terminal) 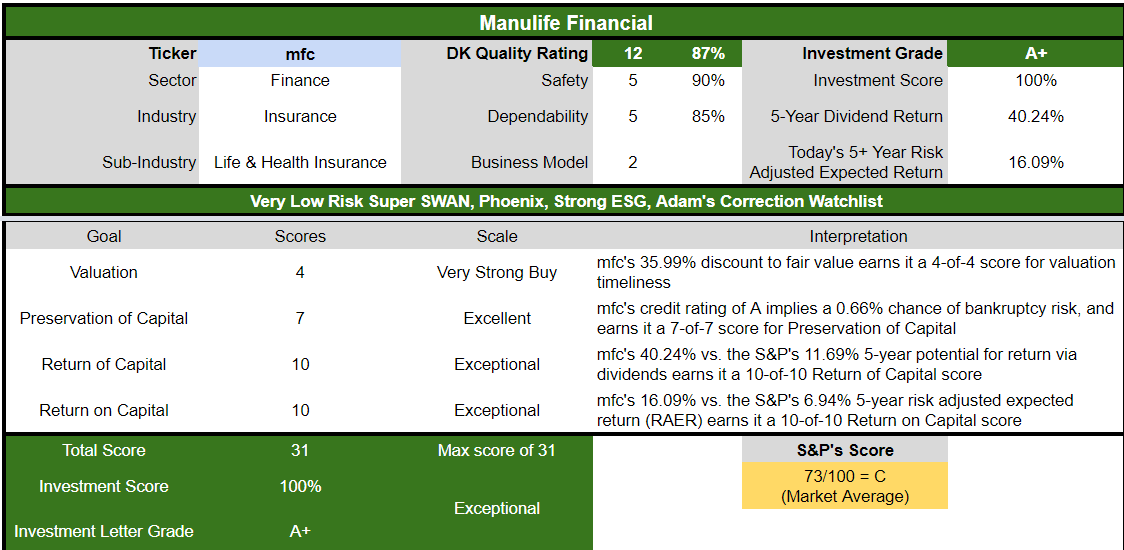
MFC is a potentially exceptional high-yield anti-bubble blue-chip opportunity for anyone comfortable with its risk profile. Look at how it compares to the S&P 500.
- 36% discount to fair value vs. 3% S&P = 33% better valuation
- 5.9% safe yield vs. 1.8% (more than 3X higher )
- 50% better long-term annual return potential
- 2.5X higher risk-adjusted expected returns
- 3.5X higher consensus dividend income over the next five years.
Legal & General: A Great Way To Profit From The UK’s Eventual Recovery
Further Reading
- Legal & General Group: A Safe 9.2% Yield That Could Change Your Life
- full investment thesis, growth outlook, and risk profile.
Tax Implications
- LGGNY is a UK corporations
- no dividend tax withholding
- but ADR fee is approximately 5% of the dividend
- if you buy the UK listed version (LGEN) you pay a higher commission but avoid the ADR fee.
Legal & General was never at risk from the UK pension apocalypse the Bank of England had to step in to avoid with QE.
But it has been battered by the overall weakness in the UK economy, which is now expected to face two years of recession.
However, the big opportunity here is that the Pound which is trading at $1.15 is expected to recover, post recession to its post-Brexit norm of 1.4 according to FactSet.
- A 22% appreciation of the Pound = 22% higher US dividends for American investors.
And in the meantime LGGNY offers an incredible combination of safety, quality, and value, the kind you only get in recessionary bear markets.
Reasons To Potentially Buy LGGNY Today
| Metric | Legal & General |
| Quality | 72% 10/13 Quality Blue-Chip Insurance Company |
| Risk Rating | Low Risk |
| DK Master List Quality Ranking (Out Of 500 Companies) | 425 |
| Quality Percentile | 16% |
| Dividend Growth Streak (Years) | 1 |
| Dividend Yield | 8.2% |
| Dividend Safety Score | 70% |
| Average Recession Dividend Cut Risk | 1.0% |
| Severe Recession Dividend Cut Risk | 3.00% |
| S&P Credit Rating | A stable outlook |
| 30-Year Bankruptcy Risk | 0.66% |
| LT S&P Risk-Management Global Percentile |
79% Good, Low Risk |
| Fair Value | $21.79 |
| Current Price | $13.79 |
| Discount To Fair Value | 37% |
| DK Rating |
Potential Strong Buy |
| P/E | 7.0 |
| Growth Priced In | -3.0% |
| Historical P/E | 10 to 12 |
| LT Growth Consensus/Management Guidance | 5.2% |
| 5-year consensus total return potential |
19% to 25% CAGR |
| Base Case 5-year consensus return potential |
21% CAGR (2.5X the S&P 500) |
| Consensus 12-month total return forecast | 37% |
| Fundamentally Justified 12-Month Return Potential | 66% |
| LT Consensus Total Return Potential | 13.4% |
| Inflation-Adjusted Consensus LT Return Potential | 11.1% |
| Consensus 10-Year Inflation-Adjusted Total Return Potential (Ignoring Valuation) | 2.87 |
| LT Risk-Adjusted Expected Return | 9.32% |
| LT Risk-And Inflation-Adjusted Return Potential | 7.03% |
| Conservative Years To Double | 10.24 vs. 15.2 S&P |
(Source: Dividend Kings Zen Research Terminal)
LGGNY is an anti-bubble ultra-yield blue-chip trading at 7X earnings and priced for -3% CAGR growth, while analysts see 5.2% long-term growth.
It’s so undervalued that analysts expect 37% total returns within a year, though a 66% 12-month return would be justified by its fundamentals.
Legal & General 2024 Consensus Total Return Potential
(Source: FAST Graphs, FactSet)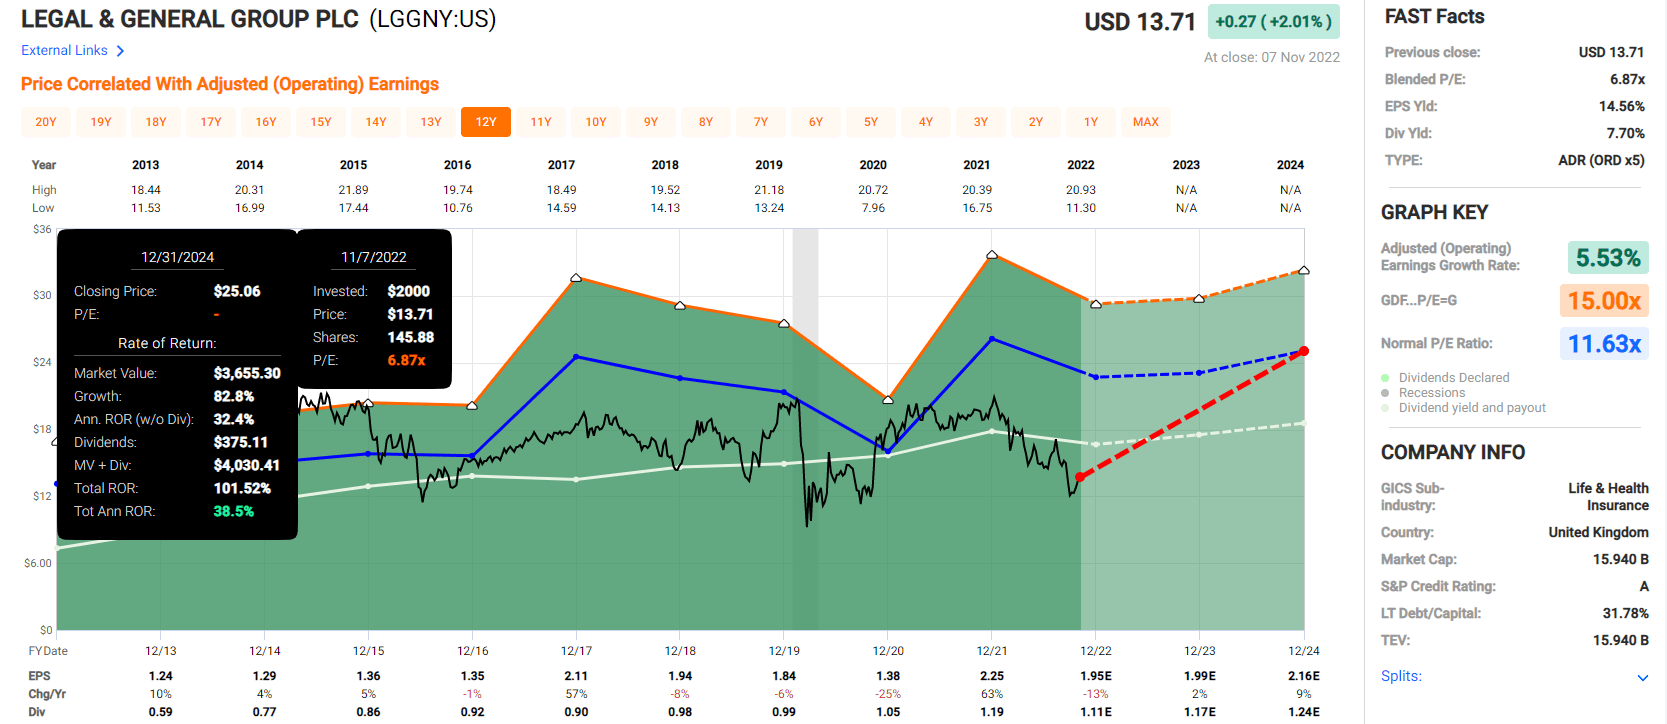
If LGGNY grows as expected and returns to historical fair value it could double in two years, delivering 39% CAGR returns.
- more than 3X the S&P 500 consensus.
Legal & General 2027 Consensus Total Return Potential
(Source: FAST Graphs, FactSet)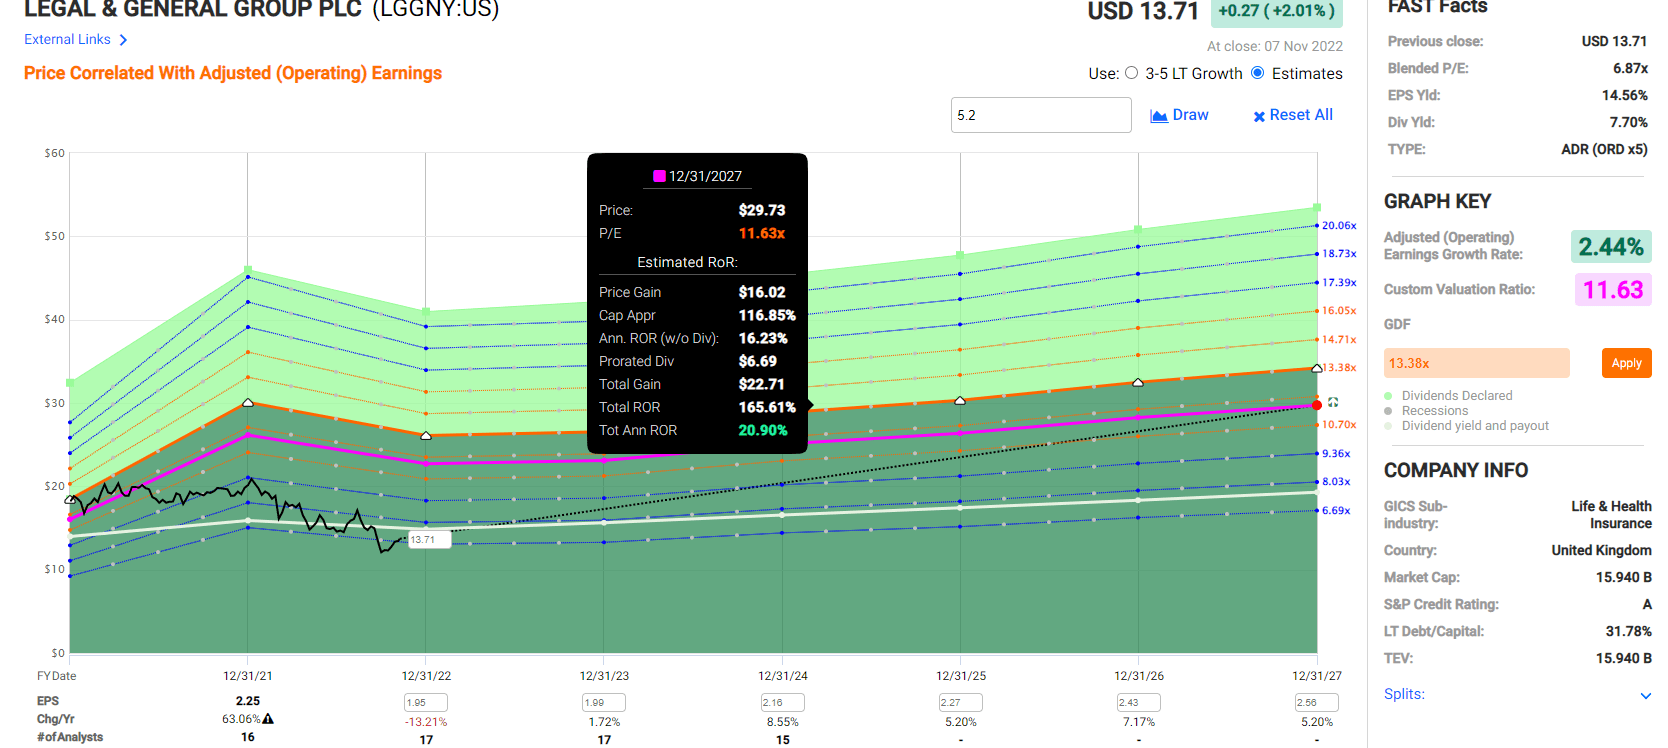
If LGGNY grows as expected over the next five years and returns to historical fair value, it could deliver 165% total returns or 21% annually.
- Buffett-like return potential that’s 2.5X the S&P consensus.
Legal & General Investment Decision Score
DK (Source: Dividend Kings Zen Research Terminal) 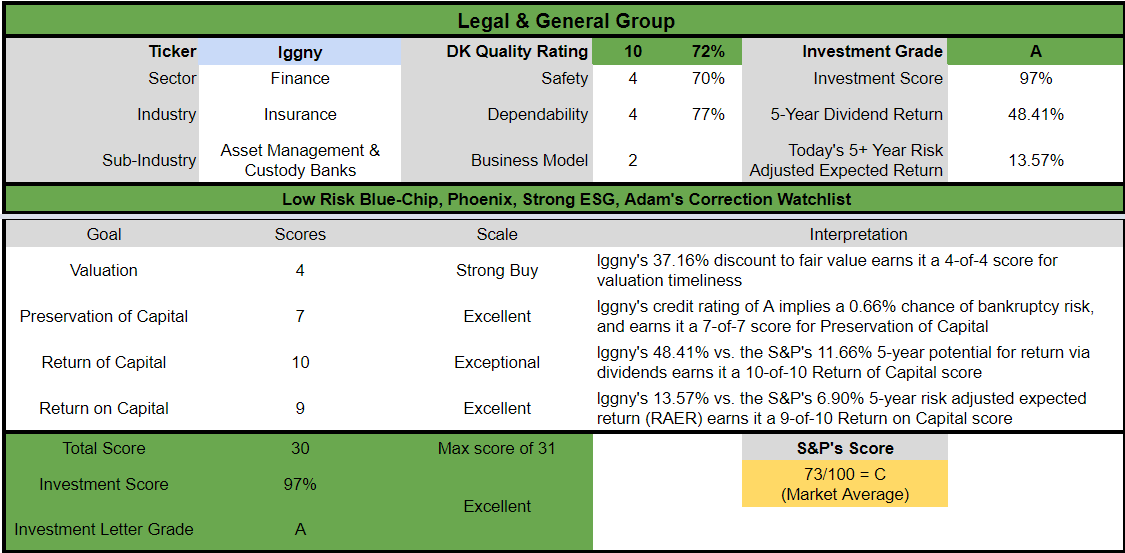
LGGNY is a potentially excellent anti-bubble blue-chip ultra-yield opportunity for anyone comfortable with its risk profile. Look at how it compares to the S&P 500.
- 37% discount to fair value vs. 3% S&P = 34% better valuation
- 8.2% safe yield vs. 1.8% (4.5X higher )
- 35% better long-term annual return potential
- 2X higher risk-adjusted expected returns
- 4X higher consensus dividend income over the next five years.
Bottom Line: The Market Is Dead Wrong About Comcast And These A-Rated High-Yield Blue Chips
Let me be clear: I’m NOT calling the bottom in CMCSA, LGGNY, or MFC (I’m not a market-timer).
Sleep Well At Night quality blue chips doesn’t mean “can’t fall a lot in a bear market.”
Fundamentals are all that determine safety and quality, and my recommendations.
Volatility isn’t risk, it’s the source of future returns” – Joshua Brown, CEO, Ritholtz Wealth Management.
- over 30+ years, 97% of stock returns are a function of pure fundamentals, not luck
- in the short term; luck is 25X as powerful as fundamentals
- in the long term, fundamentals are 33X as powerful as luck.
While I can’t predict the market in the short term, here’s what I can tell you about these three A-rated high-yield blue chips.
| Investment Strategy | Yield | LT Consensus Growth | LT Consensus Total Return Potential | Long-Term Risk-Adjusted Expected Return | Long-Term Inflation And Risk-Adjusted Expected Returns | Years To Double Your Inflation & Risk-Adjusted Wealth |
10-Year Inflation And Risk-Adjusted Expected Return |
| Manulife Financial | 5.9% | 8.8% | 14.7% | 10.3% | 8.0% | 9.0 | 2.15 |
| Comcast | 3.7% | 10.5% | 14.2% | 9.9% | 7.6% | 9.5 | 2.08 |
| Legal & General | 8.2% | 5.2% | 13.4% | 9.4% | 7.1% | 10.2 | 1.98 |
| Nasdaq | 0.8% | 11.8% | 12.6% | 8.8% | 6.5% | 11.0 | 1.88 |
| Schwab US Dividend Equity ETF | 3.6% | 8.5% | 12.1% | 8.4% | 6.1% | 11.8 | 1.81 |
| Dividend Aristocrats | 2.6% | 8.5% | 11.1% | 7.8% | 5.4% | 13.2 | 1.70 |
| S&P 500 | 1.8% | 8.5% | 10.3% | 7.2% | 4.9% | 14.8 | 1.61 |
(Sources: DK Research Terminal, FactSet, Ycharts, Morningstar)
These A-rated anti-bubble blue chips offer an exceptional combination of safety, quality, yield, growth, and valuation, resulting in some of the best high-yield bargain hunting on Wall Street right now.
For anyone looking to take advantage of this recessionary bear market they make excellent choices.
Comcast is the #1 choice for those seeking a world-class blue-chip at a 50% discount, which could potentially quadruple in 5 years.
MFC is a great alternative for those seeking strong growth and even higher return potential from a more attractive very safe yield.
And LGGNY is the highest yielding option, and combined with modest growth offers market and even Nasdaq-beating return potential from these rock bottom prices.
It might be hard to believe, but bear markets truly are the stuff rich retirement dreams are made of.
And with world-class companies like these, you can be sure that skilled, adaptable, and trustworthy management is working hard for you, so one day you don’t have to.
Be the first to comment