

olm26250
Intro
If we pull up a technical chart of Cohu, Inc. (NASDAQ:COHU), we can see that shares have been trading in a sideways consolidation pattern for some time now. In fact, shares have tried to break out of this consolidation in August and recently in October of this year, but the stock’s 200-day moving average put a swift halt to those respective breakout attempts. Suffice it to say, the trading range here in Cohu is quite narrow and this brings opportunity for the following reason.
Cohu Technical Chart (Stockcharts.com)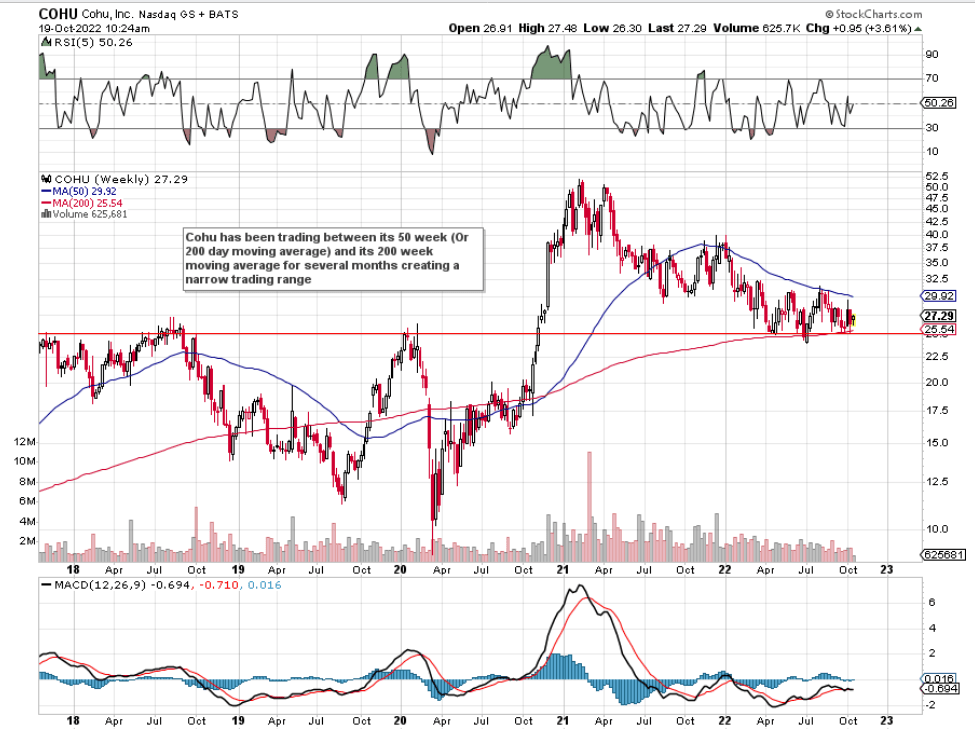
As we can see above, shares of COHU topped out in early 2020 as well as mid-2018 at levels very close to where shares are trading presently. Once shares finally broke out above this multi-year resistance area in late 2020, what was formerly long-term resistance quickly became downside support. Suffice it to say, given the stronger buying volume we have seen since July of this year with shares making higher highs in the process, we believe shares are at minimal risk of breaking through downside support here. In fact, given how close shares are trading to support, the play here would be to put long deltas to work and then a very tight trailing stop just under the entry price. Trends in the following areas further demonstrate the momentum (which denotes a bottoming pattern & not a topping one) Cohu is undergoing at present.
Cohu Margin Growth
Margin growth in a company can definitely be impactful when shares are trading below their average valuation multiples. Cohu’s non-GAAP forward earnings multiple comes in at a very keen 10.05, especially when compared to the company’s 5-year average of 24.48. Suffice it to say, taking the stock’s cheap earnings into account, when we see a jump in Cohu’s Non-GAAP gross margin to 46.5% in Q2 this year (up from 42.7% in the same period of 12 months prior), it becomes noteworthy. Cohu’s growing gross margin is down to strength both in the semiconductor test business as well as the insourcing of contactor manufacturing. Furthermore, Cohu’s recurring income segment continues to grow (as a result of more installed systems & semiconductor product designs) which means this trend will be a clear tailwind for the company’s margins. Furthermore, increasing recurring income brings more stability to the business which we witnessed in Cohu’s second quarter. Top-line sales came in higher than expected and profitability came in ahead of expectations. These trends tie into how the company should continue to grow over time.
Cohu Revenue Distribution Breakdown (Seeking Alpha)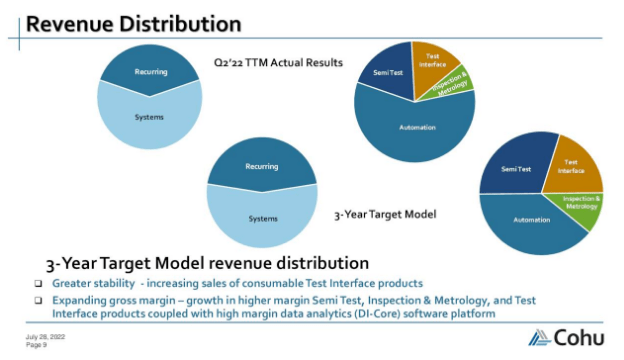
Growth Cycle
When a company has undervalued cash flow, earnings, assets, and sales for the most part as we can see below, it stacks the odds in favor of sustained growth going forward as long as the company can remain profitable and company debt is under control. Put another way, as long as sales and earnings can generate sufficient cash flow, then that very same positive cash flow can be used to invest aggressively in the company to jumpstart the growth cycle once more. Cohu’s shareholder equity increased to $894.5 million at the end of Q2 this year with operating cash flow surpassing $43 million. This cash was used for the most part in paying down debt and buying back stock.
Taking into account these shareholder-friendly tailwinds, Cohu has plenty of opportunities to keep on growing due to the diversification and updated structure of the company post the Xcerra acquisition. Suffice it to say, even if mobility and consumer remain subdued for a period of time, Cohu’s automotive & industrial segments can easily continue to take the lead here. It is clear for example that the DiamondX platform (due to more & more manufacturers choosing this platform) has plenty of runway for growth ahead of it in terms of expansion. Any one area can in fact lead in Cohu which is reassuring from a shareholder’s standpoint. This is why management believes it can get to $1 billion in sales and 49% in non-GAAP gross margin in the not-too-distant future.
Conclusion
The combination of Cohu’s technicals (which point to a bottoming pattern) and margin growth which is a result of a higher recurring income business model, there is a lot to like here from an investor’s standpoint. We look forward to continued coverage.
Be the first to comment