

selvanegra/iStock via Getty Images
Investment Summary
From the Portfolio Manager’s Desk
As we roll fully into H2 FY22 portfolio construction should concentrate on mirroring the distribution of potential outcomes in the global economy, by estimation. This increasingly concerns the prospects of recession, sticky inflation, and central bank tightening. Ideally, investors should be searching for names offering ~20% margin of safety in definable terms, in order to withstand a further 20% decline in US earnings estimates.
Obtaining exposure to key risk premia that are driving equity returns is also key to minimizing equity drawdown and guiding asset allocation in FY22. Increasing risk budgeting toward equity allocation only looks to increase portfolio risk, drawdown and standard deviation without the higher expected returns to compensate. Therefore, we need exposure to low-beta, high quality names that offer uncorrelated alpha potential.
Alas, in our examination of Codexis, Inc. (NASDAQ:CDXS) we have found lack of equity premia to harvest from this name. Balancing the downside is a potential value gap in valuation of ~10% to the upside, should the stock revert towards mean equity multiples. However, in spite of this, our findings show there are numerous other challenges CDXS must overcome in order to justify its inclusion into a macro-focused, long-biased equity portfolio. We rate shares neutral with a price target of $9.
Exhibit 1. CDXS 6-month price action
Data: Refinitiv Eikon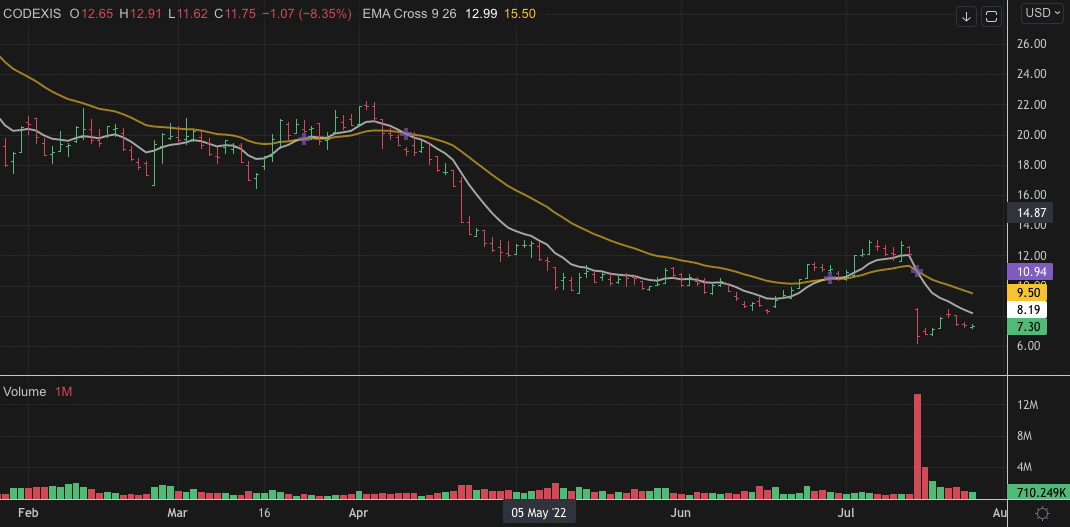
Market factors
Investors have rolled back the risk budget to equities this year. As an asset class, both equities and fixed income have underperformed in FY22, as covariances become increasingly important. For stocks, those high-beta names within the growth trade of FY20/FY21 have been punished and pared gains back to pre-pandemic levels. As such, low-beta, high quality strategies look to offer investors strategic and tactical alpha in portfolio construction. Moreover, investors are rewarding this kind of premia in H2 FY22.
In this vein we find that CDXS lags and has weakened against the benchmark this year. Although, this trend had been in situ since November FY21, as seen in Exhibit 2. At the same time, CDXS has maintained a notably high equity beta versus the SPX. This covariance structure shifted upward in September FY21, as observed below, preceding its weakness against the benchmark. These are undesirable characteristics that investors are shying away from. As investors look to step up in quality and liquidity, one other factor to consider for portfolio construction is resiliency. In that regard, equity beta is destructive to portfolio resilience, and hence CDXS is unattractive on this front.
Exhibit 2. Covariances remain high to the benchmark whilst weakening in relative strength
Data: Updata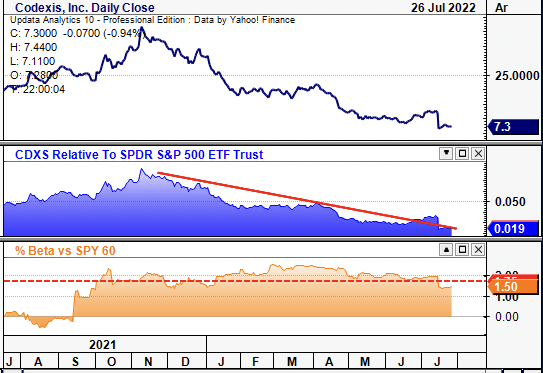
Moreover, CDXS is softening against the medical devices and health care equipment sector, as seen in the chart below. This is important, as the sector has caught a bid since June. Hence, CDXS is diverging away from a strengthening market. As investors have begun rewarding idiosyncratic risk factors in FY22 (bottom-line fundamentals in particular), it implies there is a lack of premia available to harvest in this name.
Exhibit 3. CDXS bifurcating away from the sector to the downside
Data: Updata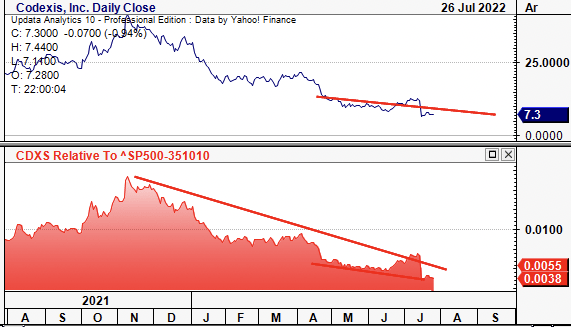
Valuation
Profitability has been a standout feature of outperforming names on the tactical allocation side. With CDXS, its lack of profitability makes it difficult to assign a concrete valuation. Investors are also finished with rewarding top-line growth metrics and are now concerned on bottom-line fundamentals instead (earnings quality, FCF conversion, equity value, etc). CDXS trades at ~3x book value, and ~4.5 sales, both at discounts to the GICS peer median. The question is, is the discount warranted, or is there a pricing asymmetry here. Our estimate that it’s warranted, as we discuss in later sections.
Exhibit 4. Multiples and Comps
Data: HB Insights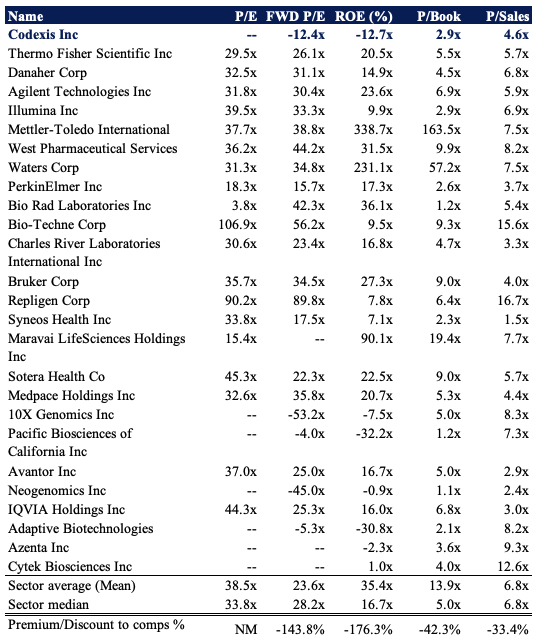
We are also paying ~2x enterprise value (“EV”)/book value, which we opt to use as a cleaner measure of corporate value. If we were to theoretically pay 2x EV/book, then we’d be paying $6.60, leading us to believe that CDXS could in fact be around 10% undervalued. As such, we price the stock at $9 based on this assessment of corporate value.
Exhibit 5. Looking at measures of corporate value there could be some pricing asymmetry with ~10% value gap to the upside
Data: HB Insights Estimates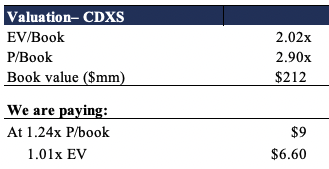
Portfolio Statistical factors
Balanced portfolios, especially those with exposure to commodities and alternatives, have been the star performers in FY22. Alternatives in particular have stuck true to form whilst equity markets roll down. The asset class has retained uncorrelated, strategic alpha and reduced equity drawdown, for those with an equal weight across portfolios. As seen in Exhibit 5, an equal weighted portfolio with weighting across 5 asset classes (Portfolio 2) has produced a total return of 600bps from January-July FY22. On this return drawdown is clamped to 3% and standard deviation to ~6%, giving a high-Sharpe and Sortino setup.
Exhibit 6. Portfolio Statistical series
Data: HB Insights HB Insights, portfoliovisualizer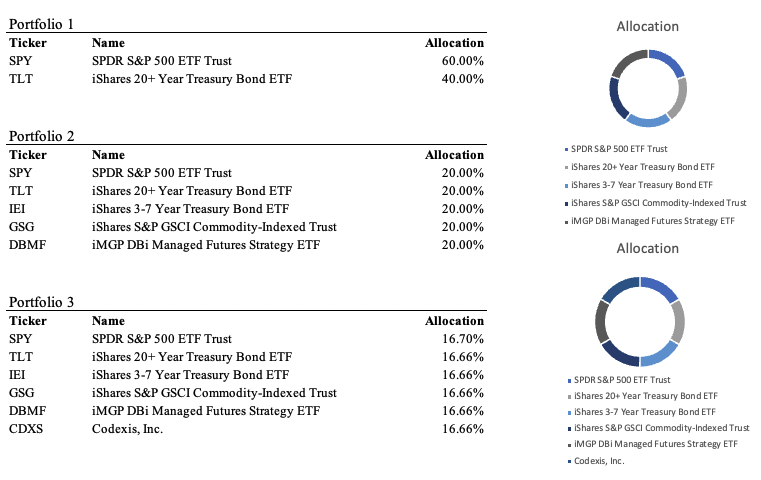

Back-testing CDXS’s inclusion into this balanced setup sees it add additional equity risk without substantiating this with additional return. Drawdown widens to almost 14%, whereas standard deviation more than doubles to 13.2%. As such, this is a negative risk-adjusted return of -13% (current max drawdown). These same trends occur when weighting CDXS from equal weight down to 1% of the portfolio constituent allocation. At less than 100bps allocation, we can hardly see a meaningful return on a 20-25 stock selection.
Hence, whilst backward looking, if we presume the medium-term outlook is to mirror similar market fundamentals, then this serves as a good bedrock to work from.
Fundamental factors
Quarterly operating results have been lumpy for CDXS on a sequential basis from FY15 to date, as seen in the chart below. Looking at 5-year history, quarterly operating margin has normalized at a loss of 32%, whilst investors have averaged a -1.76% FCF yield in that time. It printed quarterly operating margin of -24% in Q1 FY22, whilst FCF margin was a -46% of turnover on a loss of ~$23 million.
Exhibit 7.
Data: HB Insights, Refinitiv Eikon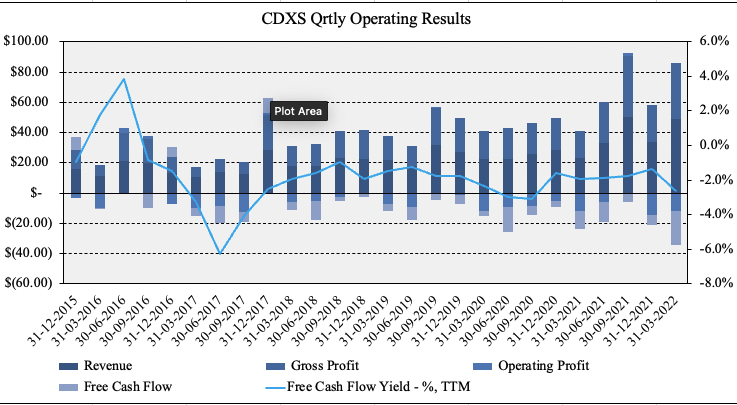
Whilst it has grown it continues to build top-line volume, but bottom-up income is less appealing. Earnings quality appears to be a headwind looking ahead. For instance, investors continue to realize a loss on EPS. Q1 FY22 earnings were -$0.18, below the 5-year average of -$0.14. Moreover, return on capital has lagged peers and remains in the red, as seen in Exhibit 7. Here we examined the amount of NOPAT generated from last year’s capital. As it shows, NOPAT has printed negative since FY20, whilst it CDXS has failed to deliver a net-return on its invested capital since FY18. It came in at ~-1% last quarter, whilst the WACC is ~+13%. As such, the ROIC/WACC ratio is just -7%. These are factors keeping us on the sidelines.
Exhibit 8.
Data: HB Insights; Refinitiv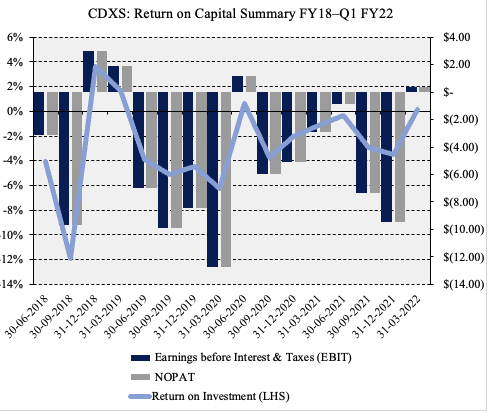
In short
After running CDX through a series of statistical and fundamental tests we find there is a lack of flesh to put on the skeleton with the name. As mentioned, portfolio construction should contain an element of market positioning, and CDXS illustrates undesirable characteristics of high equity beta and weakening momentum vs. the sector.
In addition, FCF conversion has been weak alongside profitability, features that investors have shied away from in FY22, regardless of top-line growth. Bottom-up the P&L, the fundamental case unravels further. We also note it hasn’t illustrated an ongoing stream of ROIC to outweigh the cost of capital. Should it need to raise further capital, it now has a decision of entering the high-yield corporate debt capital markets, or complete further equity raises albeit this time at compressed multiples.
Balancing the downside is the prospect of valuation, where we note CDXS could be trading ~10% below book value, and is trading at respectable multiples to corporate value. With that in mind, we price the stock at $9. However, with too much weight stacked on the downside of the risk/reward calculus, we rate neutral.
Be the first to comment