

JuSun
Investment summary
From the portfolio managers’ desk
As the distribution of potential outcomes for the global economy leans towards potential recession, tactical equity positioning is paramount. There are still pockets of selective opportunities that enable investors to capture 5-10x the initial return on investment if the due diligence is done correctly.
Helping this is the fact broad equity markets have compressed heavily in FY22, leaving the opportunity to purchase a basket of high-rating securities at multiples not seen in years.
In previous analysis of Codexis, Inc. (NASDAQ:CDXS) I found there was a lack of equity premia to harvest. It also failed to justify its inclusion into a macro-focused, long-biased equity portfolio. At that point, the position was to hold and await further data.
Investment conclusion
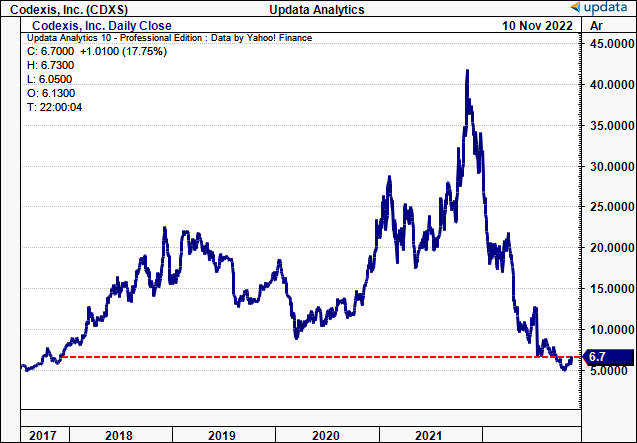
CDXS shares have collapsed spectacularly from FY21 highs and now trade at multiples not seen since FY17, as seen in Exhibit 1. There’s been a notable turn off 52-week lows, with the last 3 weeks closing up.
Question is, does this represent a buying opportunity, or is return to longer-term range unlikely? Here, I wanted to investigate if the recent reversal in the CDXS share price indicates a change in investor bias towards the stock. Data-driven analysis suggests again to withhold from entry. Net-net, I continue to rate CDXS a hold.
Exhibit 1. Spectacular erosion of equity gains in CDXS shares, with the stock now trading at ranges not seen since FY17.
Data: Updata
Macro-landscape unsupportive of upside for CDXS
Investment conditions for equity investors deteriorated rapidly at the turn of the year. Chief to the destruction of value in both equity and cross asset portfolios (especially 60/40 setups) are stock-bond correlations, that ticked up to their highest in years.
As central bank tightening and inflation prints became the global narrative, the market equalized accordingly. Yields at the belly and long-end of the curve have rolled to their highest in years, with the US 10-year yield averaging >4% for October (currently at 3.8%).
As seen in Exhibit 2, growth stocks (negative earnings, high sales growth, high P/E or P/B) – of which CDXS is a constituent in my firm belief – have continued their descent into chaos across the 12 months to date.
The question really is, how long yields are expected to hold this range, and, what (if anything) might cause growth to rally again in the mid-term?
Exhibit 2. As yields push higher growth factors continue to push lower and this is bad news for the outlook for CDXS by estimation
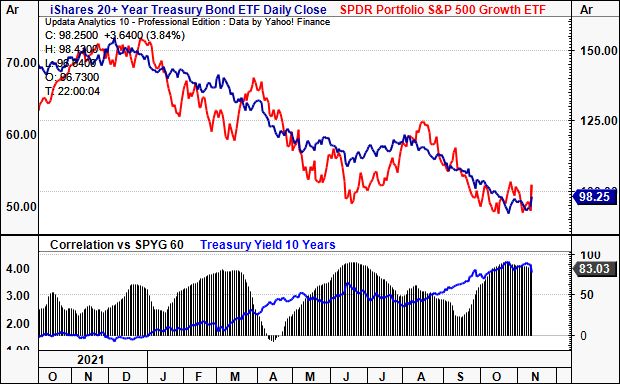
Note: Bond prices shown as inverse of yields. UST 10-yr yield shown in bottom window, blue line. Note as yield(s) lift, correlations follow. (Data: HB Insights, Updata)
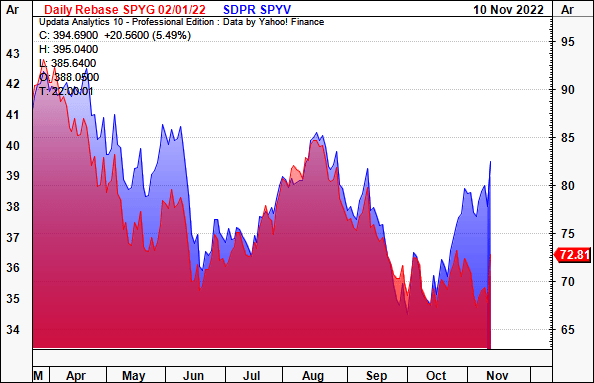
Consequent to the above, it is factors of value that have caught a bid across FY22. The value/growth spread widened substantially in October, as seen in Exhibit 3, creating a large divergence in equity premia that investors are paying for. Risk appetite for growth, therefore, appears to be low from market pundits.
In my estimation, this has ramifications for CDXS looking ahead. It suggests investors are moving away from rewarding top-line growth, and focusing on bottom line fundamentals instead. In the absence of any company-specific drivers for CDXS, it questions buying momentum for the stock.
This is critical information equity investors must consider when positioning tactically in names such as CDXS.
Exhibit 3. Value-growth spread widened from Oct-date, implying divergence in risk appetite of investors
Data: Updata
Case for reversal looks weak for CDXS
In my estimation, analysis of CDXS’s market behaviour and fundamentals indicate this latest rally is unlikely to yield fantastic results.
As seen in Exhibit 4, showing weekly price evolution for CDXS, the stock has been in a continued downtrend for over 52 weeks after faltering from highs of ~$42. It plunged from $34 to $23 in a matter of 2 weeks from January 2 and hasn’t enjoyed >3 weeks positive run-up until October/November this year.
Since the major down-leg in FY22, CDXS bulls have made 3x attempts to form a bottom and restabilize price distribution. But the base of each consolidation has been wide and loose, with indecision on prices. I attribute this to the lack of certainty on CDXS’s earnings growth around each 10-Q filing.
Alas, each sideways consolidation was coupled with unsupportive volume into the move. This shows a lack of overall buying strength in my opinion. This trend occurred from August-October where CDXS faced heavy resistance, judged by the 10-week-long base, before punching back above the 50DMA.
With the latest trend reversal, the base is narrow, and bars are tight, suggesting more confidence in a price level to work from. However, the breakout in volume required for trend reversal is absent. This has been the defining factor for each of the previous attempts for CDXS to break out above the 50DMA in FY22.
Moreover, CDXS continues to decline in relative strength to the SPX. It now performs at 52 weeks lows vs the benchmark. A volume breakout could be supportive of further price action north, but at present, more time is needed to gauge this.
Exhibit 4. Greater than 52 weeks of downtrend, with several attempts to stabilize losses. Each attempt met with poor volume/buying support.
- CDXS Weekly chart, Nov FY21-date.
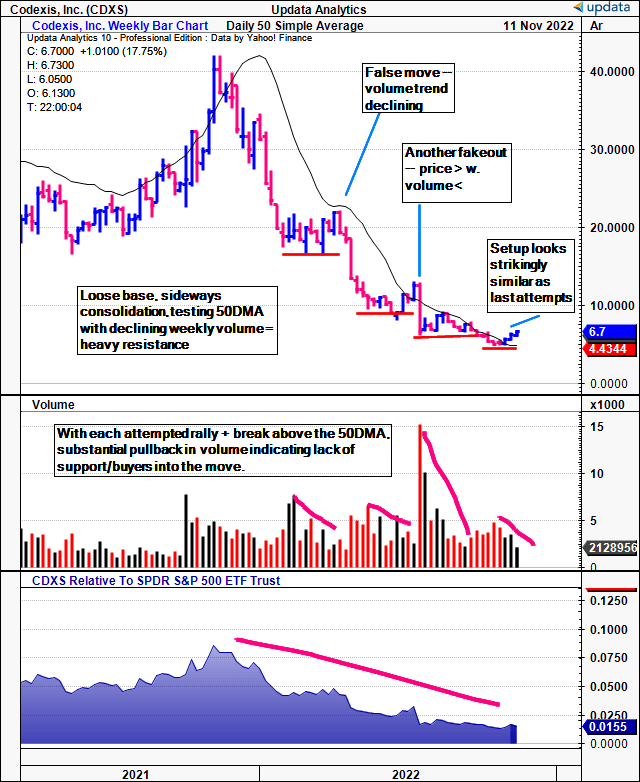
Note: Weekly bars shown, total price return/volume. (Data: HB Insights, Updata)
Earnings decline implies weaker valuation looking ahead
Forward earnings estimates are expected to pull back substantially as well. Our internal projections are seen in Exhibit 5. We see a slowdown in growth at the bottom line for CDXS into FY24. I’ve forecasted a loss per share of $0.54 in FY22, widening to a loss of $1.10 per share in FY23, recovering to ($1.02) by FY24. I’ve also forecast a 31% YoY contraction in revenue across FY22-FY23 inclusive, explaining the decline.
In addition, Q3 FY22 gross margin was 11 percentage points lower YoY, secondary to large revenue declines across “a number of large existing customers”. The pull-through of this is unlikely to be fully realized, in my estimation.
The fact of the matter is that investors aren’t rewarding this kind of fundamental decline anymore. What used to be acceptable mid-term growth drivers for CDXS (Phase 1/2 clinical trials, clinical stage assets, transgene therapy assets, etc.) are now therefore null-and-void.
But management is reliant on this kind of enterprise when looking ahead, especially per language on the Q3 earnings call – per CEO Dr. Stephen Dilly: “…(w)e are hopeful that one of our transgene therapy assets for gene therapy partnered with Takeda should enter Phase I clinical trials in late 2023 or 2024…”.
As such, earnings growth beyond consensus is unlikely, in my opinion, given that management forecast a 26.4% YoY decline in FY22 R&D revenues to $25mm at the upper bound. Management also projects FY22 revenue growth of 34.6% or $141mm at the end of guidance, ahead of our projected 30.4%. I’m very keen to see how it performs relative to estimates.
Exhibit 5. Forward earnings trajectory (projections) unsupportive of long-term trend reversal at this stage
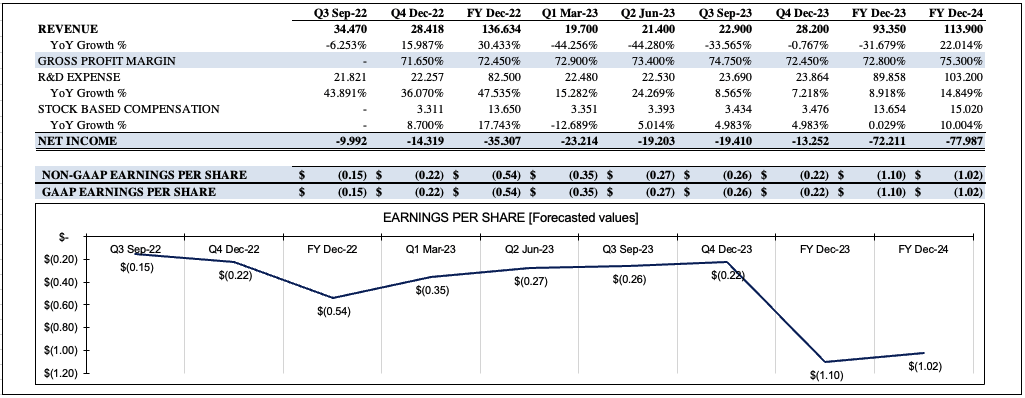
Data: HB Insights Estimates
Historical performance to date is equally as unsettling for potential buyers of CDXS. The lack of historical earnings growth is immediately noted, leading to difficulties in valuation.
Nonetheless, multiples have pulled in heavily after the 82% decline in share price these past 12 months. The level of cash from operations (“CFFO”) supporting the CDXS’s valuation recently curled upward, as seen below. It also printed $18mm in quarterly FCF, its first inflow in 5 years.
However, the $19.7mm in net-CFFO (and FCF inflow) resulted from a $17.8mm YoY change in net working capital, primarily due to a $19.15mm gain in accounts receivable (and therefore wasn’t organic). There was also a 50% YoY gain in stock-based compensation to $4.53mm for the quarter.
There’s also a large difference in CDXS’s NOPAT recognized with R&D as an expenditure vs. capitalized on the balance sheet as an intangible asset, with ex-R&D NOPAT substantially more attractive. Therefore, with management forecasting lower R&D revenue, this places another dampener on CDXS’s value looking ahead in my opinion.
Exhibit 6. Valuations not supported by any long-term CFFO growth, justifying de-rating.
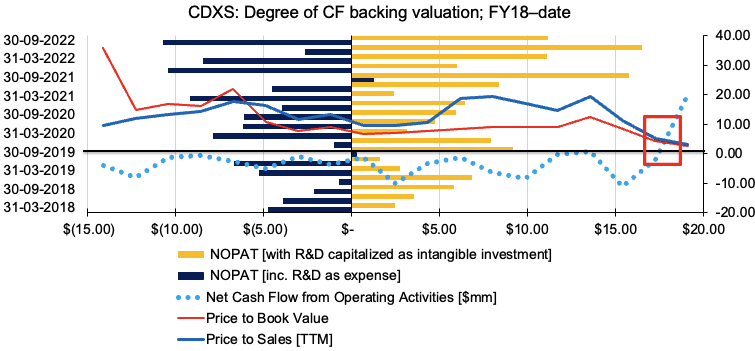
Note: All figures in $mm of (x). (Data: HB Insights, CDXS SEC Filings)
Valuation and conclusion
Shares are trading at 3.2x sales and around 2.8x book value, which aren’t attractive on face value given the data points above. Its book value per share declined ~720bps YoY to $2.34 in Q3, and the lack of forward earnings upside indicates shares have been accurately discounted to their current levels in my estimation. I believe it’s fairly valued at its book value per share of ~$2.35 as this represents the value available in the company. In addition, market data implies the recent reversal in share price is unlikely to yield substantial results, in my estimation. Without directional preference for the market right now, I rate CDXS a hold.
Be the first to comment