metamorworks
By William Nicolle, Analyst, Sustainable Investment Research
Few industries can rival the technology sector’s growth, whose investable market cap grew fivefold over the last decade[1] – but as the investment landscape becomes ever more blustery, with the winds of further interest rate rises on the horizon, the green economy is emerging as a candidate. Growing rapidly, multi-faceted, and with green products and services permeating throughout markets, the green economy’s development increasingly resembles that of the tech sector.
Growing rapidly
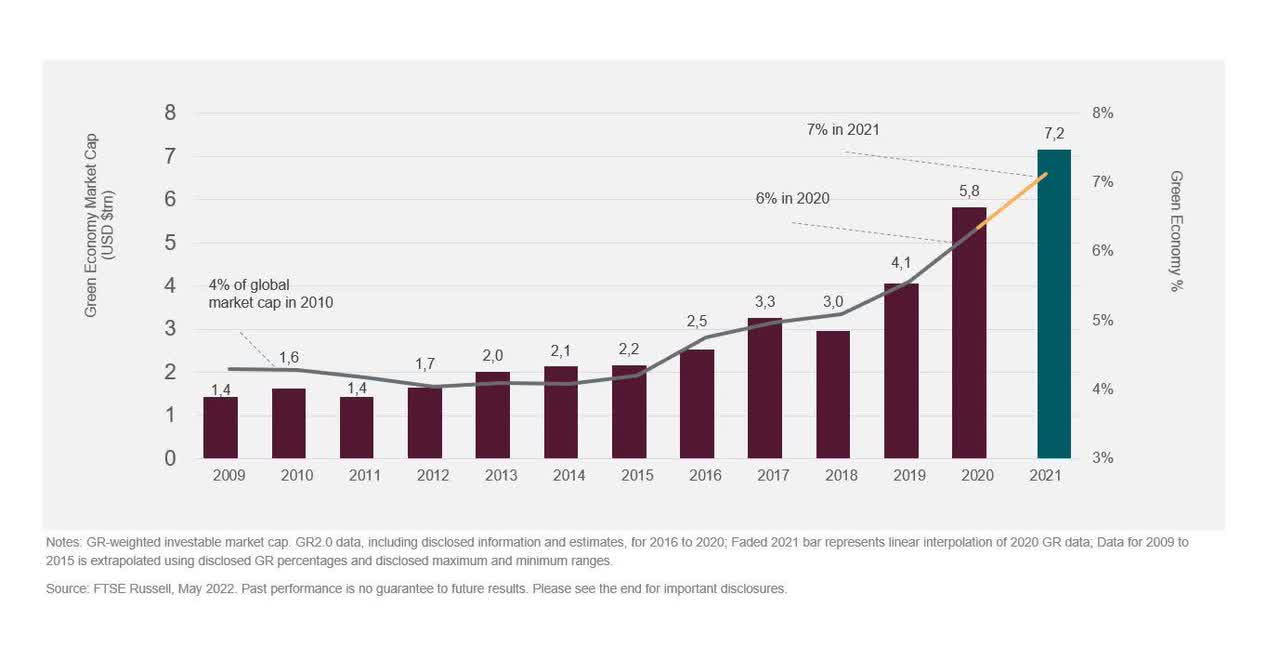
As outlined in our recent paper, Investing in the Green Economy 2022, the market capitalization of green equities ballooned from under USD2 trillion in 2009 to over USD7 trillion by 2021, almost doubling its share of the global investable market from 4% to 7% (Figure 1).
Figure 1. The green economy almost doubled its share of global market cap over the last decade.
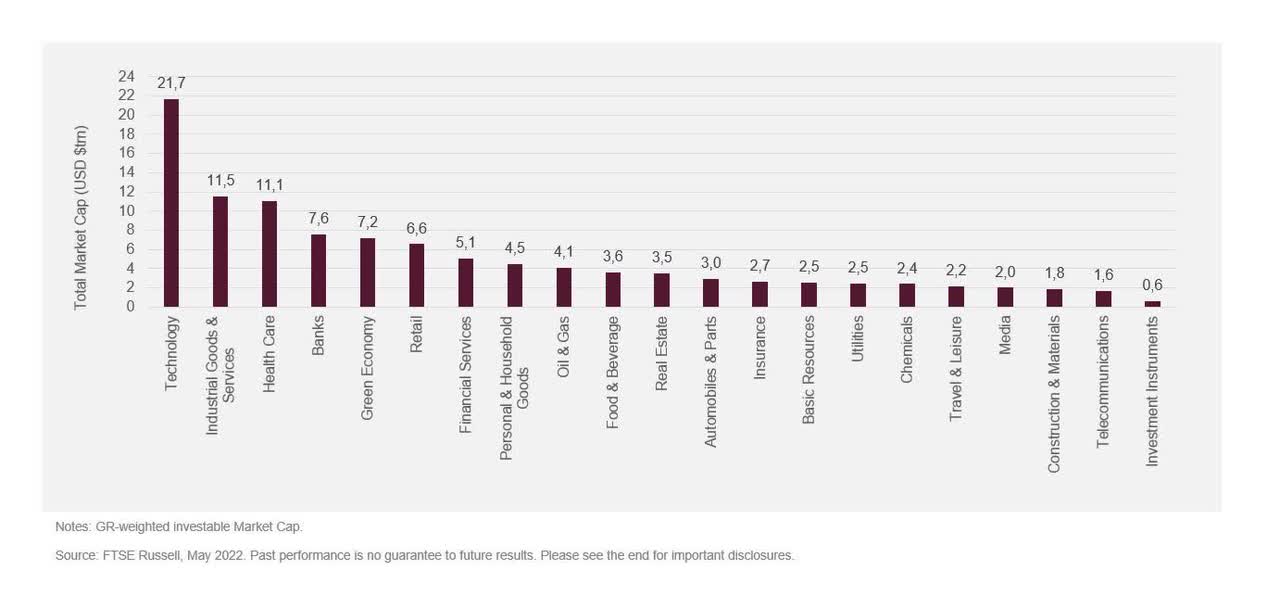
Putting this into perspective, the green economy is now the equivalent of the fifth largest industrial sector by market value (Figure 2) – larger than oil and gas, recently overtaking retail, and closing in on banks. The technology sector was in a similar position in 2008, after which it stormed to become the largest sector by 2015, a position it has held since.[2]
Figure 2. Size of ICB Supersectors vs. the Green Economy.
Multi-faceted
Much like the range of different technology subsectors, from on-demand streaming to Fintech, green subsectors are equally diverse, spanning ‘classic’ green areas like renewable energy to lesser-thought-of subsectors like energy efficiency, recycling, and pollution reduction.
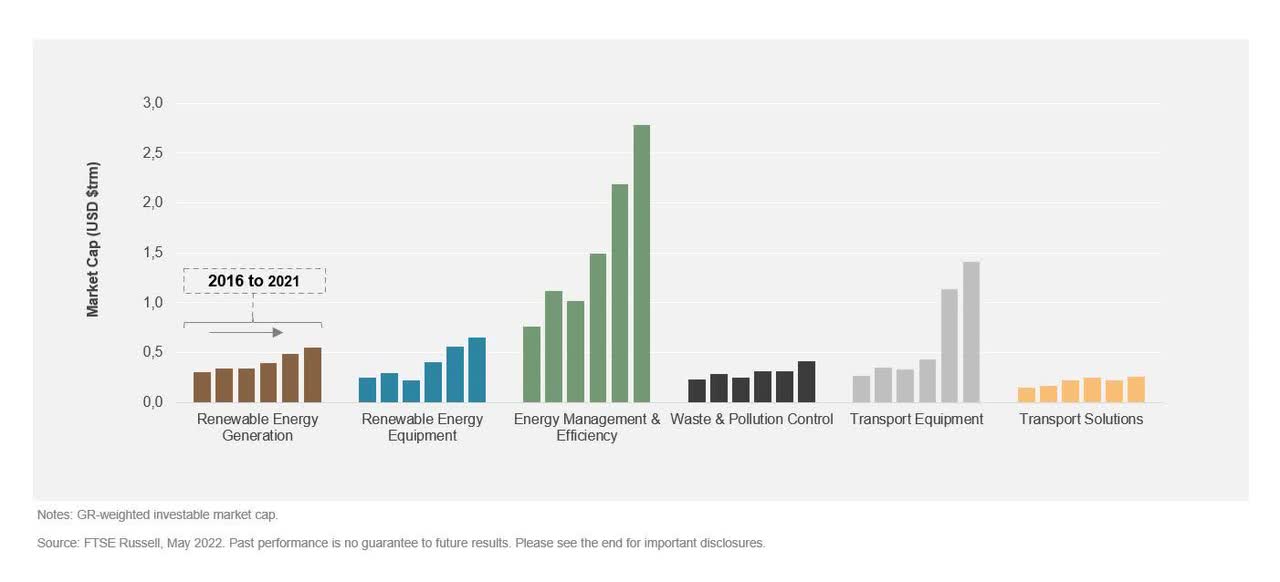
Some are expanding quickly (Figure 3) as green products and services disrupt the markets they enter, particularly the electric vehicle sector, fuelled by the electrification of transport and the momentous rise of firms like Tesla. There are many other, less headline-grabbing areas too – take energy efficiency, whose rocketing market value is mainly driven by cloud computing, benefitting the technology giants, but also wider trends like growing energy demand and the need for cost reductions.[3]
Figure 3. Market value growth in selected green subsectors.
Pervasive
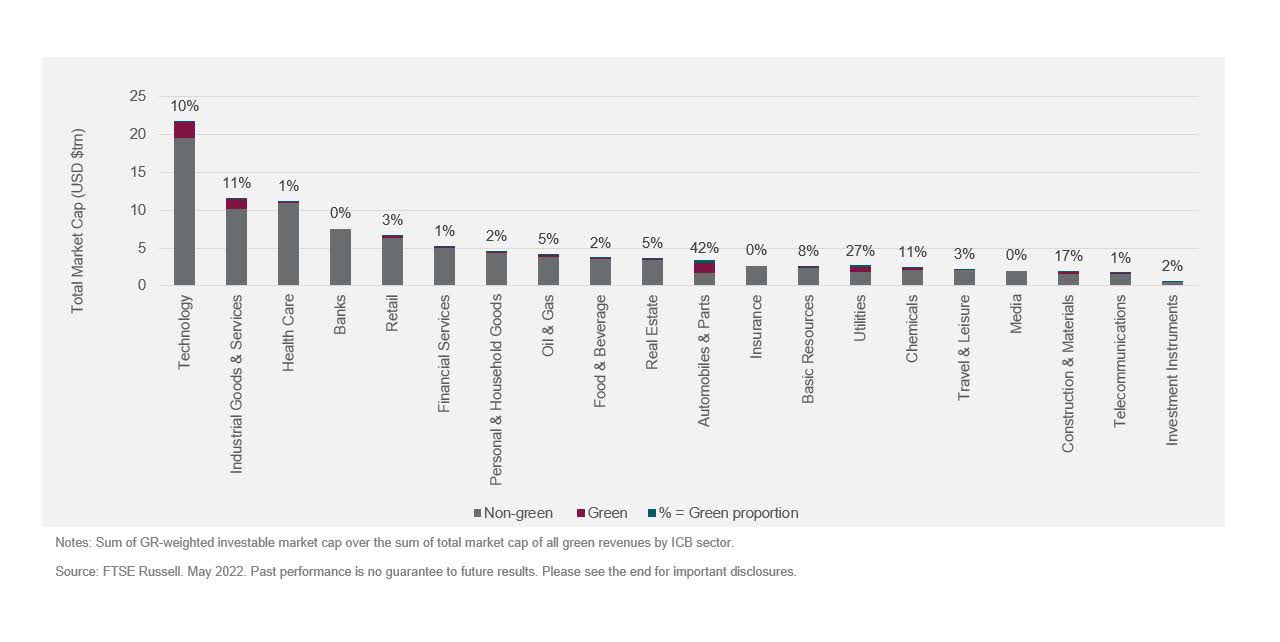
Like technologies, green goods and services are permeating a wide range of industrial sectors (Figure 4). For instance, two-fifths of the autos sector by value is already green, fuelled by the rise of electric vehicles which in turn drives growth across the value chain – spanning EV charging providers, battery manufacturers and lightweight material – in other sectors. Utilities and Industrials also have sizeable green segments, driven by the growing competitiveness of renewable energy and demand for pollution-reducing products and services.
Figure 4. The green economy is pervasive throughout other economic sectors
Globally diversified
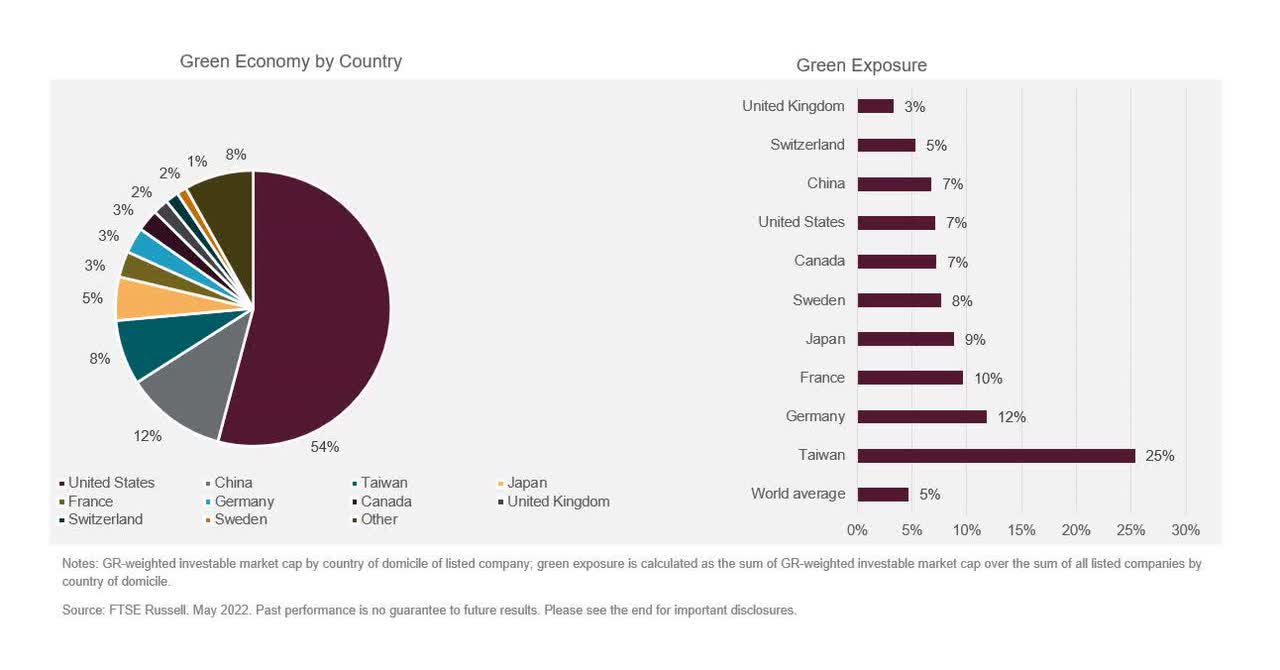
The green economy is globally diverse, albeit with a concentration in certain countries such as the United States (54%), followed by China (12%). The picture is different when we look at the green exposure, i.e., how green is the economy. For example, while smaller in total size, Japan and European countries such as France and Germany have a higher exposure to the green economy. In fact, many countries are making green growth and green jobs a central pillar of their post-COVID growth strategy – another parallel the sector shares with technology. Evidence suggests that dollar for dollar, capital-intensive green investment tends to create more jobs than investment in polluting alternatives.
Figure 5. Like the technology sector, the US and China dominate the green economy by market cap.
As the low-carbon transition accelerates the green economy may continue following in the technology sector’s footsteps – with green products and services continuously permeating throughout the economy, cementing its place as the newest industrial growth sector.[4]
[1] The technology sector increased its investable market cap by five times over the last decade; Total investable market cap of companies included in the FTSE Global Equity Index Series in the Technology ICB Supersector, between 2012 (USD4.0 trn) and 2022 (USD19.2 trn).
[2] The total investable market cap (end of year) of all companies included in the FTSE Global Index Equity Series (as of the end of 2021) with a ICB Supersector classification as ‘Technology’ grew from US1.9 trn in 2008 (5th largest ICB Supersector by investable market cap) to USD21.8 trn in 2021 (largest ICB Supersector).
[3] Green sectors defined under the FTSE Russell Green Revenue Classification; For more details, see FTSE Russell (2020), Green Revenue Classification System 2.0.
[4] FTSE Russell (2022), The green economy in turbulent waters?
© 2022 London Stock Exchange Group plc and its applicable group undertakings (the “LSE Group”). The LSE Group includes (1) FTSE International Limited (“FTSE”), (2) Frank Russell Company (“Russell”), (3) FTSE Global Debt Capital Markets Inc. and FTSE Global Debt Capital Markets Limited (together, “FTSE Canada”), (4) FTSE Fixed Income Europe Limited (“FTSE FI Europe”), (5) FTSE Fixed Income LLC (“FTSE FI”), (6) The Yield Book Inc (“YB”) and (7) Beyond Ratings S.A.S. (“BR”). All rights reserved.
FTSE Russell® is a trading name of FTSE, Russell, FTSE Canada, FTSE FI, FTSE FI Europe, YB and BR. “FTSE®”, “Russell®”, “FTSE Russell®”, “FTSE4Good®”, “ICB®”, “The Yield Book®”, “Beyond Ratings®” and all other trademarks and service marks used herein (whether registered or unregistered) are trademarks and/or service marks owned or licensed by the applicable member of the LSE Group or their respective licensors and are owned, or used under licence, by FTSE, Russell, FTSE Canada, FTSE FI, FTSE FI Europe, YB or BR. FTSE International Limited is authorised and regulated by the Financial Conduct Authority as a benchmark administrator.
All information is provided for information purposes only. All information and data contained in this publication is obtained by the LSE Group, from sources believed by it to be accurate and reliable. Because of the possibility of human and mechanical error as well as other factors, however, such information and data is provided “as is” without warranty of any kind. No member of the LSE Group nor their respective directors, officers, employees, partners or licensors make any claim, prediction, warranty or representation whatsoever, expressly or impliedly, either as to the accuracy, timeliness, completeness, merchantability of any information or of results to be obtained from the use of FTSE Russell products, including but not limited to indexes, data and analytics, or the fitness or suitability of the FTSE Russell products for any particular purpose to which they might be put. Any representation of historical data accessible through FTSE Russell products is provided for information purposes only and is not a reliable indicator of future performance.
No responsibility or liability can be accepted by any member of the LSE Group nor their respective directors, officers, employees, partners or licensors for (A) any loss or damage in whole or in part caused by, resulting from, or relating to any error (negligent or otherwise) or other circumstance involved in procuring, collecting, compiling, interpreting, analysing, editing, transcribing, transmitting, communicating or delivering any such information or data or from use of this document or links to this document or (B) any direct, indirect, special, consequential or incidental damages whatsoever, even if any member of the LSE Group is advised in advance of the possibility of such damages, resulting from the use of, or inability to use, such information.
No member of the LSE Group nor their respective directors, officers, employees, partners or licensors provide investment advice and nothing in this document should be taken as constituting financial or investment advice. No member of the LSE Group nor their respective directors, officers, employees, partners or licensors make any representation regarding the advisability of investing in any asset or whether such investment creates any legal or compliance risks for the investor. A decision to invest in any such asset should not be made in reliance on any information herein. Indexes cannot be invested in directly. Inclusion of an asset in an index is not a recommendation to buy, sell or hold that asset nor confirmation that any particular investor may lawfully buy, sell or hold the asset or an index containing the asset. The general information contained in this publication should not be acted upon without obtaining specific legal, tax, and investment advice from a licensed professional.
Past performance is no guarantee of future results. Charts and graphs are provided for illustrative purposes only. Index returns shown may not represent the results of the actual trading of investable assets. Certain returns shown may reflect back-tested performance. All performance presented prior to the index inception date is back-tested performance. Back-tested performance is not actual performance, but is hypothetical. The back-test calculations are based on the same methodology that was in effect when the index was officially launched. However, back-tested data may reflect the application of the index methodology with the benefit of hindsight, and the historic calculations of an index may change from month to month based on revisions to the underlying economic data used in the calculation of the index.
This document may contain forward-looking assessments. These are based upon a number of assumptions concerning future conditions that ultimately may prove to be inaccurate. Such forward-looking assessments are subject to risks and uncertainties and may be affected by various factors that may cause actual results to differ materially. No member of the LSE Group nor their licensors assume any duty to and do not undertake to update forward-looking assessments.
No part of this information may be reproduced, stored in a retrieval system or transmitted in any form or by any means, electronic, mechanical, photocopying, recording or otherwise, without prior written permission of the applicable member of the LSE Group. Use and distribution of the LSE Group data requires a licence from FTSE, Russell, FTSE Canada, FTSE FI, FTSE FI Europe, YB, BR and/or their respective licensors.
Editor’s Note: The summary bullets for this article were chosen by Seeking Alpha editors.


Be the first to comment