

igoriss/iStock via Getty Images
Investment Thesis
- According to the HQC Scorecard, Coca-Cola (NYSE:KO) scores 58 out of 100 points, which is a moderately attractive overall rating in terms of risk and reward. The company shows very strong results in the Economic Moat (80 out of 100 points) and Profitability (100 out of 100 points) categories but very low results in the Valuation (12 out of 100 points) and Expected Return (20 out of 100 points) categories.
- PepsiCo (NASDAQ:PEP) scores 69 out of 100 points according to the same Scorecard. This is an attractive scoring in terms of risk and reward. PepsiCo achieves very attractive ratings in the categories of Economic Moat (81 out of 100 points), Profitability (80 out of 100 points), Valuation (84 out of 100 points), and Expected Return (80 out of 100 points).
- I rate Coca-Cola as a hold. Despite the company’s strong brand image, economic moat, financial strength, and high profitability, the company’s current valuation and growth perspectives are not attractive enough for a buy rating.
- I rate PepsiCo as a buy. PepsiCo’s strong brand image, in combination with its broad product portfolio (which includes 23 brands generating more than $1 billion in revenue each), high profitability, and growth prospects, make the company an attractive investment in terms of risk and reward.
Coca-Cola and PepsiCo’s Competitive Positions
In a previous analysis for Seeking Alpha, which I wrote about PepsiCo, I already described the company’s competitive advantages in more detail.
Coca-Cola and PepsiCo are among the most valuable brands in the world. Proof of this is the Forbes ranking of the world’s most valuable brands, in which Coca-Cola is ranked 6th, and PepsiCo is ranked 36th.
Both companies have a broad and worldwide distribution network. The company’s distribution network, in combination with its strong brand image, makes it difficult for competitors to enter their business segments. Additionally, the strong brand images of Coca-Cola and PepsiCo give the companies pricing power to be able to raise their prices as a result of higher costs. This is another strong competitive advantage both companies have in these times of high inflation when compared to competitors with lower strength in terms of brand value.
The fact that both companies have a large number of important brands in their product portfolio underlines the competitive advantages both companies have. PepsiCo, for example, has 23 brands in its product portfolio, each generating more than $1 billion in revenue. Coca-Cola’s product portfolio includes more than 200 brands (sodas, waters, coffees, teas, and juices, among others).
One important characteristic that distinguishes both companies is the fact that PepsiCo, in contrast to Coca-Cola, does not only operate in the beverage industry but also in the snack and food businesses industry, which gives the company more flexibility in the development of new products and the acquisition of new brands as well as higher opportunities for future growth.
The Valuation of Coca-Cola and PepsiCo
Discounted Cash Flow (DCF)-Model
In terms of valuation, I have used the DCF Model to determine the intrinsic value of Coca-Cola and PepsiCo. The method calculates a fair value of $47.91 for Coca-Cola and a fair value of $222.67 for PepsiCo. At the current stock price, this results in a downside of 23% for Coca-Cola and an upside of 29.6% for PepsiCo.
I assume a Revenue Growth Rate and EBIT Growth Rate of 3% for Coca-Cola over the next 5 years and a Revenue Growth Rate and EBIT Growth Rate of 5% for PepsiCo over the same period. Due to PepsiCo’s more diversified product portfolio (through operating not only in the beverage but also in the snack and food businesses), I expect PepsiCo to grow with slightly higher growth rates than Coca-Cola in the years to come. The GDP Growth Rate of the United States is about 3% per year on average. Therefore, I assume a Perpetual Growth Rate of 3% for Coca-Cola. Due to PepsiCo’s broad and diversified product portfolio in combination with its strong brand image, I expect PepsiCo to be able to grow slightly above the GDP Growth Rate in the future. Therefore, I assume a Perpetual Growth Rate of 4% for PepsiCo.
I have used Coca-Cola’s current discount rate (WACC) of 7.5% and PepsiCo’s current discount rate (WACC) of 6.5%. Furthermore, I calculate with an EV/EBITDA Multiple of 21.5x for Coca-Cola and an EV/EBITDA Multiple of 17.9x for PepsiCo. Both are the companies’ latest twelve months EV/EBITDA.
My calculations are based on the following assumptions as presented below (in $ millions except per share items):
|
Coca-Cola |
PepsiCo |
|
|
Company Ticker |
KO |
PEP |
|
Revenue Growth Rate for the next 5 years |
3% |
5% |
|
EBIT Growth Rate for the next 5 years |
3% |
5% |
|
Tax Rate |
21.2% |
20.1% |
|
Discount Rate (WACC) |
7.5% |
6.5% |
|
Perpetual Growth Rate |
3% |
4% |
|
EV/EBITDA Multiple |
21.5x |
17.9x |
|
Current Price/Share |
$62.19 |
$171.88 |
|
Shares Outstanding |
4,335 |
1,380 |
|
Debt |
$42,143 |
$39,279 |
|
Cash |
$7,681 |
$5,405 |
|
Capex |
$1,368 |
$4,819 |
Source: The Author
Based on the above assumptions, I calculated the following results (in $ millions except per share items):
Market Value vs. Intrinsic Value
|
Coca-Cola |
PepsiCo |
|
|
Market Value |
$62.19 |
$171.88 |
|
Upside |
-23% |
29.60% |
|
Intrinsic Value |
$47.91 |
$222.67 |
Source: The Author
Relative Valuation Models
Coca-Cola’s and PepsiCo’s P/E (FWD) Ratio
Coca-Cola’s P/E Ratio is currently 25.35, which is 29.13% above the sector median (19.63). This provides us with an indicator that the company is currently overvalued.
PepsiCo’s P/E Ratio is currently 20.3, being 3.4% above the sector median (19.63). At the same time, PepsiCo’s current P/E Ratio is 13.67% below the company’s average P/E Ratio of the last 5 years (23.51), which is an indicator that PepsiCo is currently undervalued.
Dividend Projections for Coca-Cola
Coca-Cola has been able to raise its dividend by 3.62% per year on average in the past five years. The company’s payout ratio is currently 70.25%, demonstrating the potential for future dividend enhancements. I expect the company to raise its dividend by about 3% per year on average in the years to come. Assuming that the company would continue to raise its dividend by about 3% per year in the next 30 years, we would see the following results for Coca-Cola’s dividend and dividend yield shown in the graphic below.
Projection of Coca-Cola’s Dividend and Dividend Yield Assuming a Dividend Growth Rate of 3% per Year on Average
Source: The Author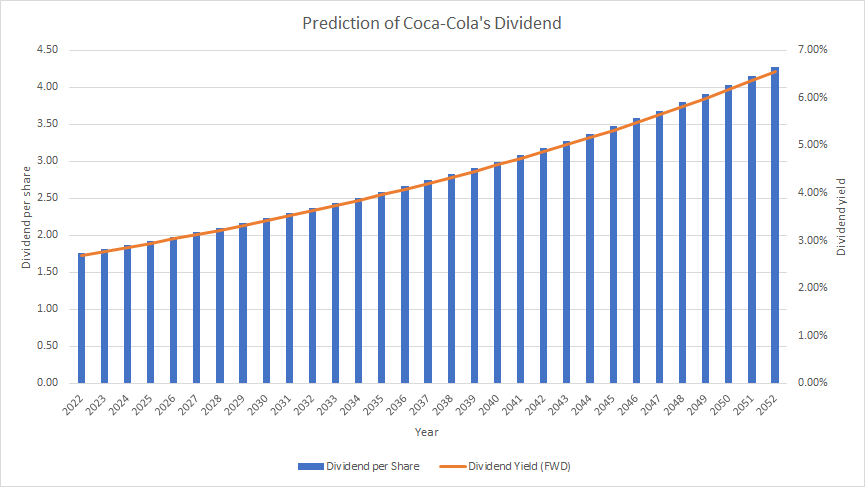
In the table below, you can find Coca-Cola’s accumulated dividend assuming a dividend growth rate of 3% per year in the next 30 years. Here you can see that after 20 years, you would have received 77.34% of your initial investment in the form of dividends (for simplification, no withholding tax has been taken into account).
Projection of Coca-Cola’s Accumulated Dividend Assuming a Dividend Growth Rate of 3% per Year on Average
|
Year |
Dividend per Share |
Dividend Yield (FWD) |
Accumulated Dividend |
|
2022 |
1.76 |
2.70% |
2.70% |
|
2032 |
2.37 |
3.62% |
34.54% |
|
2042 |
3.18 |
4.87% |
77.34% |
|
2052 |
4.27 |
6.55% |
134.85% |
Source: The Author
Dividend Projections for PepsiCo
PepsiCo’s dividend growth rate in the last 5 years has been 7.39% on average. In the following, I will make more conservative assumptions assuming that PepsiCo will be able to hike its dividend by about 4% per year on average in the next 30 years. Below you can find the results of PepsiCo’s dividend if you were to invest in PepsiCo at the company’s current stock price.
Projection of PepsiCo’s Dividend and Dividend Yield Assuming a Dividend Growth Rate of 4% per Year on Average
Source: The Author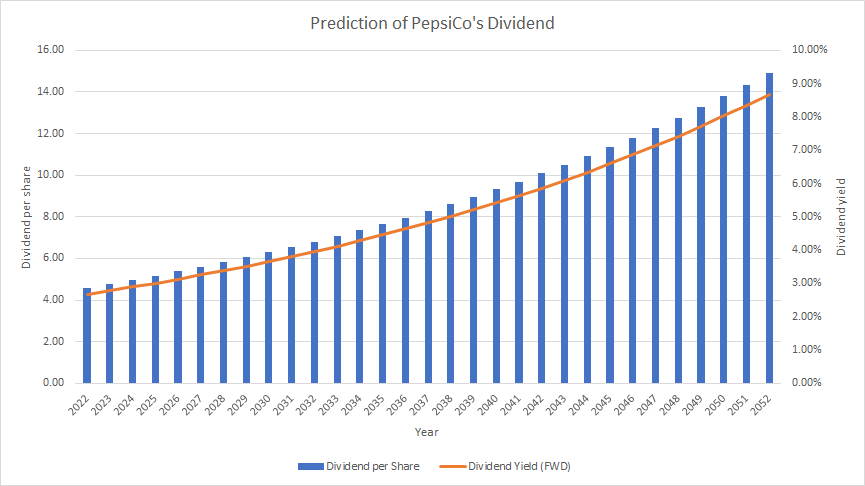
Below you can find the results of PepsiCo’s accumulated dividend when assuming a dividend growth rate of 4% per year on average. In 2042, you would have received 85.56% of your initial investment in the form of dividends (for simplification, again, no withholding tax has been included in the calculation).
In 30 years, your dividend yield for PepsiCo would be 8.68% (assuming a dividend growth rate of 4% for PepsiCo), and the accumulated dividend would be 158.78%. In comparison to PepsiCo, the dividend yield for Coca-Cola would only be 6.55% (assuming a dividend growth rate of 3% for Coca-Cola), and the accumulated dividend would be 134.85% (as shown in the previous section) after 30 years.
Projection of PepsiCo’s Accumulated Dividend Assuming a Dividend Growth Rate of 4% per Year on Average
|
Year |
Dividend per Share |
Dividend Yield (FWD) |
Accumulated Dividend |
|
2022 |
4.60 |
2.68% |
2.68% |
|
2032 |
6.81 |
3.96% |
36.09% |
|
2042 |
10.08 |
5.86% |
85.56% |
|
2052 |
14.92 |
8.68% |
158.78% |
Source: The Author
The results of the dividend projections for Coca-Cola and PepsiCo confirm that it is currently slightly more attractive to invest in PepsiCo than in Coca-Cola. Below you can find a financial overview of Coca-Cola and PepsiCo.
Financial Overview: Coca-Cola vs. PepsiCo
|
Coca-Cola |
PepsiCo |
|
|
Sector |
Consumer Staples |
Consumer Staples |
|
Industry |
Soft Drinks |
Soft Drinks |
|
Market Cap |
271.68B |
235.71B |
|
Revenue |
40.13B |
80.85B |
|
Revenue Growth 5 Year (CAGR) |
-0.28% |
5.28% |
|
EBITDA |
13.16B |
14.59B |
|
EBIT Margin |
29.28% |
14.66% |
|
ROE |
42.06% |
54.61% |
|
P/E GAAP (FWD) |
25.35 |
20.30 |
|
Dividend Yield (FWD) |
2.81% |
2.71% |
|
Dividend Growth 3 Yr (CAGR) |
2.87% |
5.39% |
|
Dividend Growth 5 Yr (CAGR) |
3.62% |
7.39% |
|
Payout Ratio |
70.25% |
67.62% |
|
Consecutive Years of Dividend Growth |
59 Years |
50 Years |
|
Dividend Frequency |
Quarterly |
Quarterly |
Source: Seeking Alpha
The High-Quality Company (HQC) Scorecard
“The aim of the HQC Scorecard that I have developed is to help investors identify companies which are attractive long-term investments in terms of risk and reward.” Here you can find a detailed description of how the HQC Scorecard works.
Overview of the Items on the HQC Scorecard
In the graphic below, you can find the individual items and weighting for each category of the HQC Scorecard. A score between 0 and 5 is given (with 0 being the lowest rating and 5 the highest) for each item on the Scorecard. Furthermore, you can see the conditions that must be met for each point of every rated item.
Source: The Author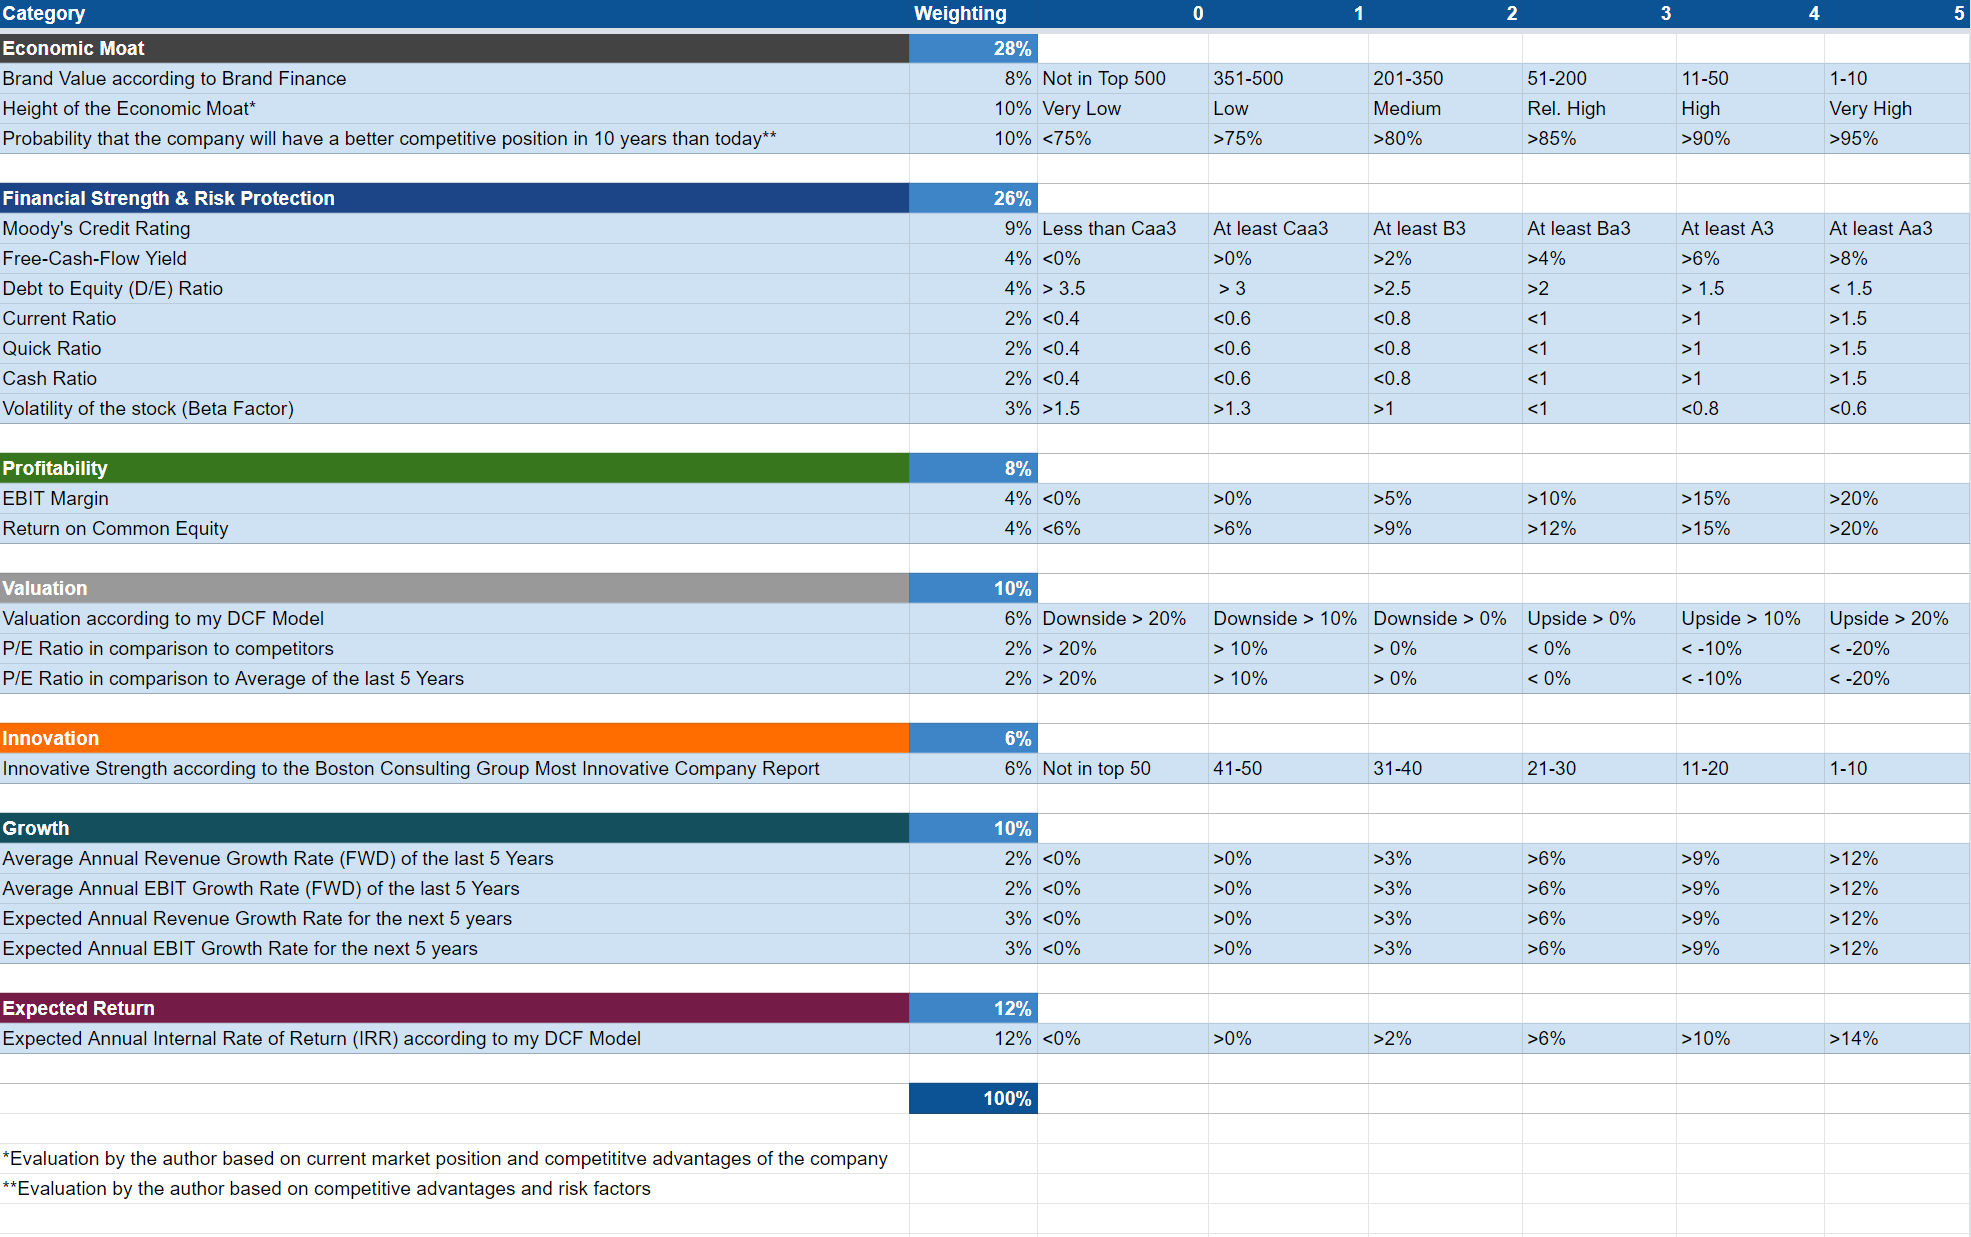
Coca-Cola and PepsiCo According to the HQC Scorecard
Source: The Author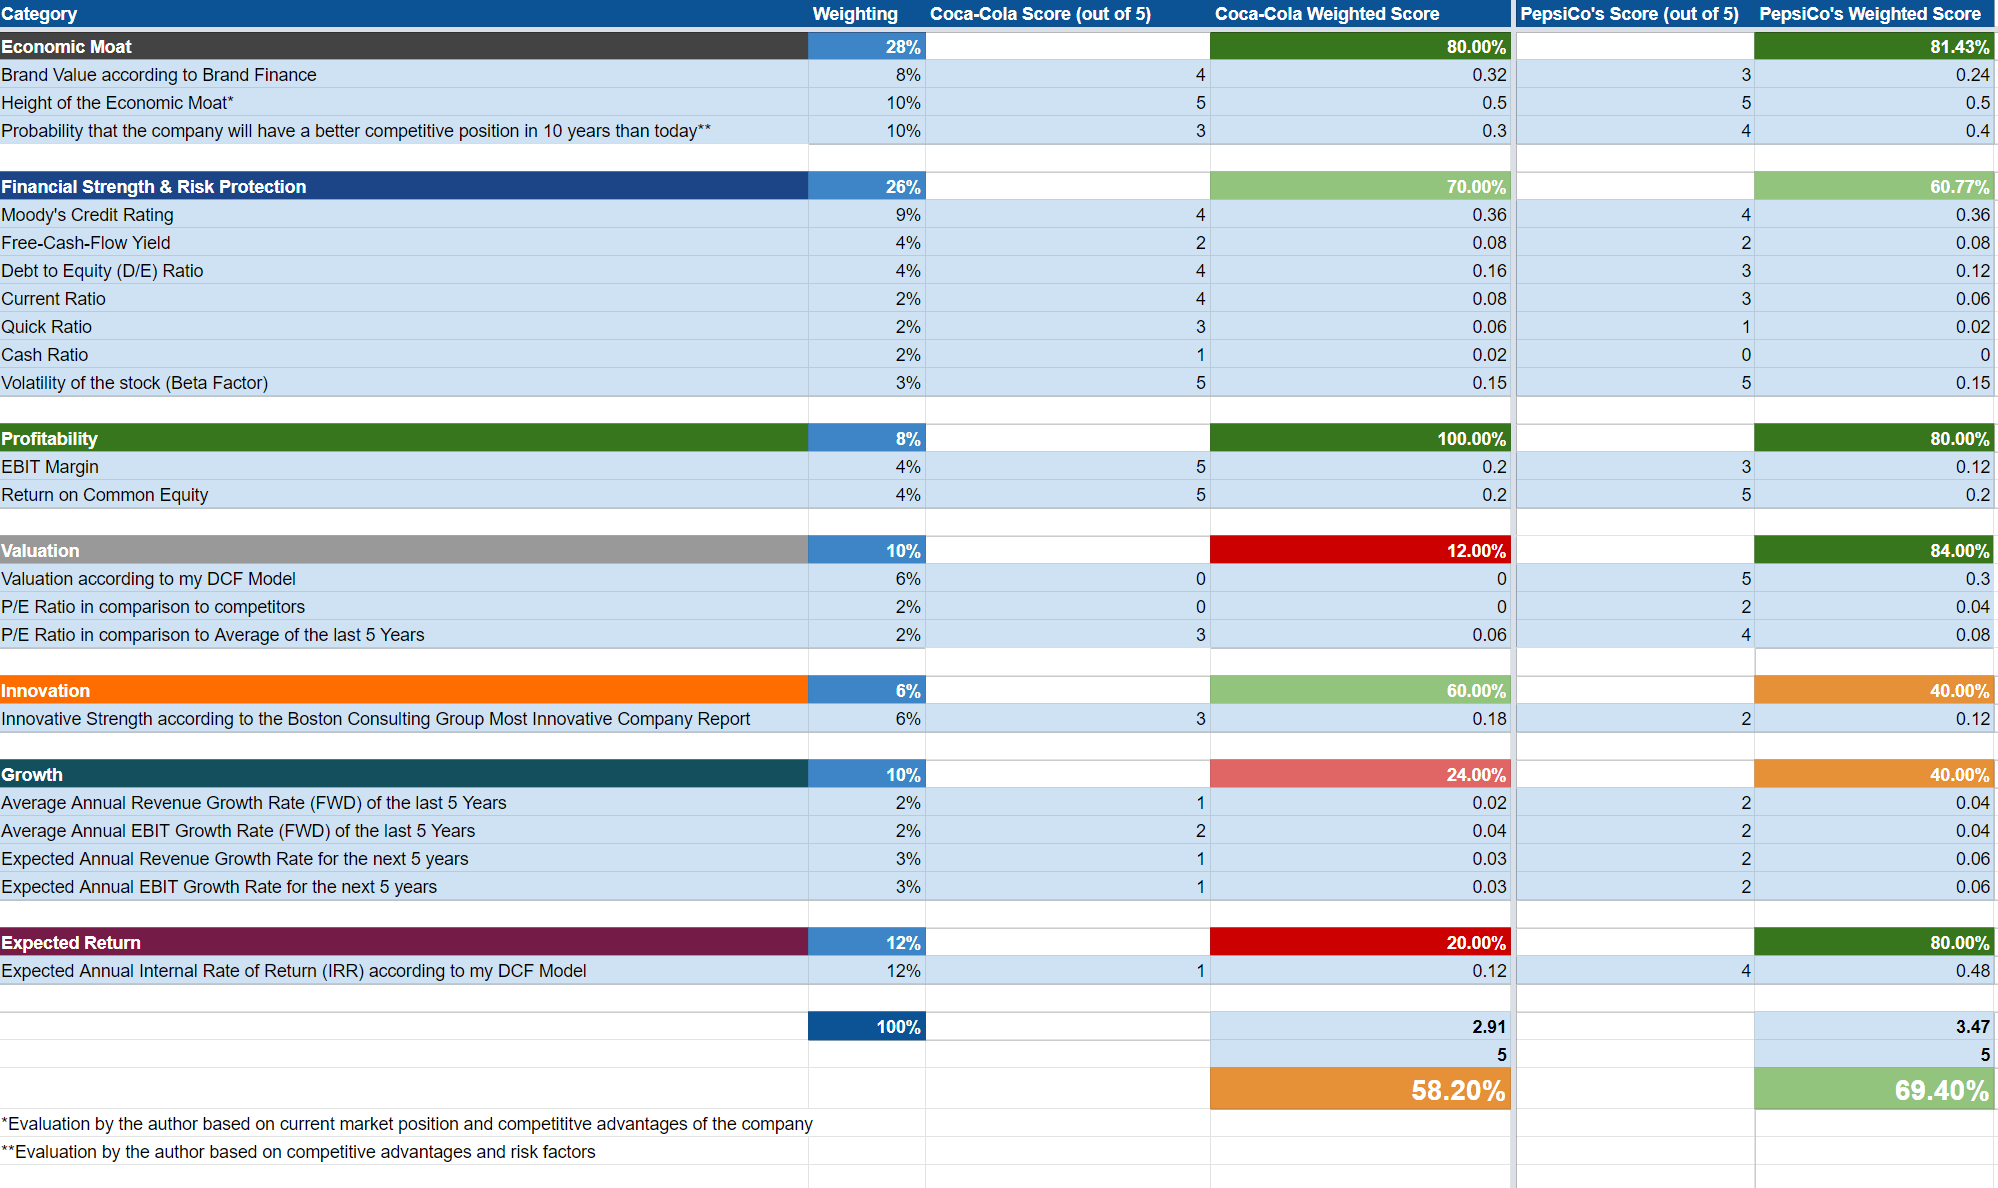
According to the HQC Scorecard, the overall score of Coca-Cola is 58 out of 100 points. This means that Coca-Cola can currently be classified as a moderately attractive investment in terms of risk and reward.
PepsiCo’s overall score is 69 out of 100 points. This scoring indicates an attractive rating for PepsiCo in terms of risk and reward.
Both companies are rated as very attractive in the categories of Economic Moat and Profitability. PepsiCo’s rating in comparison to Coca-Cola is significantly higher in the Valuation, Growth, and Expected Return categories.
Coca-Cola’s moderately attractive rating in terms of risk and reward according to the HQC Scorecard reinforces my belief that the company is currently a hold. The company shows very low scorings in terms of Valuation and Expected Rate of Return.
PepsiCo’s attractive scoring in terms of risk and reward according to the HQC Scorecard strengthens my belief that the company can currently be considered a buy, particularly because of its very attractive rating in the Economic Moat, Profitability, Valuation, and Expected Return categories.
The higher scoring of PepsiCo in comparison to Coca-Cola according to the HQC Scorecard strengthens my belief that PepsiCo is currently the more attractive investment choice when comparing both companies.
Coca-Cola and PepsiCo According to Seeking Alpha’s Factor Grades
According to Seeking Alpha’s Factor Grades, both Coca-Cola and PepsiCo get a D rating in terms of Valuation and an A+ rating in terms of Profitability. In terms of Growth, PepsiCo gets a D+ while Coca-Cola gets a D-. This strengthens my belief that PepsiCo is currently slightly more attractive than Coca-Cola in terms of Growth. Below you can find the comparison between Coca-Cola and PepsiCo according to the Seeking Alpha Factor Grades:
Source: Seeking Alpha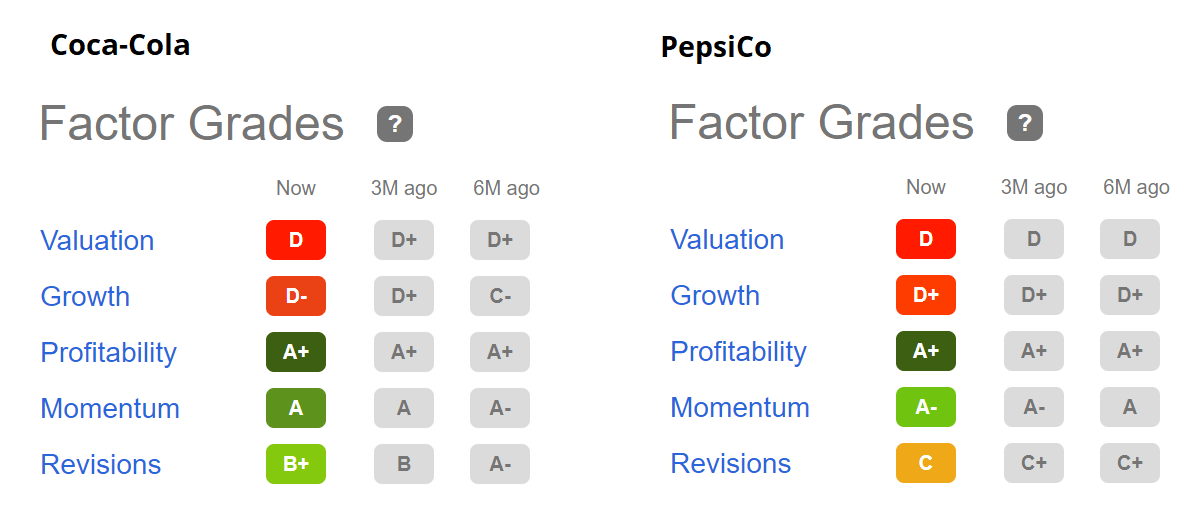
Coca-Cola and PepsiCo According to Seeking Alpha’s Quant Ranking
According to the Seeking Alpha Quant Ranking, Coca-Cola is slightly better positioned compared to its competitor PepsiCo. Within the sector, Coca-Cola is ranked 41st (while PepsiCo is ranked 53rd), and within the industry, Coca-Cola is ranked 5th while PepsiCo is 6th. Below you can find the results of the Seeking Alpha Quant Ranking:
Source: Seeking Alpha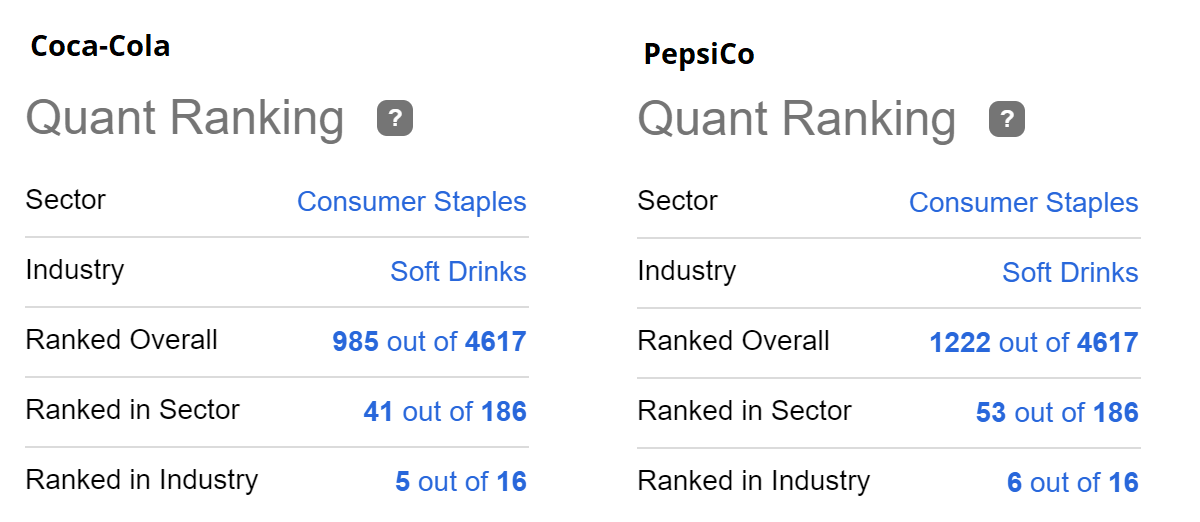
Coca-Cola and PepsiCo According to Seeking Alpha’s Dividend Grades
In terms of Dividend Consistency, both Coca-Cola and PepsiCo are rated A+ according to the Seeking Alpha Dividend Grades. In terms of Dividend Growth, both are rated A, and in terms of Dividend Yield, both get a C+. The difference between both companies exists only in the Dividend Safety category. Coca-Cola gets a B- while PepsiCo gets an A-. Below you can find the Seeking Alpha Dividend Grades for Coca-Cola and PepsiCo:
Source: Seeking Alpha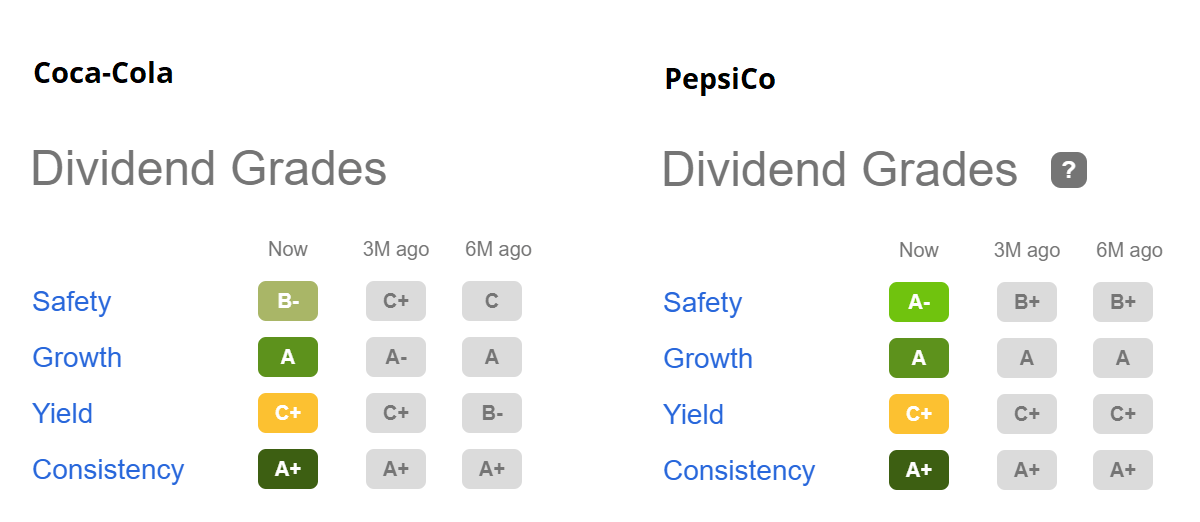
The Seeking Alpha Dividend Grades are a further indicator that an investment in PepsiCo is currently slightly more attractive than an investment in Coca-Cola.
Risks
From my point of view, one of the main risk factors for both Coca-Cola and PepsiCo would be their damaged brand image. In this case, their businesses and financial results could be affected significantly.
Among the companies’ competitors are Monster (NASDAQ:MNST), Red Bull, and Nestlé (OTCPK:NSRGY) (OTCPK:NSRGF), for example. All of them have also been able to establish relatively strong brand images over time. The competition could result in declining profit margins for Coca-Cola and PepsiCo.
Another risk factor I see for Coca-Cola and PepsiCo could be that the dividend could be cut in the future (for example, as a result of stagnant growth). However, since Coca-Cola currently has a payout ratio of 70.25% and PepsiCo has a payout ratio of 67.62%, I do not see this as a threat in the near future since there is still scope for future dividend enhancements for both companies.
In my view, there is not particularly much higher risk in investing in one company compared to the other. Nevertheless, when evaluating the risk, I would tend towards investing in PepsiCo rather than Coca-Cola since PepsiCo has a broader product portfolio (operating not only in the beverages sector like Coca-Cola).
Considering all these risk factors strengthens my opinion that I would currently invest in PepsiCo rather than Coca-Cola.
The Bottom Line
Different valuation methods underline that PepsiCo is currently more attractive than Coca-Cola: my DCF Models show that PepsiCo is currently undervalued with an upside of 29.6%, while Coca-Cola is currently overvalued with a downside of 23%.
Taking Relative Valuation Models such as the P/E Ratio into account, we get another indicator showing that Coca-Cola is currently overvalued while verifying that PepsiCo is more attractive at this moment in time.
I come to the same conclusion when taking into account the Seeking Alpha Dividend Grades. When considering the Seeking Alpha Dividend Grades to compare both companies, we can see that PepsiCo is slightly higher rated than Coca-Cola in terms of Dividend Safety. PepsiCo’s broader and more diversified product portfolio reinforces my belief that I would choose PepsiCo over Coca-Cola.
The HQC Scorecard also shows that PepsiCo is currently higher rated than Coca-Cola. While PepsiCo is rated as attractive in terms of risk and reward, Coca-Cola only reaches a moderately attractive score according to the Scorecard. The overall scoring of the HQC Scorecard is yet an additional indicator that strengthens my belief that PepsiCo is currently a buy while I rate Coca-Cola a hold.
Author’s Note:
Thank you very much for reading! If you have any questions regarding this analysis, feel free to leave a comment below!
Be the first to comment