

Editor’s note: Seeking Alpha is proud to welcome Radar Insights as a new contributor. It’s easy to become a Seeking Alpha contributor and earn money for your best investment ideas. Active contributors also get free access to SA Premium. Click here to find out more »

zhongguo/E+ via Getty Images
The future was already looking bright for cleantech and the Inflation Reduction Act (IRA) just gave a big extra boost to the theme. While most stocks are in a downtrend, the same cannot be said of the SPDR Kensho Clean Power ETF (NYSEARCA:CNRG). The Inflation Reduction Act (IRA) just gave a big extra boost to the cleantech theme. If we add on top of that a reasonable valuation, we have an ETF that we expect to perform and to do so without much perturbation from rising rates and/or an economic slowdown (or even a recession).
SPDR Kensho Clean Power ETF
SPDR Kensho Clean Power ETF seeks, according to the SPDR-website, to “track an index utilizing artificial intelligence and a quantitative weighting methodology to capture companies whose products and services are driving innovation behind the clean energy sector, which includes the areas of solar, wind, geothermal, and hydroelectric power.”
To give you an idea about which stocks it goes after, we give the 10 biggest names of the ETF in Table 1.
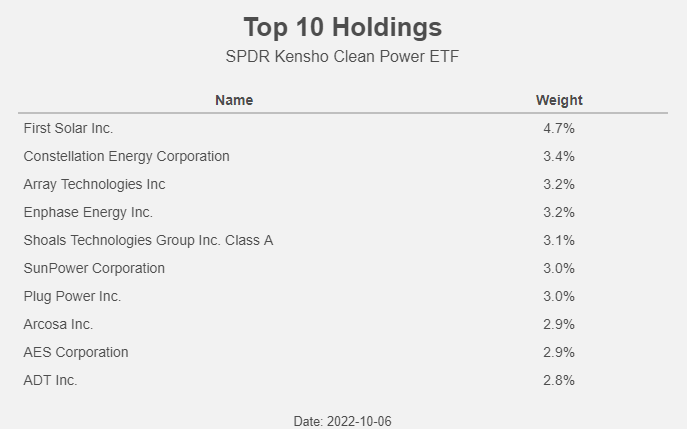
Table 1: Top 10 Holdings (SPDR, Author)
The best known name is probably Tesla (TSLA).
Green bubble
If we look back over a period that includes the COVID-crisis we see that cleantech massively outperformed the S&P 500 (that performed itself rather nicely if we compare it with equity indices around the world). It also outperformed the “traditional” energy sector (that moved more or less in lockstep with the oil price).
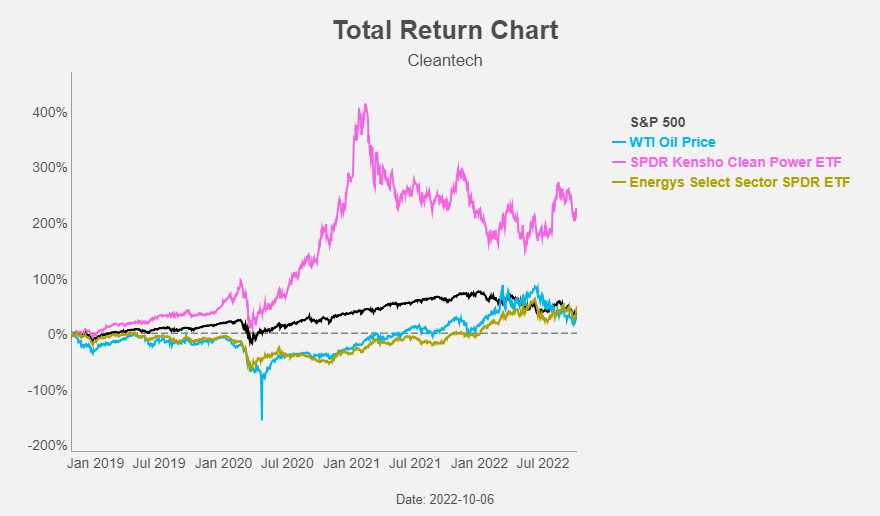
Figure 1: Total Return Chart (Yahoo! Finance, Author)
The incredible rise in cleantech stocks after the COVID crisis (even called the “Green bubble”) was partly driven by Wall Street’s SPAC frenzy (and we all know how that ended).
If we take the same chart but start at the top of the cleantech performance in February 2021, we get the opposite picture.
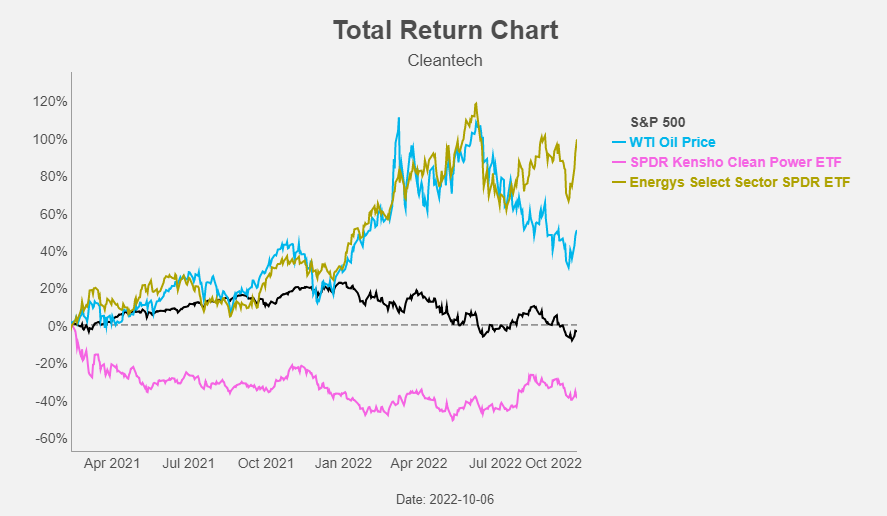
Figure 2: Total Return Chart (Yahoo! Finance, Author)
Cleantech underperformed the S&P 500 and the “old” energy sector outperformed the S&P 500. The energy sector kept moving in lockstep with the oil price. Or at least it did until recently…
The oil price started to decline in June and since the top in oil, the performance of energy stocks looks like this: cleantech again started to outperform the traditional energy stocks and the broader market – a trend we expect to continue.
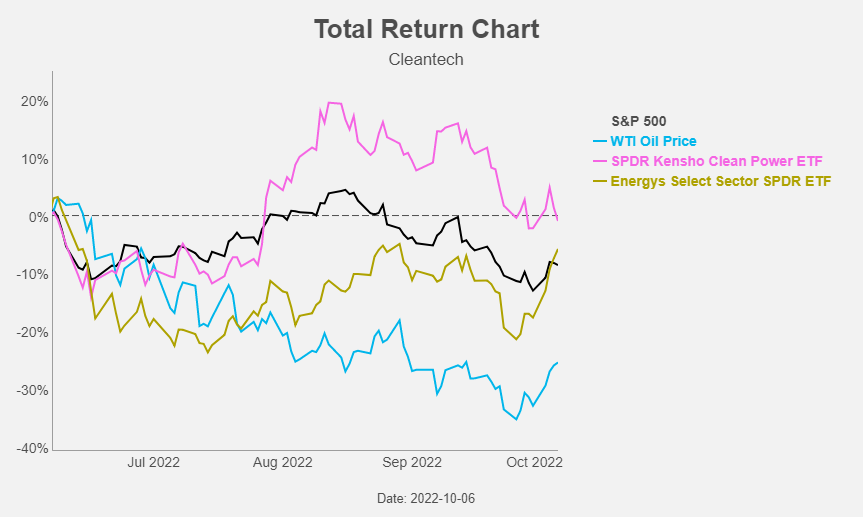
Figure 3: Total Return Chart (Yahoo! Finance, Author)
Valuation
Two years ago cleantech was valued in line with the S&P 500 on a forward P/E basis. One year later cleantech was twice as expensive as the S&P 500, as you can see on the following chart from the Financial Times.
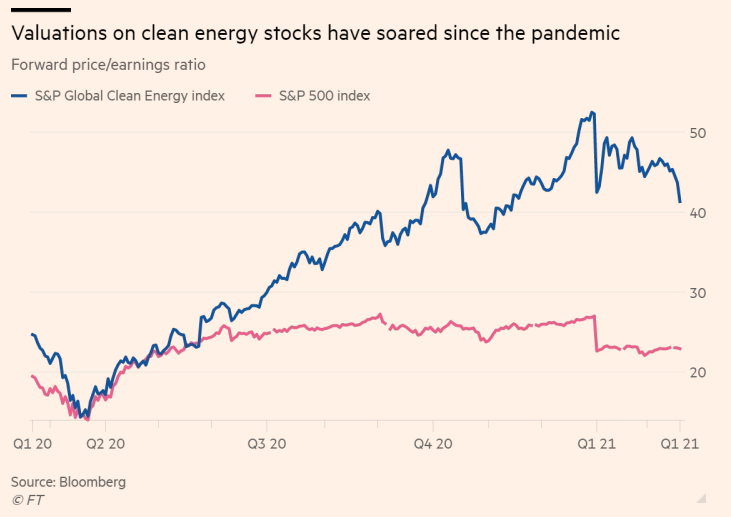
Figure 4: Valuation chart (Financial Times)
After the popping of the green bubble, cleantech’s valuation came back to earth and as we speak the valuation is once again in line with the broader market.
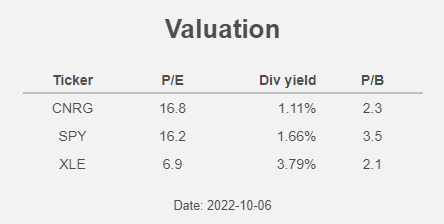
Table 2: Valuation (SPDR, Author)
Ready for a new take-off? IRA could well be the match that ignites the fireworks.
Inflation Reduction Act
The world is on its way to a life without fossil fuels and the Inflation Reduction Act (IRA) just gave a big extra boost to the theme. The Inflation Reduction Act will: “Build American clean energy supply chains, by incentivizing domestic production in clean energy technologies like solar, wind, carbon capture, and clean hydrogen.”
Some numbers: IRA wants to build a clean energy economy by powering homes, businesses, and communities with much more clean energy by 2030, including:
- 950 million solar panels,
- 120,000 wind turbines and
- 2,300 grid-scale battery plants.
This looks like a major inflection point for clean energy markets, creating even more of a tailwind for the fast-growing cleantech companies.
Follow the trend
We’ll try now to explain our trend-screening approach by taking a look at the equity market from a sector point of view.
We use the following Select Sector SPDR ETFs in our screening:
- Communication Services (XLC)
- Consumer Discretionary (XLY)
- Consumer Staples (XLP)
- Energy (XLE)
- Financials (XLF)
- Health Care (XLV)
- Industrials (XLI)
- Materials (XLB)
- Real Estate (XLRE)
- Technology (XLK)
The Select Sector SPDR ETFs divide the S&P into eleven index funds.
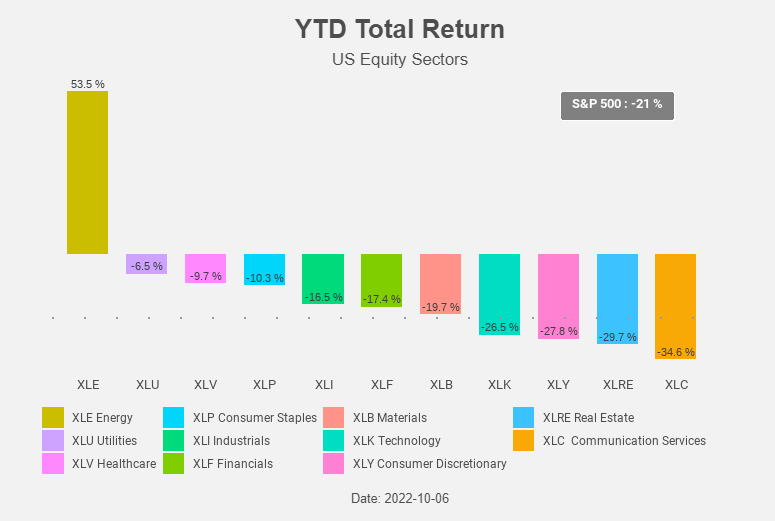
Figure 5: YTD Total Return (Yahoo! Finance, Author)
If we look back even longer over a period that includes the COVID crisis we see that Technology is still in the lead and that Energy is no longer the worst performing sector (which it was for quite some time).
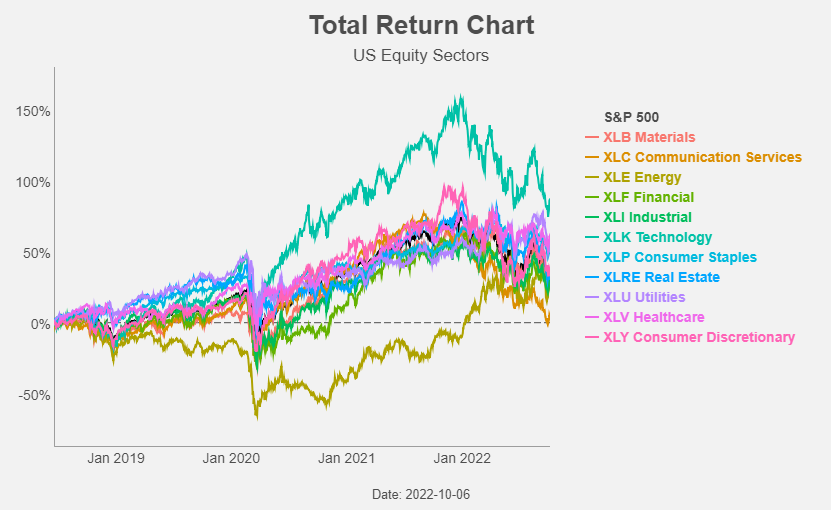
Figure 6: Total Return Chart (Yahoo! Finance, Author)
Table 3 gives an overview of the performance of the US equity sectors (sorted by YTD total return).
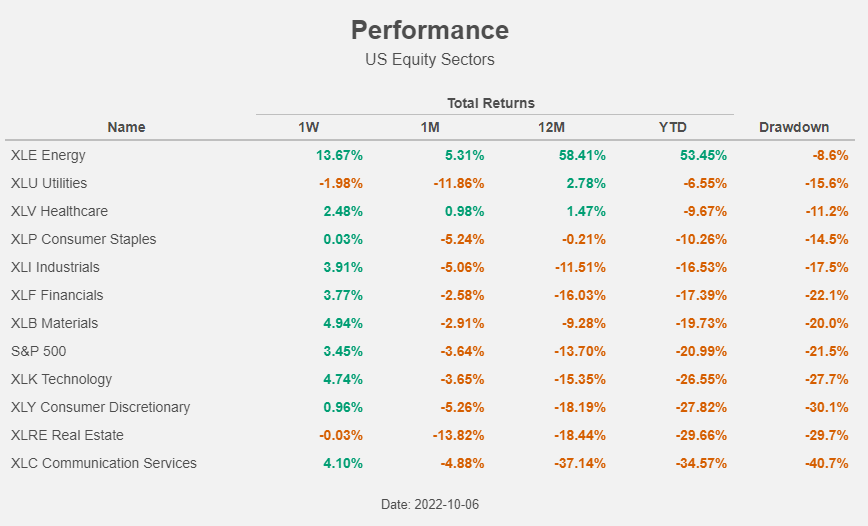
Table 3: Performance (Yahoo! Finance, Author)
According to Paul Tudor Jones, “80% of portfolio performance is determined by the underlying trend“. It comes as no surprise that “Follow the trend” is one of his investment rules.
With this knowledge in mind we created a long-term trend indicator (LT trend). We also tried to turn this indicator into a nice visualization.
When the LT trend is clearly up, we get a green light/color. Vice versa, when the LT trend is clearly down, we see a red light/color. In between, the color is orange.
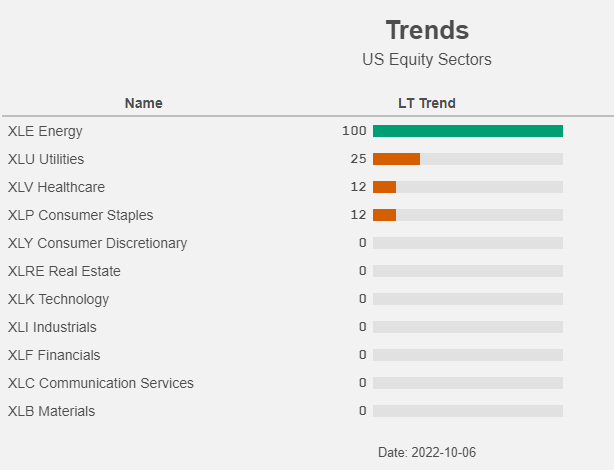
Table 4: LT trend (Yahoo! Finance, Author)
Please note that, according to our analysis, only one sector is in a clear up-trend: Energy.
And yet another of Tudor Jones’ rules goes like this: “The Odds Of Success Improve Greatly When Technical Analysis Supports Fundamental Analysis”. Applying a technical overlay to determine the “when” to invest can significantly improve the return and control the risk of the “what” fundamental analysis uncovers.
The below figure from Macquarie shows in a stylized way clearly the difference between fundamental investors and trend investors/followers.
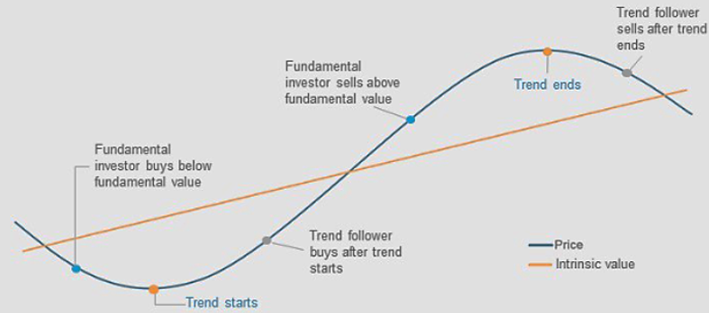
Figure 7: Fundamental investors vs trend followers (Macquarie)
While we are convinced that it is important to buy something below intrinsic value we also think that looking at the trend can help avoiding value traps. Sometimes an investment that is undervalued compared to its intrinsic value (which is always an estimation) turns out to be cheap for a reason and, with hindsight, the intrinsic value was too optimistic. Looking at the trend can give additional information and support your fundamental analysis.
We also developed a more technical short-term (ST) trend indicator, that indicates if an investment is over-bought or over-sold. We think that if one considers selling an investment, it can add to your investment returns if you wait to sell until one reaches overbought territory. And vice versa, we think it’s a good idea to buy something when it is in oversold territory – selling the strength and buying the dip.
When the ST trend is oversold (a value below 0), we get a green light/color. Vice versa, when the ST trend is overbought (a value above 100), we see a red light/color. In between the color is orange. Table 5 combines both trend indicators.
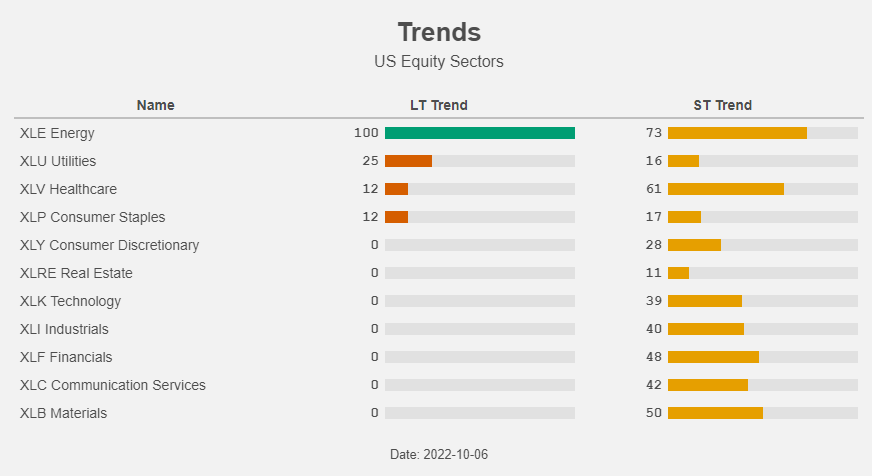
Table 5: Trends (Yahoo! Finance, Author)
Simple but not easy
Most stocks or ETFs oscillate between oversold and overbought, so a short-term investor/trader could use the ST trend indicator and buy an oversold stock or ETF in order to sell it when it moves to overbought territory.
A trend-following investor who doesn’t care about intrinsic value could solely use the LT trend indicator and simply buy stocks or ETFs in an up-trend.
That same trend follower could add the ST trend indicator to his toolkit and pick stocks or ETFs in an LT uptrend that are oversold (or have the lowest ST trend in case there are no oversold stocks or ETFs).
Buffett famously once said: “Investing is simple, but not easy”. One could indeed say: “It is simple! We select the stocks or ETFs that are in an uptrend and we wait until they are oversold. And we sell investments in a downtrend when they are overbought.”
Simply like that; you buy when both trend indicators are green and you sell when both trend indicators are red.
In reality it is of course not that easy. An investment is often overbought while it is in an uptrend and vice versa often oversold in a downtrend. Nevertheless we remain convinced that it is important to:
- look at both valuation and the trend and
- look at both the long term and the short term trend.
This way one can reach Tudor Jones’ last rule: “The Goal Of Portfolio Management Is A 70% Success Rate.” Portfolio management is not about always being right. It is about consistently getting “on base” that wins the long game. There isn’t a strategy, discipline, or style that will work 100% of the time. We sincerely hope our analysis and visualizations can help you reach that goal.
We included both our trend indicators also in the below chart to show their evolution through time.
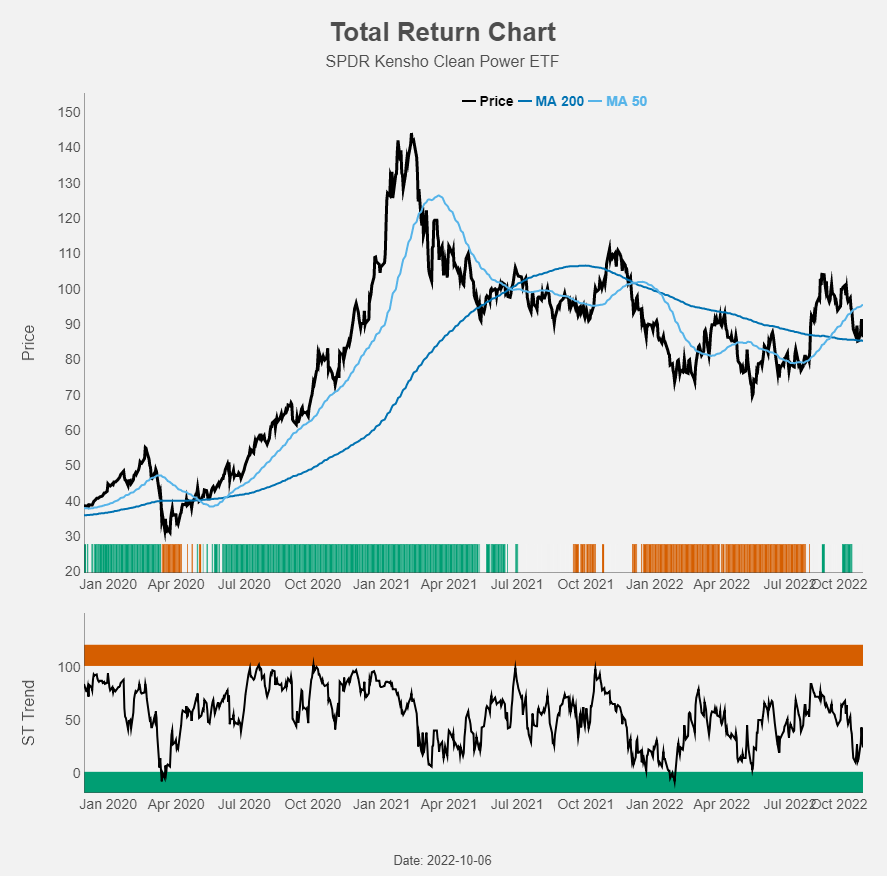
Figure 8: Total return chart (Yahoo! Finance, Author)
The ribbon in the price-part of the chart shows the LT trend color, while the lower part of the chart shows the ST trend. We left out the orange coloring to avoid overloading the chart.
Cleantech ETFs
We will now do the same trend screening exercise with the following 6 cleantech ETFs:
- ALPS Clean Energy ETF (ACES),
- Invesco Global Clean Energy Portfolio ETF (PBD),
- Invesco WilderHill Clean Energy Portfolio ETF (PBW),
- SPDR Kensho Clean Power ETF (CNRG),
- First Trust NASDAQ Clean Edge Green Energy Index ETF (QCLN) and
- iShares S&P Global Clean Energy Index ETF (ICLN).
YTD the best performing ETF is SPDR Kensho Clean Power ETF. Three ETFs are down, but outperforming the S&P 500, while the two Invesco ETFs are underperforming the S&P 500.
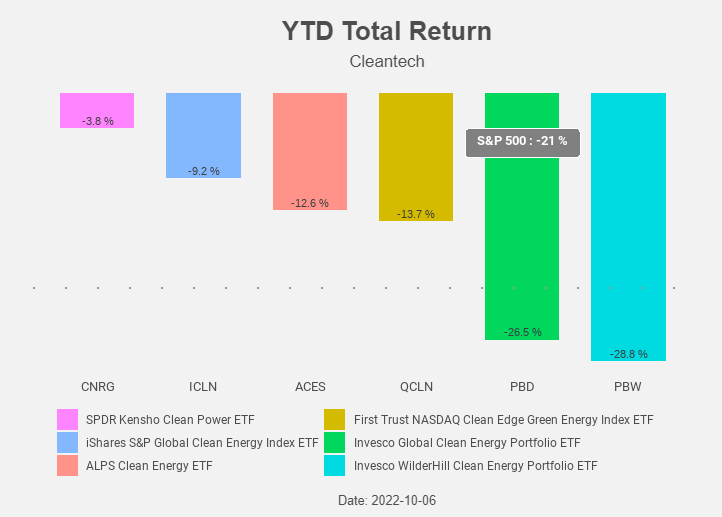
Figure 9: YTD Total Return (Yahoo! Finance, Author)
Table 6 gives an overview of the performance of the cleantech ETFs (sorted by YTD total return).
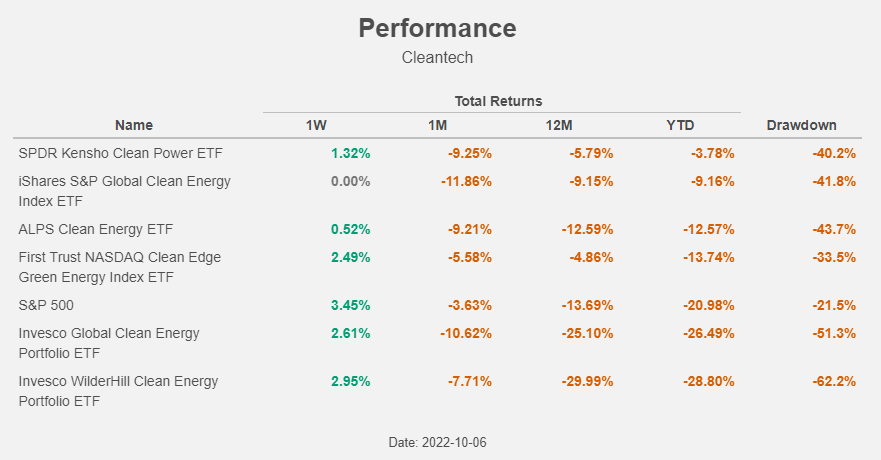
Table 6: Performance (Yahoo! Finance, Author)
Over a longer period, all six cleantech-ETFs massively outperformed the S&P 500. The outperformance peaked in the beginning of last year, like we saw before.
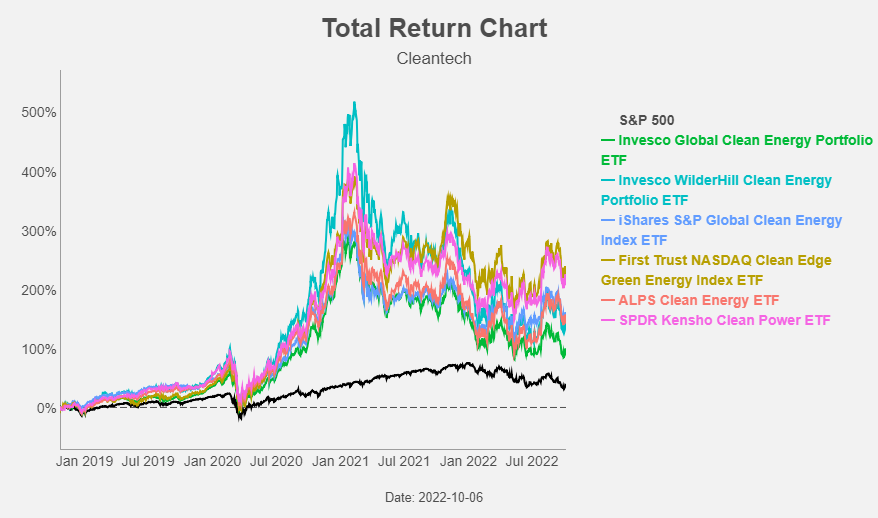
Figure 10: Total return chart (Yahoo! Finance, Author)
The best-performing ETFs over this longer period are First Trust NASDAQ Clean Edge Green Energy Index ETF (QCLN) and SPDR Kensho Clean Power ETF.
CNRG is currently the most interesting when we look at the LT trend.
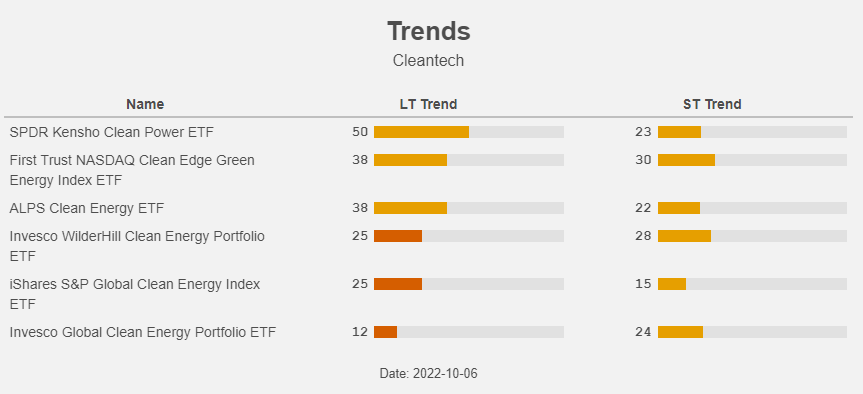
Table 7: Trends (Yahoo! Finance, Author)
CNRG also has a lower expense ratio: another reason for preferring CNRG above QCLN.
What could go wrong?
Like with other “tech” companies with a longer equity duration, strongly rising rates could lead to underperformance. But is this really the case for cleantech stocks? If we look at the performance during August and September (a period in which the US 10-year yield spiked) cleantech doesn’t seem to be really impacted.
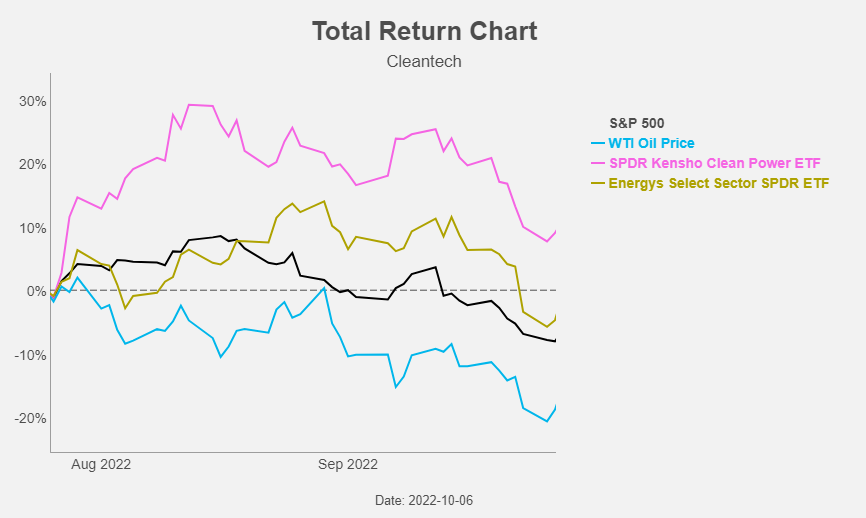
Figure 11: Total return chart (Yahoo! Finance, Author)
According to SPDR, the 36-month beta to the US 10-year rate is (only) 0.07 for CNRG (vs 0.36 for XLE).
The chances look rather slim with a slowing economy but oil prices could jump again and negatively impact cleantech stocks. This would most probably have a beneficial impact on the “old” energy stocks, but not necessarily a negative impact on Cleantech: the 36-month beta to oil is 0.23 for CNRG (vs 0.36 for XLE).
Conclusion
Only one sector is in a clear up-trend and up YTD: Energy. In the battle between “old” and “new” energy, we expect that capital will keep shifting from traditional oil and gas investments to low-carbon cleantech alternatives.
Since oil prices started to decline in June Cleantech is outperforming again and we expect this trend to continue. Within the “new” energy space our preference goes to the SPDR Kensho Clean Power ETF: it has a fairly low expense ratio and a reasonable valuation. It’s not in a downtrend like so many other stocks and oversold: a nice entry point!
This article provides opinions and information, but is not meant to be a recommendation or personal investment advice. Please do your own due diligence.
Be the first to comment