

MicroStockHub/iStock via Getty Images
Introduction
Although CNOOC (OTCPK:CEOHF) was delisted by the New York Stock Exchange after an executive order by President Trump became effective, this obviously doesn’t mean the company stopped existing. In fact, CNOOC’s primary listing on the Hong Kong Stock Exchange offers a very liquid listing for investors looking to gain exposure to one of the largest oil producers in the world.
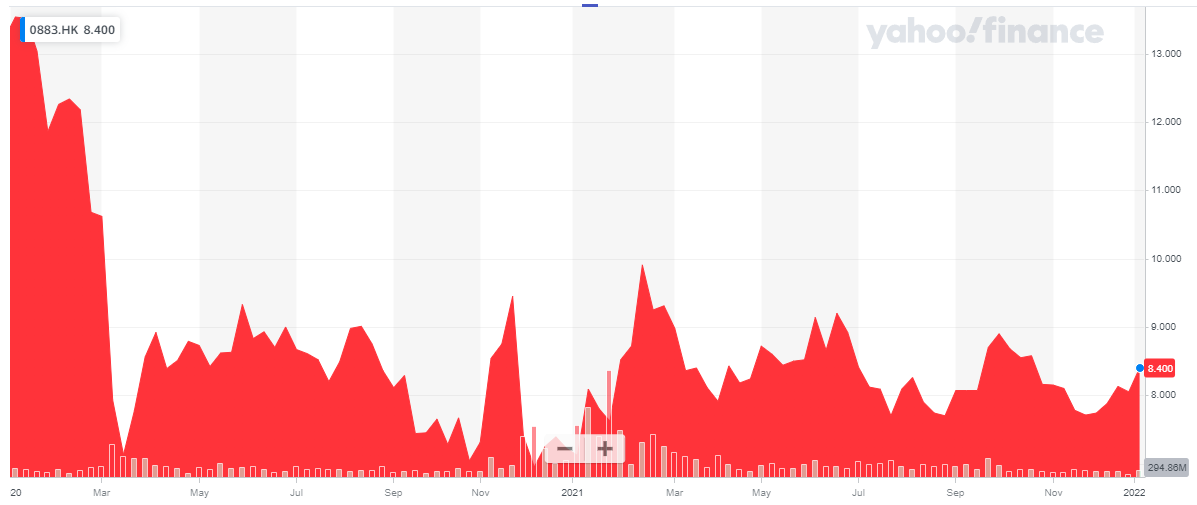
Source: Yahoo Finance
The ticker symbol on the HKSE is 0883, and with an average volume of in excess of 60 million shares per day, the monetary value is approximately 0.5B HKD which is approximately US$60M per day. CNOOC currently has a market capitalization of approximately 375B HKD which is approximately US$48B. The company reports its financial results in RMB and I will use that currency as base currency throughout this article. However, where applicable, I will use the HKD for any “per share” calculation as the stock is trading in Hong Kong Dollars. The current RMB/HKD exchange rate is 1.22. So 1 RMB is 1.22 HKD.
A closer look at the financial results in the first half of the year
Before moving over to the results in the third quarter, I wanted to take a minute to discuss the financial results in the first half of the year.
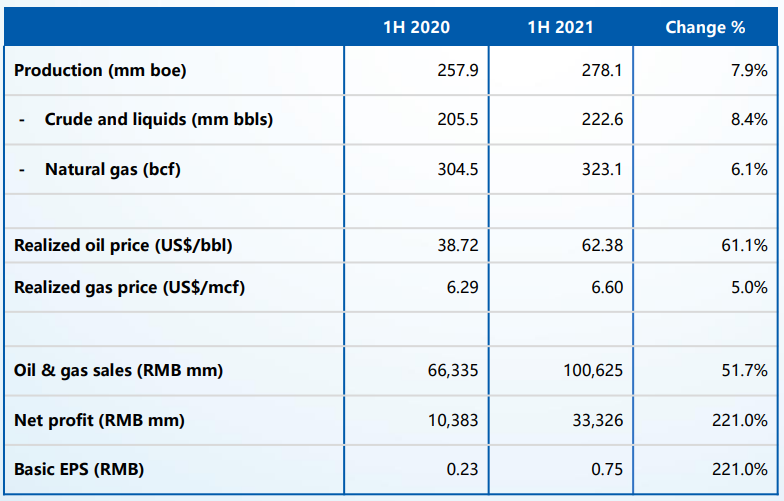
In the first half of the year, CNOOC produced just under 223 million barrels of oil and NGLs while it also produced 323 bcf of natural gas for a total oil-equivalent production of 278 million barrels. That’s an oil-equivalent production rate of 1.5 million barrels per day, of which about 1.2 million barrels were actually oil. This means that CNOOC produces in excess of 1% of the total world oil supply.
Source: company presentation
The oil was sold at an average price of $62.38/barrel while the gas price remained relatively high (but not unusually high) at $6.6/mcf.
This resulted in a total revenue of 100.6B RMB from the sale of oil and gas. The total revenue was actually 110B RMB as you can see in the image below, as CNOOC also earned some money from marketing products. The total operating expenses to produce a barrel of oil were just 12.7B RMB (which indeed means the pure production cost per barrel of oil is less than $8/barrel) while the total operating expenses came in at just under 65B RMB. And as you can see below, this includes 5B RMB in exploration activities that have been expensed rather than capitalized.
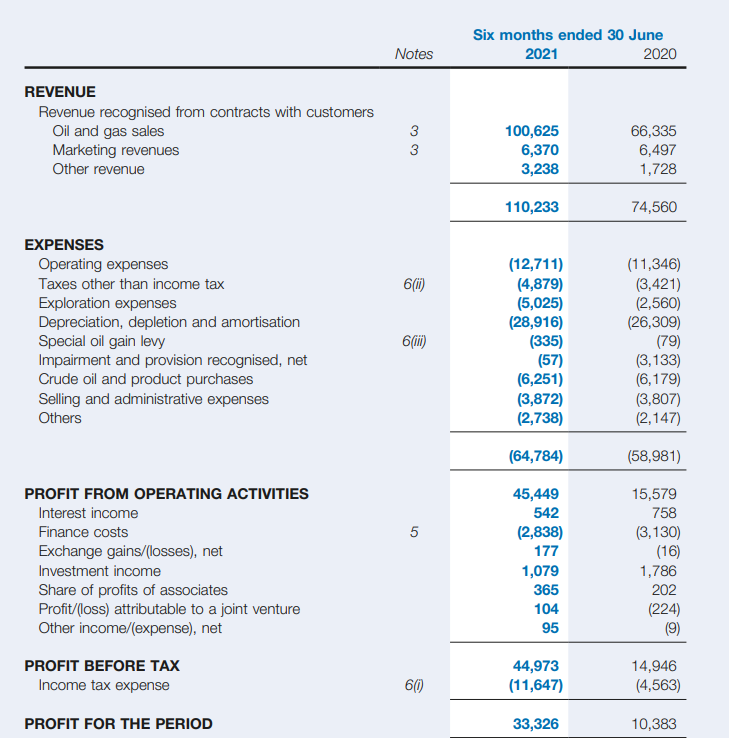
Source: half-year financial report
As CNOOC has a very clean balance sheet with very little debt, the company generates a pre-tax income of just under 45B RMB resulting in a net profit of 33.3B RMB. As there are 44.65B shares outstanding, the EPS was 0.75 RMB, or approximately 0.915 HKD.
Source: company presentation
Unfortunately the company’s cash flow statement doesn’t offer a lot of details in the interim report. According to the shortened version, the company generated about 23.6B RMB in free cash flow, but doesn’t provide a detailed breakdown of how the money was spent.
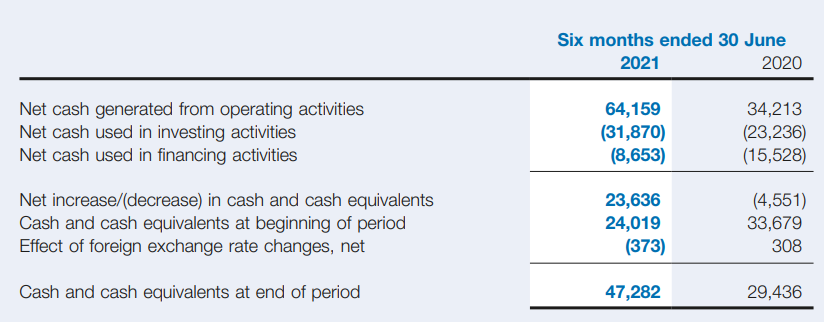
Source: half-year financial report
Fortunately one slide in the company’s H1 presentation offers a little bit more clarity. According to the image below, the operating cash flow was 64.2B RMB, the capex was 31.2B while the total amount of interest paid was 3.24B RMB. This would result in a free cash flow result (excluding debt repayment) of approximately 30B RMB. Of course this still doesn’t provide a whole lot of detail on for instance working capital changes and the potential difference between taxes owed and taxes due, but it looks like the free cash flow result is pretty much in line with the net income.
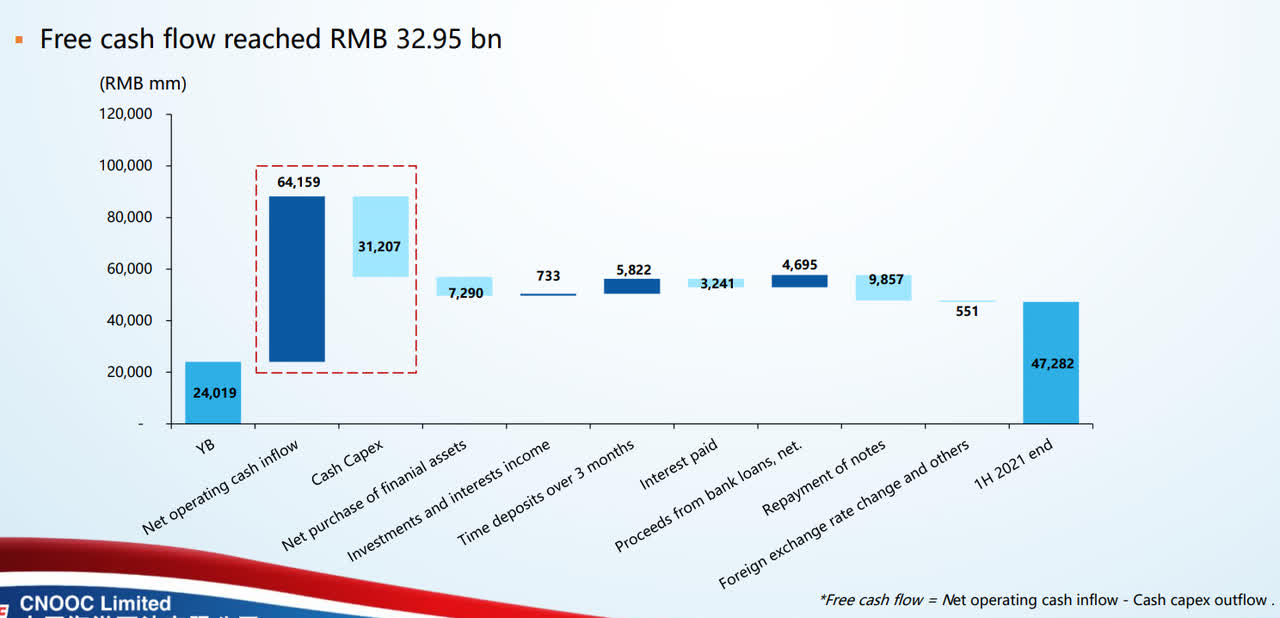
Source: company presentation
The cash flow will be pouring in now, and the company is on track to further grow its output
Now we have established the H1 operating cash flow, it’s an easier task to try to build the model for the entire financial year 2021. We know the production will be approximately the same in H2, but the oil price will likely be about 10-15% higher. If I’d budget for a 10% oil price increase and assume there’s a direct correlation with the H1 operating cash flow, we can expect the H2 operating cash flow to come in at approximately 67B RMB for a full-year cash flow result of approximately 128B RMB. That’s a rather conservative approach as we know the average realized prices in Q3 were $70.38 for oil and $7.08 for natural gas.
CNOOC has been guiding for a full-year capex of 90-100B RMB. That’s a bit on the higher end from what I would have expected as the total capex bill was just under 57B RMB in the first nine months of this year. To me the midpoint of this guidance, CNOOC would have to spend about 40B RMB in the final quarter of 2021. Not impossible, but I’d like to see confirmation of this first. And perhaps the company has also included its exploration expenses in the total investment guidance. That would not be 100% correct (as exploration “expenses” are not a “capital” expenditure), but it’s one item that I’m not entirely clear on.
In any case, even if CNOOC would spend 90B RMB on capital expenditures, the free cash flow result would be approximately 38B RMB in the current financial year. That would be 1.04 HKD per share.
I’d like to make two remarks here. First of all, the capex guidance is approximately 50% higher than the depreciation expenses. This means the capex budget contains quite a bit of growth capex. This also means the reported EPS will likely be much higher than the reported free cash flow. I’m expecting the full-year EPS to exceed 2 HKD, which would mean CNOOC is trading at less than 4.5 times its earnings.
The thesis the capex includes a substantial amount of growth capex seems to be confirmed by the company’s own three year production guidance. The production rate will increase by a high single digit percentage in both 2022 and 2023.
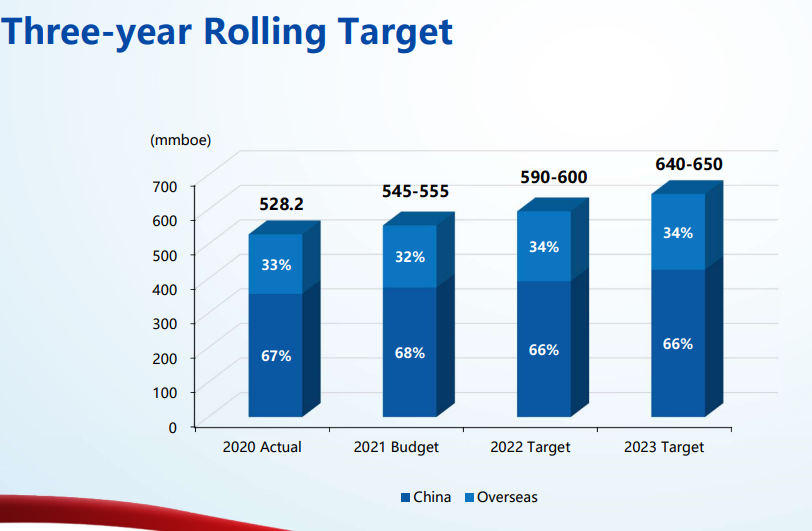
Source: company presentation
And this is where it gets interesting. The operating cash flow, using $65 oil and the official production guidance, would increase to approximately 160B RMB. If the sustaining capex would then come in at approximately 70B RMB (still higher than today’s depreciation rate), the underlying free cash flow result would be 90B RMB. That’s 2.45 HKD per share. This means the currently reported free cash flow clearly includes a substantial investment in production growth as CNOOC will be one of the key players to help China meet its oil and gas demands.
I also very much like the company’s balance sheet. As of the end of June, CNOOC had a net debt of approximately 55B RMB while it generated an EBITDA of about 75B RMB in just the first half of 2021. This means the debt ratio will likely be less than 0.4 times the full-year EBITDA and likely less than 0.3 times this year’s EBITDA.
Investment thesis
It is unfortunate CNOOC no longer has a primary listing in the US and I understand some people will object to investing in companies where the Chinese government and government affiliates have a majority stake.
But for those investors with a broader mindset and access to the Hong Kong Stock Exchange, CNOOC could still offer attractive exposure to the Asian and Chinese oil and gas markets. Using an oil price of $65 and the company’s own FY 2023 production guidance, it looks like the company is currently trading at less than 3.5 times its sustaining free cash flow in 2023. And that’s a good enough reason for me to pick up some stock despite the geopolitical risk of having the Chinese government as main shareholder.
CNOOC is expected to pay a dividend of 0.60 HKD per share over FY 2021 which would result in a dividend yield of approximately 7%. The withholding tax rate should be 10%. Meanwhile, the majority of the incoming cash flow is reinvested in production growth.
Be the first to comment