

1111IESPDJ/iStock via Getty Images
By Aram Green | Jeffrey Russell
Earnings Pain Already Reflected in Small Growth Stocks
Market Overview
English teachers often emphasize the power of alliteration. With that in mind, the primary influence afflicting the stock market this year has been the rapid, relentless rise of risk-free (interest) rates. Since the end of 2021, the yield on the two-year U.S. Treasury note ascended speedily from 0.73% to 4.15%, marking a dramatic change in financial conditions.
Given policy options during the pandemic’s early days, the government chose to employ ample fiscal and monetary stimulus. In hindsight, those socially useful policies were kept in place for far too long, resulting in the highest price inflation in half a century, and now being dealt with by the Federal Reserve’s interest rate moves. The war in Ukraine has further exacerbated price disruptions for energy and a host of other commodities.
The upward ratcheting of interest rates has already slowed economic activity significantly. However, despite the fact that U.S. labor availability remains a challenge for many employers, we have begun to see indications that supply chain disruption pressures are ebbing and the positive effects of the dollar’s strength in helping cut the cost of imports.
Interestingly, the small cap growth marketplace marked time during the third quarter, as the Russell 2000 Growth Index rose a modest 0.24%. Stock multiples had already declined sharply (Exhibit 1) with the Russell 2000 Growth Index’s forward 2022 earnings multiple down from over 40x early in the year to 27x.
Exhibit 1: Small Growth Multiples Have Collapsed
Data as of Sept. 30, 2022. Source: FactSet. NTM is next 12 months price to earnings ratio for companies in the Russell 2000 Growth Index.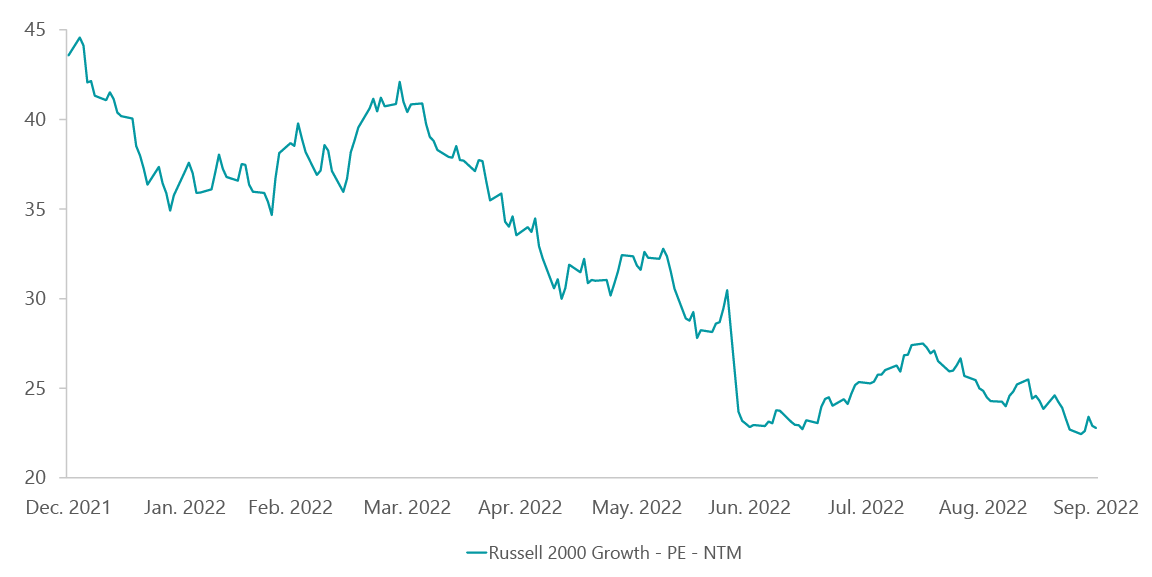
We are now in the phase of the economic cycle where earnings expectations and growth rates are also declining. Profit margins have already been squeezed by a variety of elevated cost factors and, in some cases, taken step functions lower. While companies have implemented multiple price increases to help offset rising costs, there will inevitably be future “sticker shock” effects.
Growth indices outperformed value during the third quarter, as value stocks arguably have greater operating earnings risk given their inherently greater economic cyclicality and particularly those who have been subjected to the COVID-19 “tough comps” derating. However, the ClearBridge Small Cap Growth Strategy underperformed its Russell 2000 Growth benchmark during the period, declining about 1.0%.
Our holdings in the health care sector proved the primary performance detractors during the quarter.
Contract research company Syneos Health (SYNH) was hurt by a volatile period for its biopharmaceutical customers, with bookings falling below forecasts as some of the company’s larger clients pushed out certain clinical trials. Certara (CERT), a provider of biosimulation and regulatory services to life sciences companies, suffered from execution issues in its smaller regulatory services division which brought down earnings guidance as well as a subsequent secondary sale by legacy private equity shareholders. Azenta (AZTA), another provider to laboratories and clinical research, was also hurt by the weak demand environment.
On the positive side, technology and consumer names drove performance. Warehouse retailer BJ’s Wholesale Club (BJ) delivered second-quarter results that topped forecasts on better than expected same-store sales and expense controls. While the company faced similar merchandise inflationary pressures as other retailers, the impact to its margins was offset by benefits in gasoline profitability and BJ’s lower mix of general merchandise.
Additionally, software holdings Model N (MODN), which helps health care and technology companies manage their revenues and expenses, and Aspen Technology (AZPN), which is seeing robust growth in its optimization solutions for the energy sector, were also significant contributors.
Portfolio Positioning
We made five changes during the quarter. On the buy side, we added Intra-Cellular Therapies (ITCI), a biopharmaceutical company whose FDA approved drug, Caplyta, is used to help treat schizophrenia and bipolar disease. ITCI is pursuing additional indications for the drug in treating major depressive disorder, which would likely increase sales and the long-term value of the company. We believe ITCI has sufficient capital to sustain the investment needed to propel the growth of Caplyta.
We also purchased Matador Resources (MTDR), an independent oil and natural gas producer with primary acreage assets in the Delaware Basin of west Texas and southern New Mexico. Matador has high-quality acreage (as measured by well productivity,) as well as a history of very productive, lower risk acquisitions through transactions including acreage swaps for drilling and production efficiency. The result is a substantial portfolio, with an estimated 20 years’ worth of drilling opportunities.
In addition, we added to several existing positions as the decline in prices during the quarter created compelling entry points for further investment, most notably in PayCor HCM (PYCR) in the information technology (IT) sector and Aerojet Rocketdyne (AJRD) in the industrials sector.
On the sell side, we eliminated three names from the portfolio. Health care data and analytics provider Health Catalyst (HCAT) has struggled with management turnover and a client base of health systems stressed by pandemic labor shortages.
Hydrofarm (HYFM), which manufactures and distributes agriculture equipment and systems, has seen its share price fall since its IPO in late 2020 as demand for its products has declined. Finally, survey software Momentive Global (MNTV, which markets under the SurveyMonkey brand) has seen disappointing business trends in its core survey business concurrent with its failed merger with Zendesk (ZEN).
Outlook
Markets are always forward looking. As recent comments out of the Federal Reserve suggest a steely determination to bend inflation expectations, the likelihood of a recession is already well appreciated by investors. The severity and duration of the slowdown/recession and the prospect of peak inflation rates will dictate, at least partly, equity market returns over the foreseeable few quarters. Valuations are now much more reasonable than at any time in the past few years and most sentiment indicators are bearish.
We continue to focus on constructing a concentrated portfolio of growth businesses, assessing the competitive advantages and managerial competence of each holding as we engage in derisking due diligence. We believe our emphasis on quality and durable growth stocks will benefit our clients as the macro headwinds begin to clear, and we thank you for your continued confidence amidst such challenging equity market conditions.
Portfolio Highlights
The ClearBridge Small Cap Growth Strategy underperformed its benchmark in the third quarter. On an absolute basis, the Strategy posted gains in four of the nine sectors in which it was invested (out of 11 sectors total). The primary contributors to performance were in the consumer discretionary and IT sectors. The main detractor was the health care sector.
Relative to the benchmark, overall stock selection and sector allocation detracted from performance. In particular, stock selection in the health care sector had the most negative impact on results while stock selection in the industrials and financials sectors and an overweight to the consumer staples sector also hurt. On the positive side, stock selection in the IT, consumer discretionary, consumer staples and communication services sectors contributed to performance.
On an individual stock basis, the leading contributors were positions in Penumbra (PEN), BJ’s Wholesale Club, Wingstop (WING), Xometry (XMTR) and Model N. The primary detractors were Syneos Health, Azenta, Certara, Integra LifeSciences (IART) and Trex (TREX).
|
Past performance is no guarantee of future results. Past performance is no guarantee of future results. Copyright © 2022 ClearBridge Investments. All opinions and data included in this commentary are as of the publication date and are subject to change. The opinions and views expressed herein are of the author and may differ from other portfolio managers or the firm as a whole, and are not intended to be a forecast of future events, a guarantee of future results or investment advice. This information should not be used as the sole basis to make any investment decision. The statistics have been obtained from sources believed to be reliable, but the accuracy and completeness of this information cannot be guaranteed. Neither ClearBridge Investments, LLC nor its information providers are responsible for any damages or losses arising from any use of this information. Performance source: Internal. Benchmark source: Russell Investments. Frank Russell Company (“Russell”) is the source and owner of the trademarks, service marks and copyrights related to the Russell Indexes. Russell® is a trademark of Frank Russell Company. Neither Russell nor its licensors accept any liability for any errors or omissions in the Russell Indexes and/or Russell ratings or underlying data and no party may rely on any Russell Indexes and/or Russell ratings and/or underlying data contained in this communication. No further distribution of Russell Data is permitted without Russell’s express written consent. Russell does not promote, sponsor or endorse the content of this communication. |
Editor’s Note: The summary bullets for this article were chosen by Seeking Alpha editors.
Be the first to comment