

ChrisBoswell/iStock via Getty Images
Introduction
Civitas Resources (NYSE:CIVI) is Colorado’s first carbon-neutral oil and gas producer concentrated in Colorado’s Wattenberg Field of the Denver-Julesburg Basin, called the DJ Basin. The company owns some of its midstream infrastructures as well.
CIVI Midstream (CIVI Presentation)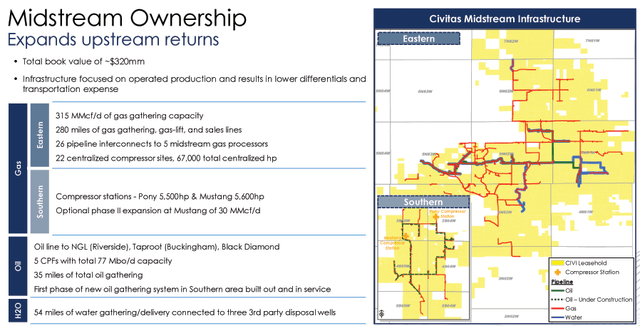
Last year, Bonanza Creek Energy rebranded as Civitas Resources through the consolidation of fellow D-J Basin operators, first the all-stock merger with Extraction Oil & Gas and later Crestone Peak.
Civitas Resources had 420 net MMBOE in Reserves in 2Q’22.
CIVI 2Q22 Reserves (Civitas Resources Presentation)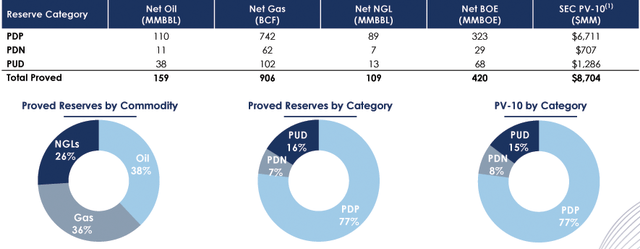
CEO Chris Doyle said in the conference call:
As Colorado’s largest pure-play E&P and first carbon-neutral E&P company on a Scope 1 and Scope 2 basis, Civitas is well positioned for future success within Colorado and the industry more broadly. We’re a young company. We’ve come together over the past 18 months and there were certainly more work to be done.
Note: Civitas is a new company for my marketplace, “the gold and oil corner,” and my stock tracker, and it is my first article reporting on the quarterly results of this company.
Civitas Resources released its second quarter of 2022 results on August 3, 2022.
A reminder: On March 1, 2022, Civitas Resources closed its acquisition of Bison Oil & Gas II, LLC, with a total cash outlay by the company of approximately $300 million, which was funded with cash on hand.
1 – 2Q’22 results snapshot
Civitas Resources came out with adjusted quarterly earnings of $4.63 per share in 2Q22, compared to $1.19 a year ago. Adjusted earnings beat analysts’ expectations.
GAAP net income of $468.82 million and Adjusted EBITDA of $739.2 million (EBITDA of $831.57 million) for the second quarter of 2022.
Average daily sales volumes of 175.2K Boep/d, with oil representing 46% of total output and total capital expenditures of $238.6 million.
CIVI retired $100 million of senior notes and exited the second quarter of 2022 with $392.51 million in debt.
Total liquidity was $1.427 billion as of June 30, 2022, which consisted of $439.3 million cash plus funds available under the new credit facility.
2 – Stock performance
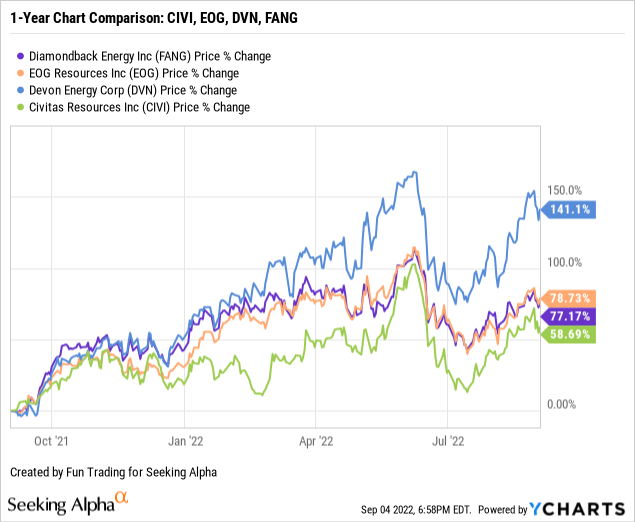
CIVI has done well on a one-year basis but has slightly underperformed the group, as shown in the chart above. CIVI has been up 59% since Sept. 2021.
3 – Investment thesis
Crude oil prices underwent a tremendous rebound one year after the 2020 oil crash. Likewise, natural gas prices, which bottomed out in April 2020, recovered.
In 2022, oil and gas prices soared, with crude oil trading at over $111 per barrel as of June 2022. This tremendous rise benefitted producers of oil and gas like Civitas Resources.
West Texas crude oil is starting to retrace and is now below $90, and the rigs count is slowly decreasing but still much higher than a year ago.
The total rig count fell to 760 this week-263 rigs higher than the rig count this time in 2021.
CIVI is now following the trend and is retracing from its recent peak with a renewed strength since its early July low. But, with the FED’s action, we may fall into a recession at the end of 2022, which will hamper oil demand.
Thus, Civitas Resources should be considered a long-term investment, and it is appropriate to accumulate CIVI on any significant weakness. However, the volatility attached to the oil segment should push you to trade short-term LIFO using at least 30% of your entire position.
This two-level strategy has prevailed in my marketplace, “The Gold and Oil Corner,” and I believe it is the most rewarding strategy in those circumstances. Unfortunately, only US investors can use LIFO, but there is still an alternative for others. Please read my note at the end of this article.
Civitas Resources – Financials and production in 2Q22 – The raw numbers
| Civitas Resources | 2Q21 | 3Q21 | 4Q21 | 1Q22 | 2Q22 |
| Total Revenues in $ Million | 156.04 | 189.96 | 510.46 | 817.81 | 1151.36 |
| Net income in $ Million | -25.32 | 40.66 | 163.70 | 91.64 | 468.82 |
| EBITDA $ Million | 1.77 | 93.87 | 370.03 | 306.74 | 8company |
| PS diluted in $/share | -0.83 | 1.31 | 2.46 | 1.07 | 5.48 |
| Operating Cash flow in $ Million | 36.60 | 112.68 | 82.36 | 532.54 | 722.23 |
| Capital Expenditure in $ Million | 28.91 | 47.04 | 47.85 | 560.82 | 209.97 |
| Free Cash Flow in $ Million | 7.69 | 65.64 | 34.51 | -28.28 | 512.26 |
| Total cash $ Million | 24.40 | 40.41 | 254.45 | 154.35 | 439.25 |
| Total Long-term Debt in $ Million | 199.00 | 160.00 | 491.70 | 492.12 | 392.51 |
| Dividend $/share | 0.4625 | 0.4625 | 0.4625 |
1.3625 |
1.7625 |
| Shares outstanding (diluted) in Million | 30.66 | 31.14 | 84.57 | 85.33 | 85.55 |
Source: Civitas Resources 10Q
* From the press release:
The Company’s board of directors has elected to pay a dividend of $1.7625 per share in the third quarter, which reflects the combination of a variable dividend of $1.3000 per share and a base fixed dividend of $0.4625 per share. This dividend will be paid on September 29, 2022 to shareholders of record as of September 15, 2022.
Analysis: Revenues, free cash flow, net debt, and oil & gas production
1 – Quarterly revenues and others were $1,151.36 million in 2Q’22
CIVI Quarterly Revenues history (Fun Trading)
Net crude oil, natural gas, and natural gas liquids revenue for the second quarter of 2022 increased to $1,151.36 million compared to $817.81 million company the first quarter of 2022.
The increase came from higher crude oil, natural company natural gas liquids realized prices, and increased sales volumes. Crude oil accounted for approximately 68% of total revenue for the quarter.
2 – Generic free cash flow was $512.26 million in 2Q’22
CIVI Quarterly Free cash flow history (Fun Trading)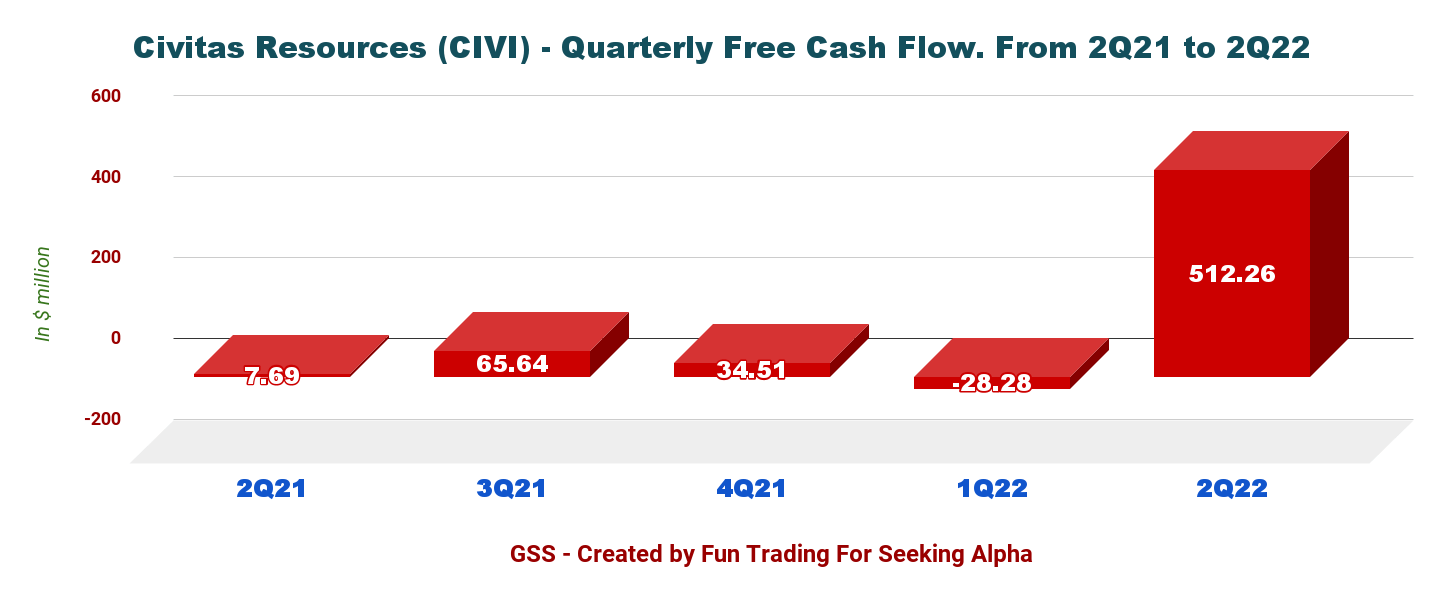
Note: The generic free cash flow is cash from operating activities minus CapEx. The company has a different way of calculating the FCF, which indicates $436.6 million in 2Q22.
Operating cash flow is $722.23 million, and CapEx is $209.97 million in 2Q22. Trailing 12-month free cash flow is now $584.13 million, with the second quarter’s free cash flow at $1,154 million.
This excellent level of Free cash flow allows the company to pay an impressive dividend in September.
CIVI is paying a base quarterly dividend of $0.4625 and a quarterly variable dividend of $1.30 per share.
CIVI Quarterly determination of the dividend 2Q22 Payable in September (Civitas Resources)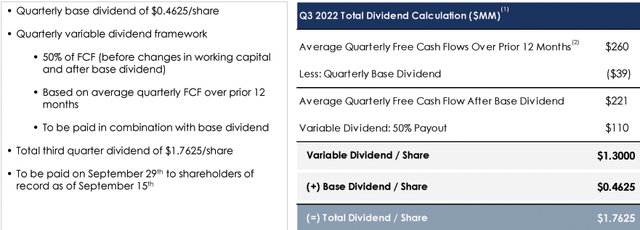
CEO Chris Doyle said in the conference call:
As the business continues to create significant free cash flow we will evaluate the best use of cash where that’s reinvesting in our business through the drill bit, launching share buybacks, extending the runway with additional acquisitions, or increasing dividends back to our shareholders.
3 – No net debt with Total Cash of $439.25 million in 2Q22. Excellent profile.
CIVI Quarterly Cash versus Debt history (Fun Trading)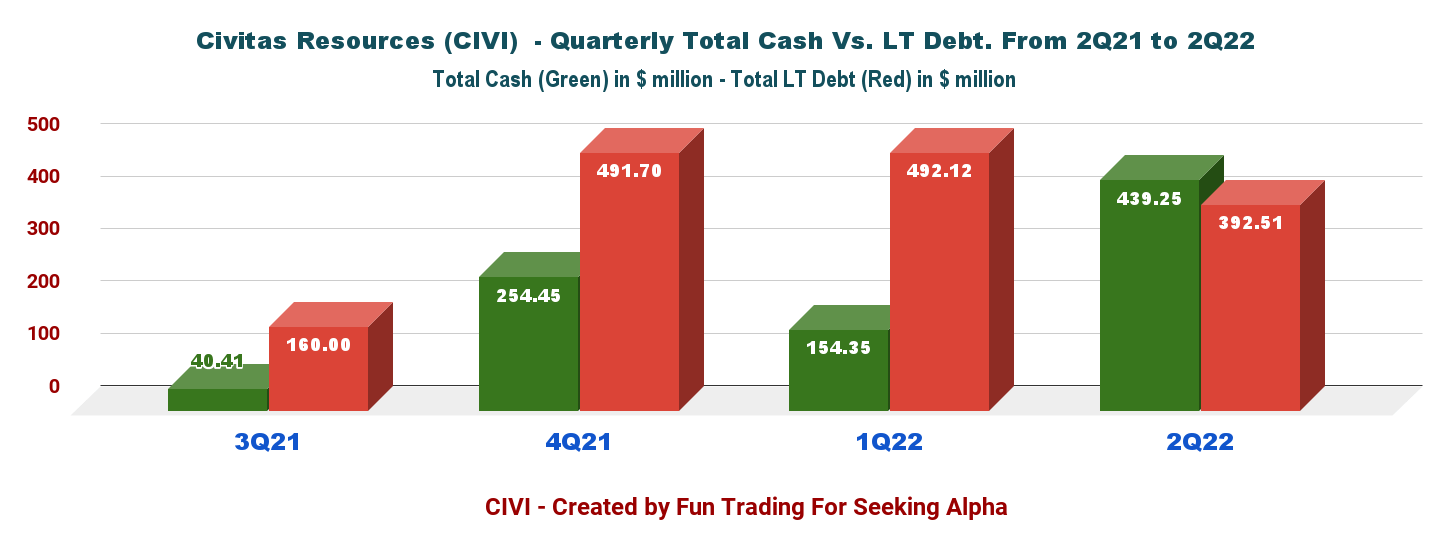
As of Junecompany22, CIVI had approximately $439.25 million in cash and cash equivalents and $392.51 million in total debt. The company indicated that it targets a 0.5x debt to EBITDAX.
On April 21, 2022, the company increased the revolver to $1.7 billion with a liquidity of $1.427 billion.
CIVI Balance Sheet as of June 30, 2022 (Civitas Resources Presentation)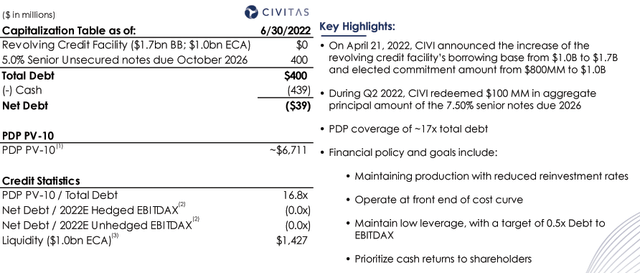
4 – Quarterly production was 175.2 Boep/d in 2Q’22
CIVI Quarterly Oil equivalent production history (Fun Trading)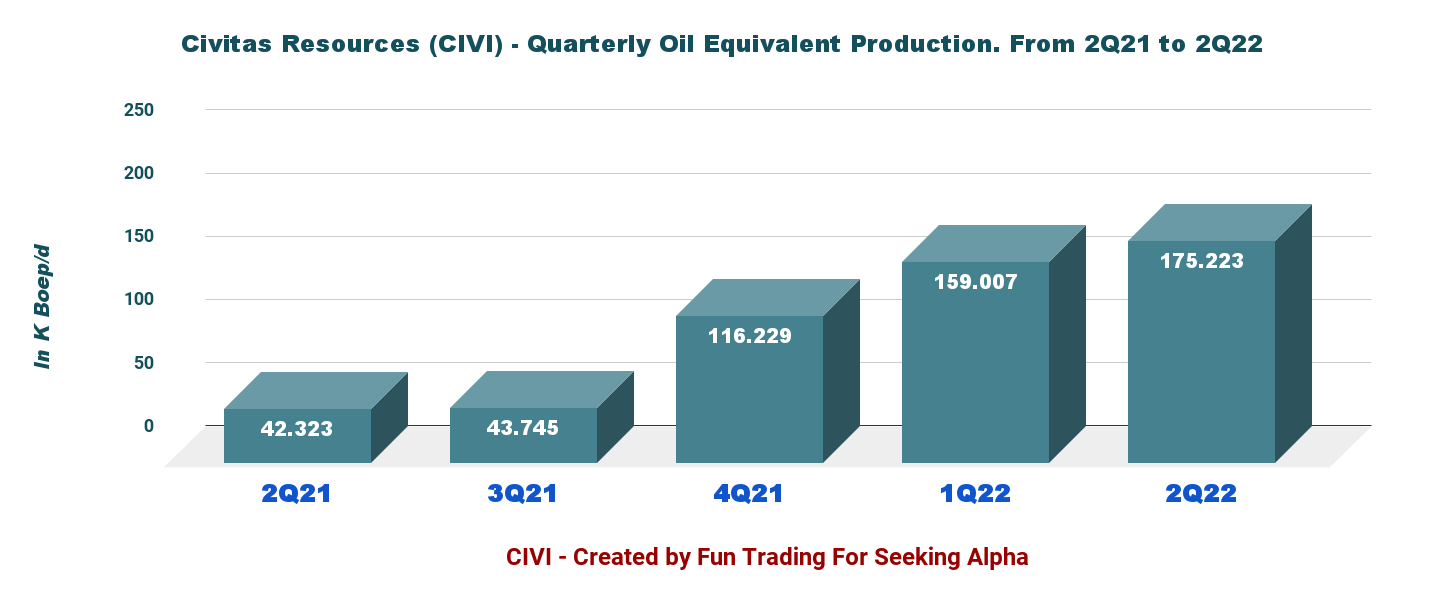
Production for 2Q22 was 175.223K Boep/d, up 10.2% sequentially and up significantly from 42.323K Boep/d the same quarter a year ago (see chart above).
The percentage of oil is 46% in 2Q22, down from 49% in 2Q21. Operating costs for 2022 are estimated at $11.22 per Boe, which is very competitive. LOE plus recurring cash G&A were $3.89 per Boe for the second quarter of 2022, down sequentially from $4.25 per Boe in the first quarter of 2022.
CIVI operating costs history (Civitas Resources Presentation)
Below is the production detail: Oil, NG, and NGL.
CIVI Quarterly Production detail history (Fun Trading)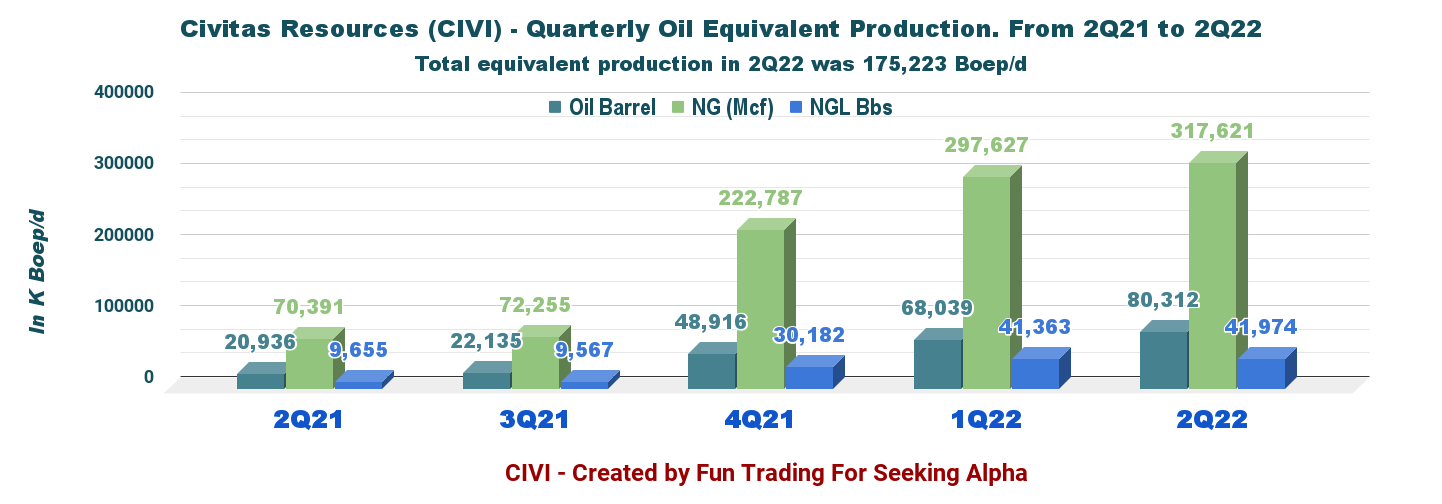
The average oil composite in 2Q22 was $72.17 per Boe, up from $40.37 a year-ago quarter and up 26.5% sequentially.
CIVI Quarterly oil price per Boe History (Fun Trading)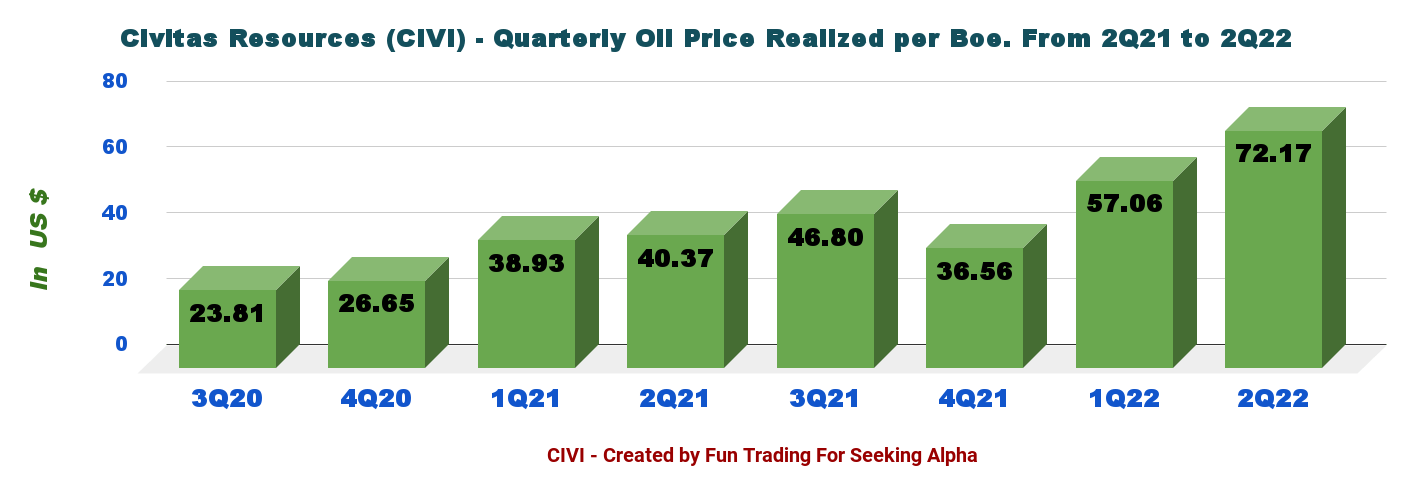
CEO Chris Doyle said in the conference call:
On the permitting and regulatory front, our 2022 plan is largely permanent at this point. Looking ahead into 2023, roughly 20% of our programs on a fully approved OGDP’s of permits another 30% permits are submitted with the majority of those deemed complete and simply awaiting hearing dates and we’ll continue to submit the remainder as we approach year-end and into the first quarter. In total, we have 575 wells working through what we call our permit pipelines.
CIVI Permitting update (CIVI Presentation)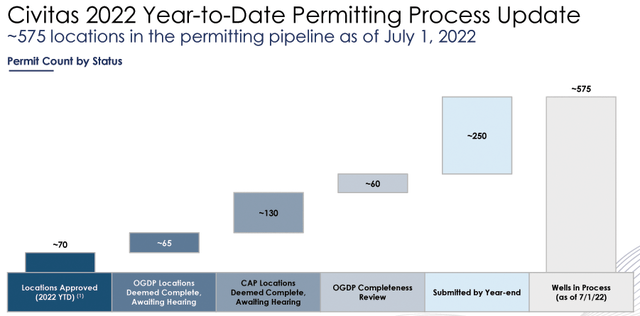
5 – 2022 new guidance
This new guidance incorporates roughly 1K boep/d of additional production in 2022.
The company now expects an average crude oil price differential of roughly negative $4.00-5.00/Bbl relative to WTI during the year and also anticipates paying $75-125 million in cash income taxes in 2022, assuming $100/Bbl WTI oil for the remainder of the year.
CIVI 2022 Guidance (Civitas Resources Presentation)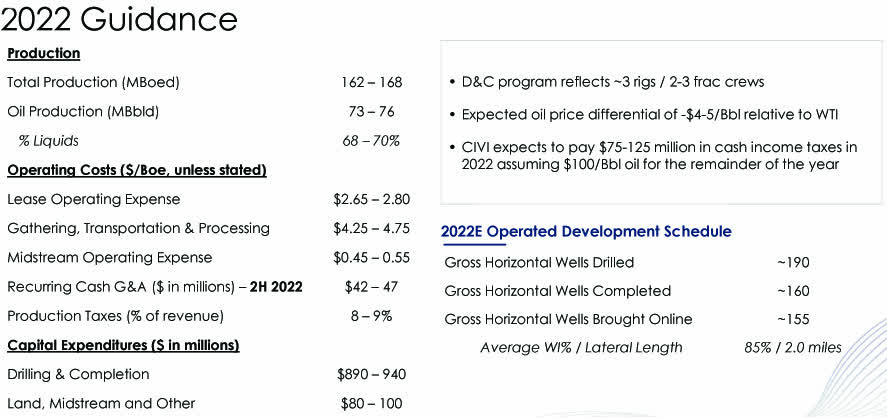
Technical analysis (short term) and commentary
CIVI TA Chart short-term (Fun Trading StockCharts)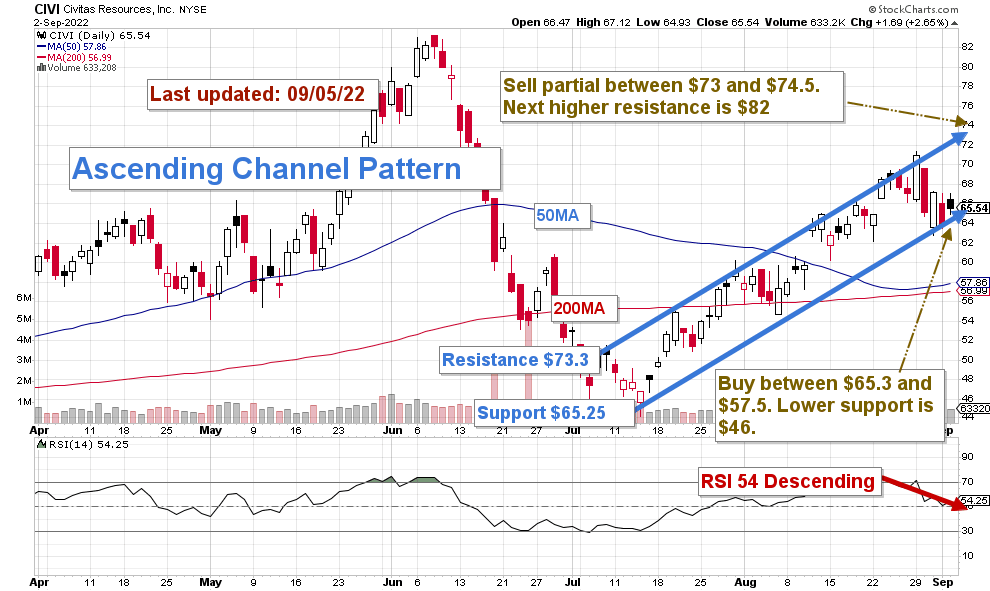
CIVI forms an ascending channel pattern with resistance at $73.3 and support at $65.25.
The short-term trading strategy is to trade LIFO about 40% of your position and keep your core long-term amount for a much higher payday.
The dividend payout, including the extra dividend (forward 10.7% yield), is attractive and justifies keeping a core long-term indefinitely.
I suggest selling between $73 and $74.50 and waiting for a retracement between $65.3 and $57.5 with potential lower support at $46.00 in case of extreme retracement, which seems unlikely but cannot be ignored.
Author’s note: If you find value in this article and would like to encourage such continued efforts, please click the “Like” button below as a vote of support. Thanks.
Be the first to comment