

Jason Koerner/Getty Images Entertainment
Chubb (NYSE:CB) is one of the best run companies in the Property and Casualty insurance business. They are justly famous for disciplined underwriting. I first heard that from a close friend who worked there in the days before Chubb was bought out by ACE (which kept the Chubb name). My friend had taken the job at the suggestion of his father, himself a former insurance CEO, who told him Chubb was the place to learn best practices in the industry. He also got the opportunity to work under Chubb CEO Evan Goldberg, son of the legendary former AIG CEO Hank Greenberg.
A great company begins with strong leadership and Chubb has it. The younger Greenberg is known in the industry for managing his company with unsurpassed intensity and attention to detail, The insider joke is that Chubb has only two lines on its organization chart with Greenberg on the first line and everybody else is on the second, including the janitors. Does everybody at Chubb literally report directly to Evan Greenberg? It’s a bit of hyperbole, of course, but they better be able to answer if he drops in to ask a question.
Greenberg’s earnings calls are legendary. They regularly provide information on the state of the industry and often make for fun reading. Five years ago, they were all about hedge fund interlopers in P&C which damaged underwriting profits for everybody. Greenberg sort of shrugged and expressed confidence that sooner or later they would be handed their heads on a platter. This is pretty much what happened. You could have watched it unfold as David Einhorn’s Greenlight Capital Re (GLRE) fell from over $33 to less than $8 over the past decade. The lesson for hedgies: the insurance business isn’t as easy as it looks from the outside. P&C insurance doesn’t work if you go about underwriting as just a vehicle to provide funds for risky bets. If you want the ex post details read this recent SA article by CrickAnt. Greenberg clearly had the last laugh.
Greenberg’s comment on earnings calls are notable for brevity. He is not shy about calling out fools or obliterating questioners who haven’t done their homework. There’s no nicey, nicey talk to Wall Street analysts. In the course of the most recent earnings call he mentioned that Chubb was mainly a “buy and hold” fixed income investor but had opportunistically traded some bonds to take advantage of rate increases and widening spreads. Swapping bonds generated an average return of 4.7% as against a portfolio average of 3.12%. In response to a question which confused the language “buy and hold” with the term “Hold To Maturity” Greenberg responded this way to a Wall Street analyst I spare by not naming:
Held to maturity, if you’re going to use that term, is a very specific accounting — GAAP accounting term. And there are rules around it. If you have something in the held-to-maturity portfolio, which we have a held-to-maturity portfolio, that is a security that, as designated, will not be sold. And you can only sell it under very prescriptive circumstances, i.e., an impairment, avoiding and around managing impairment. And I’m looking at my Chief Accounting Officer who’s surprised. I can recall those rules. But that’s held to maturity. We’re a buy-and-hold portfolio predominantly. What that says is our intention, all things being equal, is we hold to maturity, but we have the ability to trade.”
The low level of available returns on fixed income over the past decade has been the major challenge for P&C insurance companies in general and Chubb is no exception. Some companies have accepted the poor level of investment returns and manufactured per share earnings growth through share buybacks large enough to make a major reduction in share count. Chubb has had modest buybacks in most years, but has basically addressed the problem of low investment returns by continuing excellence in the things insurance companies do. The major factor has been strong underwriting which has produced excellent combined ratios. A major one-time event was the merger of Chubb into ACE which has brought out the best in two companies. Despite generally tough times in the P&C insurance industry Chubb has done well over the past decade as Chubb continued to increase its dividend as it has for 28 consecutive years.
Recent Earnings Continue To Show A Step Up In Growth After The Merger
On the recent July 28 earnings report Chubb reported non-GAAP EPS of $4.20, beating by $0.57. Annualized return on equity was 9.0% and annualized core operating ROE was 12.4%. Annualized core operating return on tangible equity was 18.6%. If you have an accounting bent you can check the Goodwill line on the Balance Sheet (under Financials) and see the bump up with the ACE acquisition of the former Chubb at a price higher than Book Value.
The combined ratio was an excellent 0.84 compared to 0.855 for the previous year and excluding catastrophe losses (a secondary measure used in the industry) was 0.835 compared to 0.854. For readers not familiar with this important metric it basically measures paid claims versus premiums so that numbers under 1.0 are good and over 1.0 are bad. For comparison purposes, most of the leading companies in the industry are happy to achieve a combined ratio in the area to 0.9 to 0.95. A consistently superior combined ratio is seen as the measure for excellence in underwriting.
The merger of Chubb and ACE which shows up in financial metrics beginning in 2016 produced a company keeping the Chubb name with revenues growing about 50% faster than the numbers through 2015. For that reason, I am using the 2015-2016 break point as more meaningful than the common time periods such as 3-5 years. In the period from 2012 through 2015 the predecessor company had top line growth of about 3.3%. From 2016 through the middle of 2022 (5 1/2 years) top line growth was about 5% (a 50% increase). Top line growth in the insurance industry as a whole has been hard to come by over the past decade so the 1.7% improvement is very meaningful. It also suggests that all analysts and potential investors more or less dismiss statistics before 2016 or in any case break the data into two parts, before and after 2016.
The new Chubb did a good job of holding costs down so that Net Income increased by 10.5% from 2017 through the middle of 2022 (4 1/2) years an increase from $4,135 million to $7,163 million. This suggests that the merger reduced costs in the way all mergers hope to do, and that taking advantage of the synergy was the major focus. As with all mergers there was a general tidying up in several areas. Share count jumped a bit over 40% from 2015 to 2016 with the merger and edged up slightly in 2017 but has declined at a 2% annual rate since 2017 when share reductions through buybacks resumed.
Long term debt jumped from $9.4 billion to $12.6 billion from 2015 to 2016, also as part of the Chubb-ACE merger, leveled off for a few years, then climbed again as Chubb purchased $5.75 billion of Asia ex-China assets from Cigna (CI) in a cash deal which closed on July 1. Evan Greenberg worked for his father’s AIG for 25 years starting in 1975, and was CEO of its Asian business based in Japan and Korea. He is thus well-versed in the risks and opportunities in the region. The minor increase in debt does not pose a problem with Net Debt at 14% of Enterprise Value:
- Market Cap $80B
- Total Debt $21.62B
- Cash $10.55B
- Net Debt $11B
- Enterprise Value $91B
Using the Chubb-ACE merger as the starting point Earnings Per Share have increased at a 13.5% clip since 2016. Dividends have increased at a 3% plus clip over the same period while the payout ratio was steady at a bit over 30% of earnings until a jump in EPS largely driven by recent higher rates dropped it to the high teens in 2021-22. Current dividend yield is 1.64%.
One should never make long term bets on interest rates, but the new higher rates have for now flipped rates from a headwind to a tailwind for insurance investments. The higher rates have the counterintuitive effect of reducing both earnings and book value as higher rates pull down the value of bonds already owned, but the increase in earnings has offset this to some degree. The bonds will either recapture the decline at maturity or be replaced by higher yielding bonds. Chubb stock has not fallen abruptly as they have with some companies possibly because Chubb investors are better informed about the meaning (or lack of meaning) in the temporary whack BV. Chubb investors see the increased likelihood of higher rates for what it is: the bad times are lifting and better times may be on the way.
Chubb Is Near The Top In Quant Rankings
Chubb earns a well-deserved STRONG BUY Ranking in the SA quantitative system provided to premium members. Its ranking is also STRONG BUY among SA Authors and a BUY among Wall Street Analysts.
-
Quant Rating: Strong Buy (4.82)
-
Quant Sector Ranking – Financial Sector (as of 8/15): 15 out of 651
-
Quant Industry Ranking – P And C Insurance (as of 8/15): 2 out of 48
-
Dividend Safety Grade: A
Considering the number of strong companies in the Financial Sector, that #15 ranking is exceptional. The #2 ranking in the Property and Casualty Industry is also impressive especially in light of the fact that the only company ranked higher is Tokio Marine, a highly respected Japanese company with a long and successful history. The market clearly recognizes Chubb as one of the quality global players in both its industry and is sector.
Factor Grades And Shareholder Returns Similarly Warrant a STRONG BUY:
Chubb’s Factor Grades (below) reinforce the STRONG BUY Quant Ranking:
While dividend yield is moderate at 1.64%, its Safety and Growth get marks of A+ and A. Total shareholder return for 2021 was 112% of core earnings as reported by CFO Peter Enns (in the Q4 2021 earnings call), a large step up which showed confidence in its strong cash position and growing cash flow. Share repurchases were $4.9 billion, 3 1/2 times the size of the dividend and 6.5% of share float. Investors familiar with buybacks on this scale will know that their claim on the assets and per share earnings of the company increased by almost 7%. That’s a huge jump in shareholder value.
Of the Factor Grades only Valuation received a letter grade lower than B. The first thing to bear in mind is that property and casualty companies all have much lower P/E ratios than the market as a whole, and as a company of Premium Quality one might expect Chubb to sell at what is a small premium to the rest of the industry group. Among the other factors which might have had a role in the D rating is the price-to-book-value ratio. As explained above, much of the jump in P/B ratio follows from the write-down of fixed income securities which will almost certainly return to face value at maturity. A larger rise in P/B than the industry norm would happen mechanically in the securities swaps mentioned at the top of the article in which bonds at lower rates are sold and exchanged for bonds with higher rates or wider spreads.
Using average earnings growth of 13.5% measured from the 2016 ACE/Chubb merger, the important PEG ratio (which divides the P/E ratio by EPS growth is about 0.9, in the positive area below 1.0 while the financial sector overall has PEG ratio over 1.0, a less favorable number. The use of six-year post merger period is longer than periods often used to calculate the PEG ratio but for a consistent performer like Chubb may be the better time frame in which to estimate value including a factor for growth.
A Story Told In Three Charts
A picture sometimes tells a better story than words, and while I don’t find stock charts very predictive of the future, I believe that they often do a pretty good job of explaining various phases of the past. Here are three charts of Chubb (purple line) compared to the S&P 500 (SPY) (orange line) over three time periods, starting with one year:
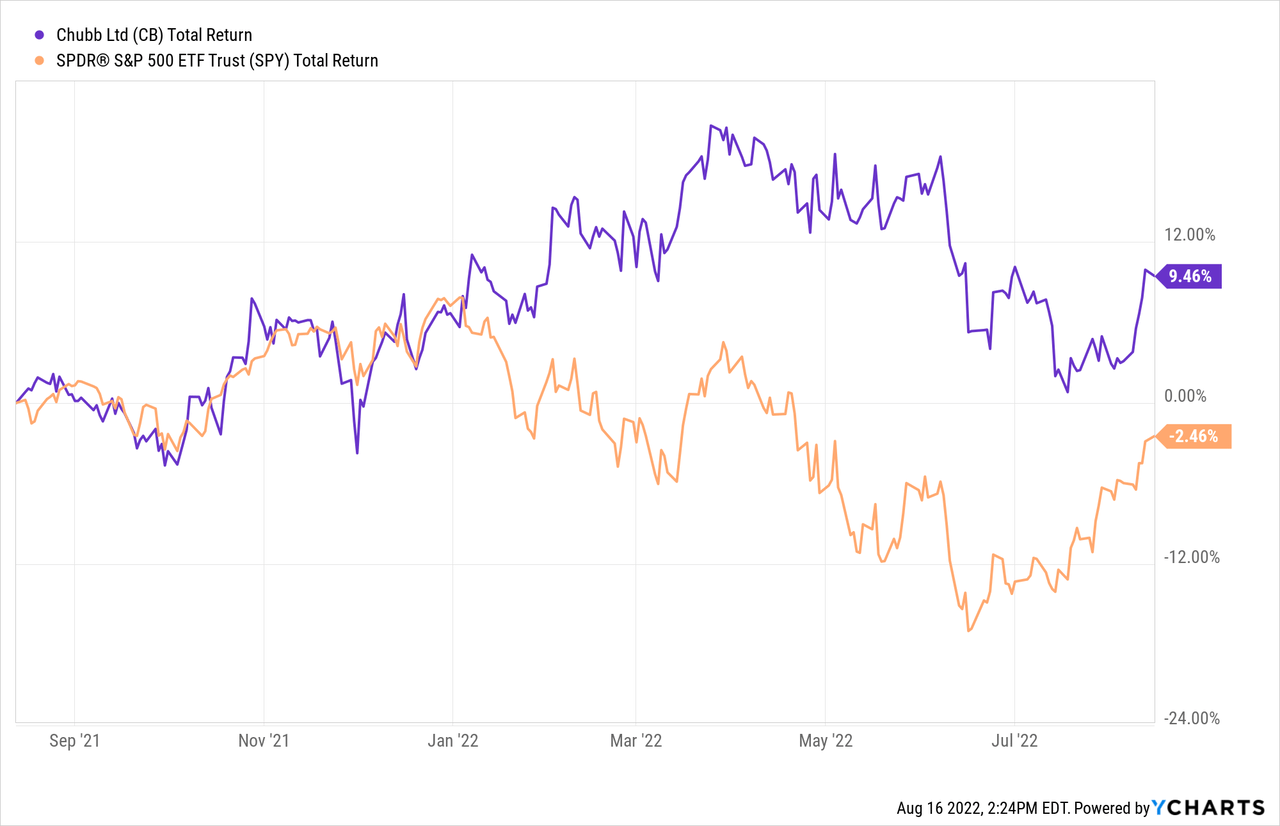
The one-year chart shows pretty clearly that Chubb, with its moderate growth and high level of consistency, began to pull away from the S&P 500 around the beginning of the year. The short version is that the S&P 500 is heavily weighted with expensive stocks including techs which the market likes less as rates rise. P&C insurance companies see high rates more or less the same way Brer Rabbit saw the briar patch.
The second chart, covering 10 years, shows what insurance companies, which rely on fixed income assets to cover future claims, don’t like. They don’t like the miserable low rate environment since 2009 in which the Federal Reserve suppressed rates. The hedge funds which competed with them for several years compounded the problem by driving down industry-wide underwriting profits:
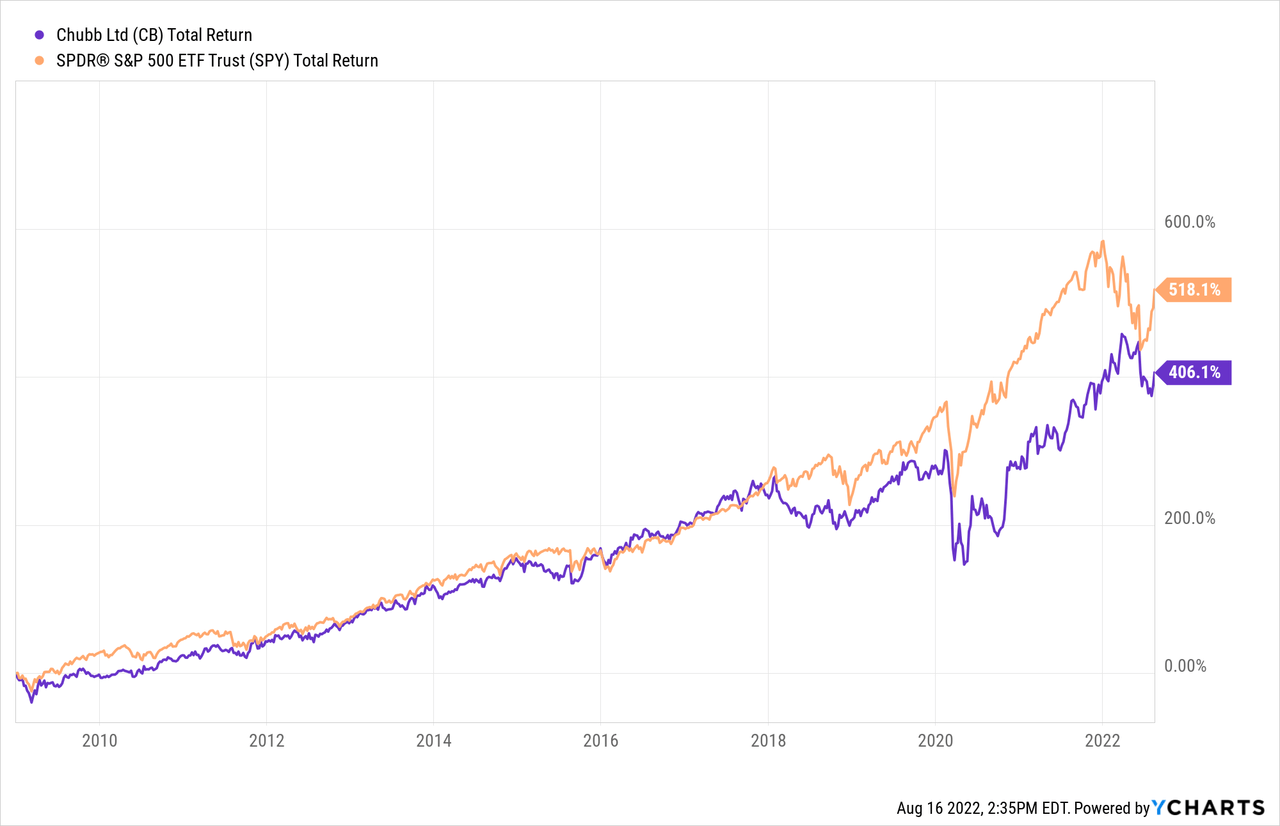
To put together the proper perspective, the above chart requires a little second order thinking. The big surprise is that Chubb held its own in price until the Fed chickened out on 2018 rate hikes and then cut rates and expanded money supply wildly in 2020 and 2021. The hiccup that followed is very visible, but seen as part of a diversified portfolio the important fact is that Chubb had 80% of the S&P 500 return at much lower risk. The period in rate purgatory set up the swing in its favor shown on the first chart. The third chart, covering the max period available, shows how strong a performance Chubb had in a period including several major ups and downs in the economy and rates:
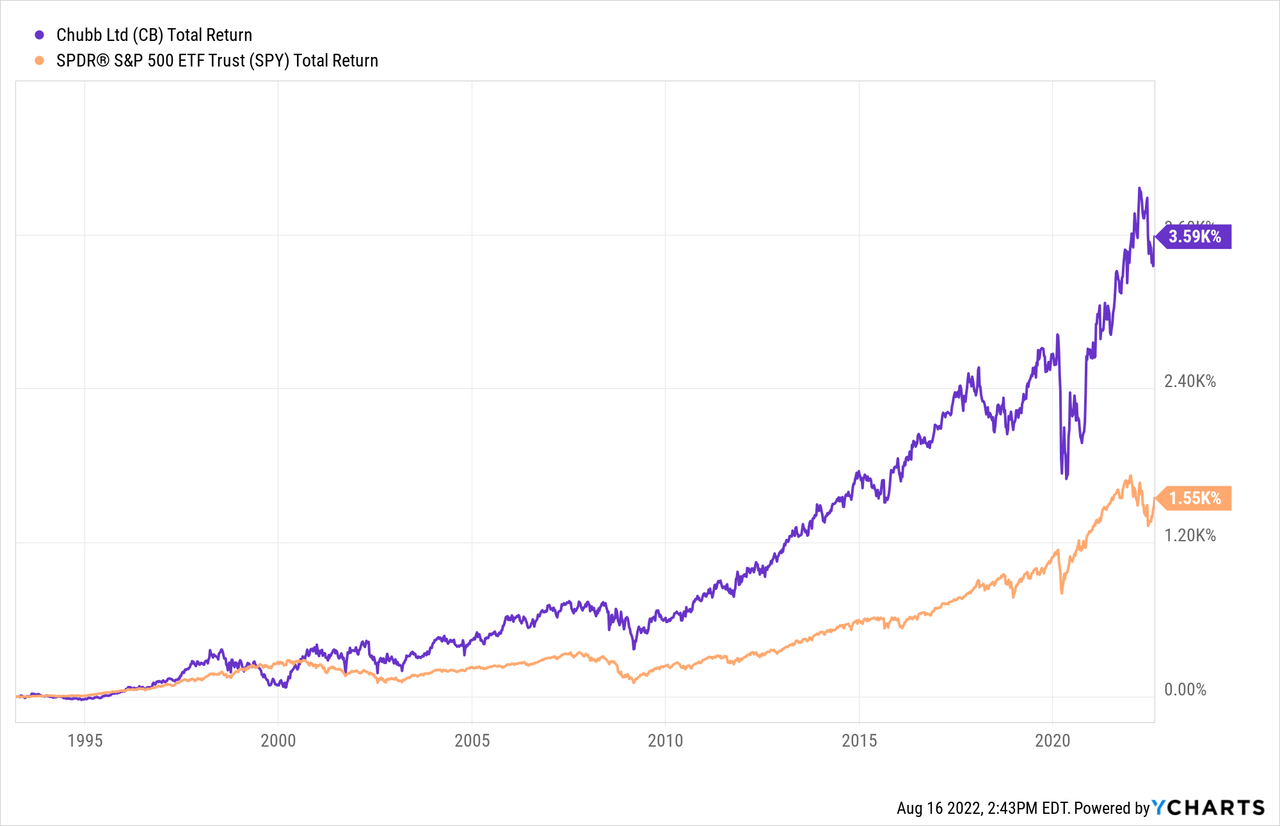
What this last chart shows is that Chubb beat the daylights out of the S&P 500 over about 30 years. It did this by rising steadily in good times and not going down too much or for too long (as in 2020). It didn’t hurt that over that period its valuation was always – my rough but informed guess – at least 33% less than the P/E of the S&P 500. Among other things, this meant that the contribution of dividend yield to total return was much higher. If you are a long term investor, that third chart is composed of factors still likely to work in your favor. The short version is that Chubb did very well and beat the market over good times and bad. If you have read this far, you probably get it that Property and Casualty Insurance is a dull industry and Chubb is a dull company. May all my investments be dull in that way.
The Key Factors Which Make Chubb A Big Winner
- Outstanding performance starts with outstanding leadership at the top, and Chubb has a CEO recognized by his peers as one of the best.
- Chubb also gets respect in the industry for being the best at underwriting, a view supported by its excellent 0.84 combined ratio.
- Chubb has succeeded in good times and bad. It brushed off competition from hedge funds like Greenlight Capital which got into P&C insurance mainly to have “float” to invest and it responded to a disinflationary low-rate decade with poor fixed income returns by holding down costs and executing the 2015 merger which ramped up growth; it has already begun to optimize returns in an inflationary high-rate environment.
- Chubb has just 14% net debt.
- With strong and growing free cash flow Chubb returned 112% of core earnings to shareholders in 2021, recently increased its dividend for the 28th consecutive year, and retired 6.5% of share float with buybacks.
- While Chubb’s price earnings ratio is slightly higher than the average for its industry, the premium is justified by its quality, including a conservative balance sheet, strong growth, and strong profitability.
- Chubb’s PEG ratio (P/E ratio divided by EPS growth) is 0.9 using the average growth rate since the ACE/Chubb merger; this suggests that Chubb is cheap when its long term growth rate is taken into account.
Chubb has been a part of my family portfolios for over a decade. I may add at any time. I rate it a STRONG BUY.
Be the first to comment