

LPETTET/E+ via Getty Images
Investment Summary
Following our recent appraisal on Viemed Healthcare we also clarified our buy thesis on Chemed Corporation (NYSE:CHE). In our last publication on CHE, we reported CHE demonstrated a multitude of economic pillars that gave it a ‘resiliency premium’. Chief among these were profitability and balance sheet strength. We suggest reading our last CHE publication.
Unpacking this further, we previously noted for CHE:
- >30% trailing ROIC in the 2nd quarter
- Healthy bottom-line fundamentals
- Positive rating on the stock at fair value of $526 [internal estimate].
Since then, the stock has drifted ~6.5% higher and a strong 3rd quarter with upgraded FY22 EPS guidance confirms our buy thesis. We re-rate CHE a buy with a suggested price range up to $570, up from our previous target of $526.
As a reminder, CHE operates its two subsidiaries, VITAS Healthcare (“VITAS”) and Roto-Rooter (“Roto”). The former provides hospice and palliative care services through its network of professionals, the latter, providing plumbing, drain cleaning and water cleanup services. We are particularly focused on the VITAS business in this report.
Q3 results reflect growing economic value added
Concentrating on VITAS’ Q3 revenue, it booked a 660bps YoY decline in revenue to $297mm. Noteworthy, management said that admissions outpaced discharges throughout the back end of the quarter.
The decrease was underlined by a 440bps contraction in days of care. Moreover, CMS reimplemented its 2% sequestration cut during the quarter causing an industry-wide impact. This further impacted CHE’s turnover.
We observed a further ~170bps or $5.3mm headwind from the level of care mix/acuity mix during the period. It’s also worth noting that VITAS accrued $600,00 in Medicare cap billing limitations, versus $100,000 the year prior [500% YoY increase]. This also had an impact on revenue along with changes in revenue distribution mentioned earlier.
Switching to operating metrics, we noted the following:
(1). VITAS’ verage daily census (“ADC”) was 17,242 patients in the quarter, and that’s down 4.4% on 3-year averages. Reminder, ADC measures the average number of patients during the year from annual admissions and length of stay.
(2). Q3 admissions came to 14,680 for the quarter, down 16.6% YoY, and hospital directed admissions narrowed 23.4%. Management projected the decrease earlier on and we note this is potentially good evidence of this community access initiative pulling through.
(3). Average length of stay for Q3 was 106.2 days up from 96 days in Q3 FY21, but down from 103.7 days sequentially. More specifically median length of stay came to 17 days, flat from Q2 FY22.
(4). CHE repurchased $23.9mm or 50,000 of its own shares at an average $477.68 per share. The reduction in share count could serve important upside factor if the stock continues its latest rally. It has $101mm remaining under authorization.
(5). We should also highlight CHE continues to create future economic value. Notably, Q3 return on invested capital (“ROIC”), as measured by net operating profit after tax (“NOPAT”)/invested capital, continued to diverge from FCF, scoring 33% on a TTM basis [Exhibit 1].
To us this demonstrate spectacular efficiency in generating economic value added.
Thus, CHE continues reinvesting its FCF at a c33% return and this is incredibly attractive in the current environment, outpacing the WACC hurdle of 6.53% by >5 turns.
Exhibit 1. Divergence of ROIC and FCF continues, illustrating CHE’s ability to invest available cash at a c.33% return. In terms of economic profit, the ROIC/WACC spread is 26.47 percentage points.
Data: CHE SEC Filings; HB Insights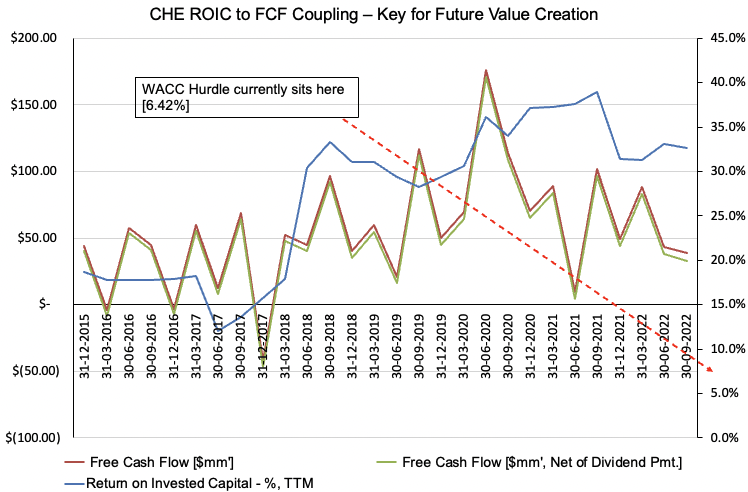
Guidance points to EPS upsides downstream
Looking ahead, management expect a 450-500bps revenue decline for VITAS in FY22. This factors the absent sequestration relief from FY21. Roto-Rooter is forecast for 620-650bps YoY revenue growth for this year.
Also for VITAS, management expects ADC to tighten another 340bps and incur a $8.1mm Medicare cap billing limitation liability for FY22. As a takeout management also estimate adjusted EBITDA margin of ~17% and 29% for VITAS and Roto-Rooter respectively.
It’s therefore pleasing to see CHE projected upside on its previous EPS guidance to $19.60-19.70/share [previous $19.30-$19.50]. We are in management’s lane here and see EPS stretching to $20.19 and $22.61 in FY23, FY24′ respectively.
We base this of our assumptions on the company’s resiliency and ability to compound cash at trailing c.30%. You can see our revenue forecasts in the low single-digits over this time on core EBITDA growth of ~310bps in FY23.
Exhibit 2. CHE forward estimates [qrtly, annual] FY22-24′. We see steady bottom-line growth each year over next 2 years.
Data: HB Insights Estimates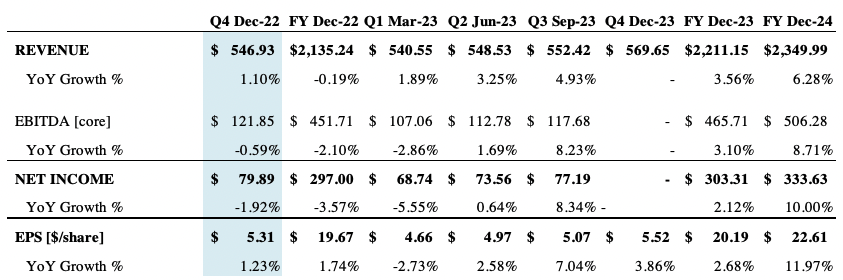
The technical picture for CHE
Price action has been less than impressive for CHE these past 2 years with several snap-back rallies failing at the resistance line shown [Exhibit 3]. It has traded in wide range, backing and filling across the period from January FY21 – same point when many health care stocks peaked.
It has since broken the upper resistance line of this channel with strong volume support. We note CHE’s now closed above the 50DMA 7 weeks in a row with strong volume support.
To us this represents accumulation and could represent institutional momentum as well. With the volume trend ascending throughout CHE’s large consolidation, buying power into its latest move was validated.
Exhibit 3. CHE 2-year weekly price action, now broken upper resistance line and converging to 250DMA, closing above 50DMA 7-weeks in a row on strong accumulation [volume].
Data: Updata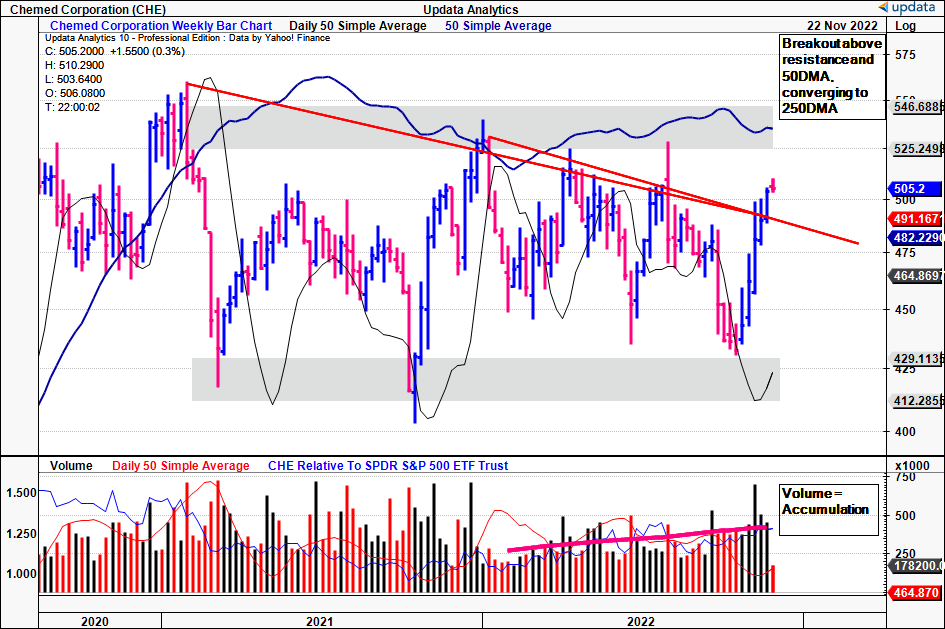
Checking the cloud chart below we see shares punching above the cloud and on-balance volume matching the accumulation described above.
We believe both charts illustrate strong buying support and this is backed strong price visibility given by the depth of the order book [we use Interactive Brokers TWS to see the depth of the bid-ask range].
Exhibit 4. Trading above cloud support with lag-line testing upper range of cloud. On-balance volume matching accumulation thesis above.
Data: Updata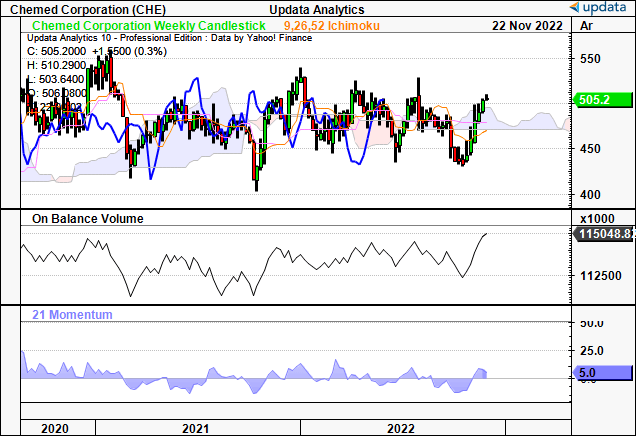
Valuation and conclusion
We should advise that consensus values CHE at 25-29x forward P/E [non-GAAP / GAAP]. The estimate of the FY22 S&P 500 forward P/E of 18.18x, thus investors project CHE to outpace the broad market.
We like this valuation for CHE and believe it should trade at the upper end of the consensus range at 29x forward P/E. [Exhibit 5].
Applying the 29x multiple to our FY22 EPS estimates of $19.67 we suggest a price range of $5.70. This would see us aiming for ~$65 per share in this name as our first target.
The combination of revised EPS guidance, supportive technicals plus fair and reasonable valuation confirms our buy thesis.
Exhibit 5. Fair forward P/E of 29x to FY22 EPS est. $19.67 = $570
Note: Fair forward price-earnings multiple calculated as 1/fair cost of equity. This is known as the ‘steady state’ P/E. For more and literature see: [M. Mauboussin, D. Callahan, (2014): What Does a Price-Earnings Multiple Mean?; An Analytical Bridge between P/Es and Solid Economics, Credit Suisse Global Financial Strategies, January 29 2014]. (Data: HB Insights Estimates)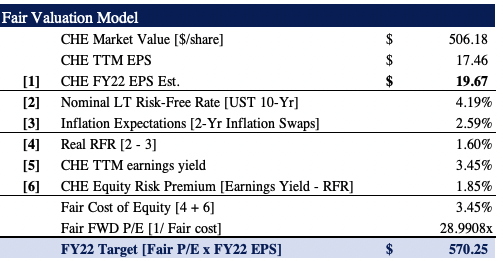
Be the first to comment