

stevecoleimages/E+ via Getty Images
By Joe Duarte
Sometimes it’s best to look at the stock market as if it was the only thing that mattered.
And this may be one of those times, at least from a purely analytical and trading standpoint.
I am not predicting a rip-roaring bull market, although the emergence of such a market remains plausible. However, contrary to the prevailing mainstream opinion, technical signs are pointing to a potential breakout in stocks. Of course, nothing is certain. And given the number of external factors that could deliver unpleasant surprises over the next few days to weeks, the potential for a disruption of the current rally at nearby overhead resistance levels is equally plausible.
Nevertheless, given the amount of bearish sentiment and doubt that is in the air, coupled with very constructive price charts it makes sense to prepare for a potential bullish surprise, while certainly being aware of the fact that any such breakout could just as easily fail. In other words, cautious bullishness is the correct stance at the moment. On the other hand if a liquidity crisis develops, then all bets are off.
A Straight-Up Look at the Charts
I usually comment on how the markets and the economy act as one entity, the MELA system where M is for markets, E is for the economy, L is for people’s life decisions, and A is for the artificial intelligence systems (algos) that run or influence just about everything these days. But in this article, I am going to focus on the markets, because they are telling an interesting story which is primary to investors.
Specifically, I am going to focus on the stock market since it is the basis for the MELA system via its effect on people’s savings—401(k) plans, IRAs, trading accounts, and crypto holdings—and how the stock market shapes their spending habits and thus influences the economy.
Mainstream View of Current Situation in the Economy
The mainstream view of the economy can be summed up as follows:
- Runaway inflation is the central influence.
- The Federal Reserve will raise interest rates aggressively until 2024.
- The economy will tank.
- The stock market will crash.
The Stock Market’s View:
- Inflation is a thing to consider but not the only thing.
- The Fed won’t be able to raise rates too many times.
- The Fed will be lowering rates in a hurry before too long.
- The market moves the economy and lower rates lead to higher stock prices.
As you can see there is a difference of opinion. While the pundits and analysts are focused on inflation and the present, the market sees inflation as one of numerous factors which will influence what happens next. And that’s because the stock market is run by algos which have been programmed to act primarily on the flow of money in and out of stocks.
And what’s clear at the moment is that, when the news is dire and the Fed is talking about higher interest rates, money is flowing into stocks.
The Charts Don’t Lie
There is a blatant beauty in a price chart. That’s because a price chart can’t lie. Of course, prices can certainly change, and often do. But charts capture every single tick of the markets and over time, they offer up trends for traders to act upon. And the current trend that is emerging, even though it’s hard to just say it—well it looks bullish until proven otherwise.
NYAD Poised to Break Out. SPX Testing Key Support.
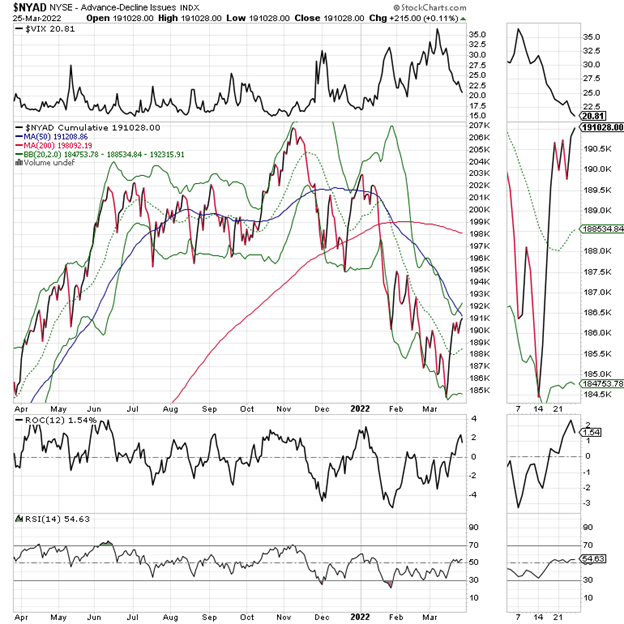
The New York Stock Exchange Advance Decline line (NYAD) has been trading in a tight trading pattern and is making a move toward testing the resistance of its 50-day moving average. A success here would likely bring in money from the sidelines and keep the rally going.
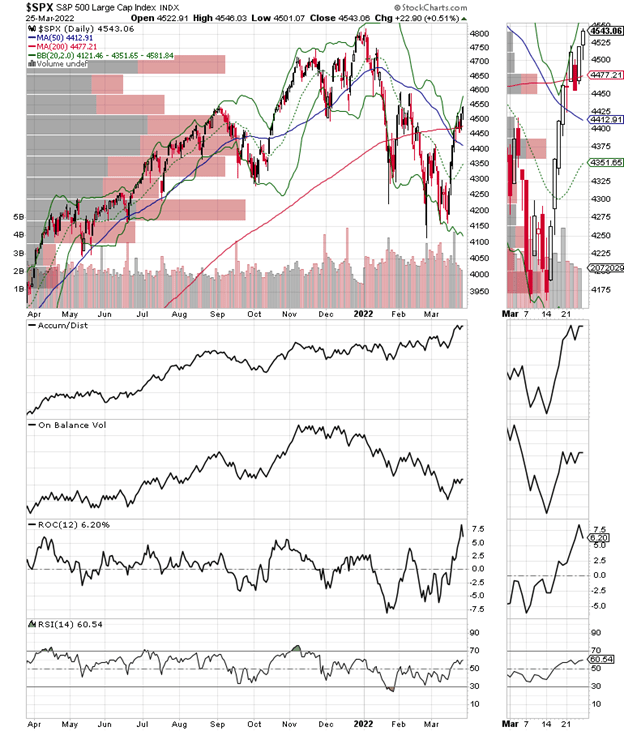
Meanwhile the S&P 500 (SPX) looks set to tackle the key resistance area of 4600 with short-term support at the 200-day moving average and long-term support at 4300.
Accumulation Distribution (ADI) recently shot up much higher than On Balance Volume (OBV) which is usually a sign that the rally was due to short covering. OBV has been improving which means that new money is tricking in.
If this rally is going to expand, we need to see the following:
- The S&P 500 needs to hold above its 200 day moving average and rally from there.
- Further improvement in OBV.
- A decisive move above 4600.
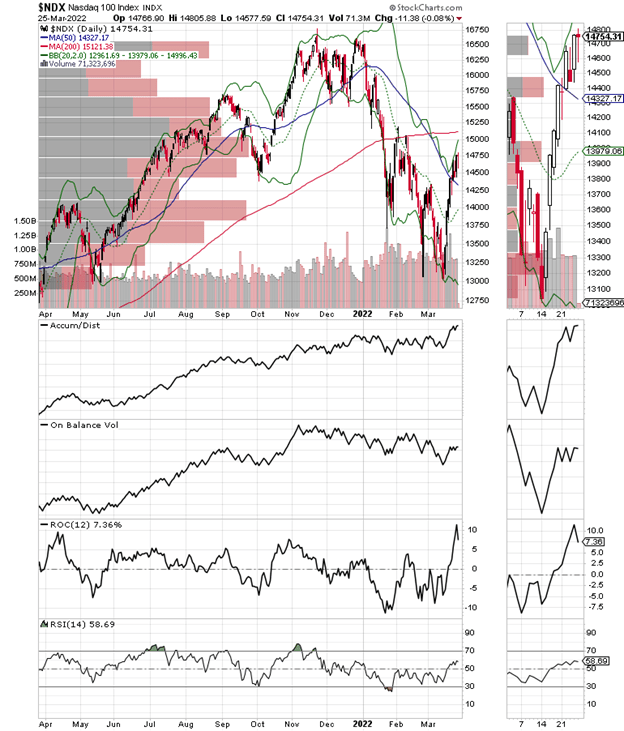
The Nasdaq 100 (NDX) index is struggling compared to the S&P 500, which is being pushed higher by industrial and energy stocks at the moment. As a result, in order to have a bullish confirmation from NDX, we need to see the following:
- A move by NDX above its 200-day moving average.
- A continuation of the bullish action in ADI and OBV for NDX.
- A decisive move above 15250.
VIX Crashes Says Few Put Buyers Left
For the past few weeks we’ve seen the CBOE Volatility Index (VIX) fall significantly. It’s no accident that the stock market has recovered during that time.
Moreover, if this trend in VIX keeps going, then it makes sense to expect that the general trend in the stock market will keep its upward bias.
That’s because rise in VIX signals that put option volume (bets that the market is going to fall) are on the rise. What follows when put volume rises is that rising put volumes cause market makers to sell puts and simultaneously hedge their bets by selling stocks and stock index futures.
So, if VIX continues to fall and NYAD continues to rise, we could see higher stock prices in the short term.
Originally published on MoneyShow.com
Editor’s Note: The summary bullets for this article were chosen by Seeking Alpha editors.
Be the first to comment