

Stock photo and footage
Charter Communications, Inc. (NASDAQ:CHTR) is finding new opportunities to expand its footprint by utilizing state and federal grants to provide broadband internet access in rural areas. Historically, internet providers have been unwilling to invest in building costly infrastructure in areas with low populations. The grants are reducing that financial risk, while also introducing new long-term customers to its products. Charter was awarded $8.5 million in grants in Maryland and $50 million to bring broadband to several rural Kentucky counties.
In two other rural communities, the company is facing criticism for allegedly funding a shadow organization that tried to convince people in Maine to voice their objections to plans by municipalities to build their own taxpayer-operated broadband projects that compete directly against Charter. The company is Maine’s largest internet service provider, and the failed proposals directly threatened Charter’s monopoly in the two townships.
Charter may have to pay $375 million in damages after a jury found it negligent in the death of an 83-year Texas woman who was murdered by a Charter service technician. Charter suspended employee background checks prior to the woman’s murder and failed to verify the employee’s past employment. The employee had already been sentenced to life in prison before the victim’s family filed the civil lawsuit against Charter.
When considering these current stories about Charter Communications, we need to determine which news topics will have a long-term and ongoing effect on the company and its share price. The negative headlines may grab the attention of readers, but will likely not sway consumers from utilizing what is considered an essential service, especially in areas with limited competition. However, the company’s move to expand into new service areas will likely have a long-standing impact on the company’s earnings.
While current news stories, good or bad, can sway our opinion about investing in a company, it’s good to analyze the fundamentals of the company and to see where it’s been in the past and in which direction it’s heading.
This article will focus on the long-term fundamentals of the company, which tend to give us a better picture of the company as a viable investment. I also analyze the value of the company versus the price and help you to determine if CHTR is currently trading at a bargain price. I provide various situations which help estimate the company’s future returns. In closing, I will tell you my personal opinion about whether I’m interested in taking a position in this company and why.
Snapshot of the Company
A fast way for me to get an overall understanding of the condition of the business is to use the BTMA Stock Analyzer’s company rating score. CHTR has high scores for 10 Year Price Per Share, and Gross Margin Percent. It has mediocre scores for ROE and Earnings per share. It has low scores for ROIC and PEG Ratio. A low PEG Ratio score indicates that the company may not be experiencing high growth consistently over the past 5 years. It’s worth noting there is not presently enough data to support a score on whether the stock has an adequate ability to recover from a market crash or downturn. In summary, these findings show us that CHTR’s fundamentals are varied with a mixed bag of good, mediocre, and low scores.
Before jumping to conclusions, we’ll have to look closer into individual categories to see what’s going on.
BTMA Stock Analyzer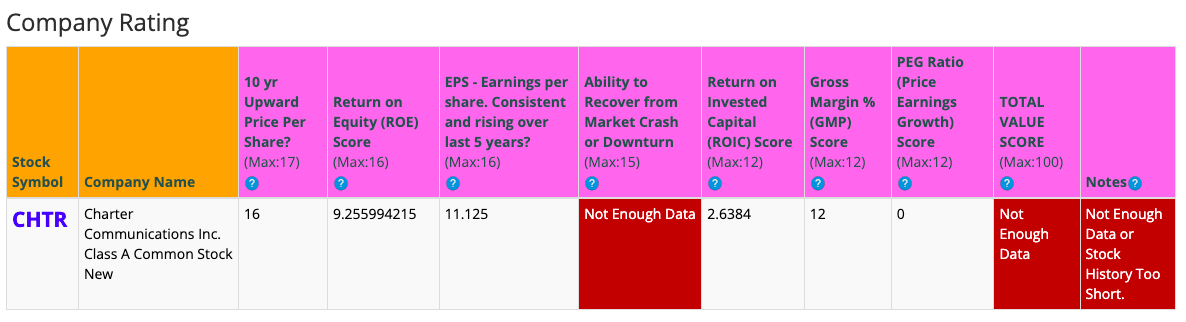
Fundamentals
Let’s examine the price per share history first. In the chart below, we can see that price per share has been mostly consistent at increasing over the last 10 years, with only two years where share price has declined. After four years of increases, share price declined in 2018. Price rose again in 2019, 2020 and 2021, before dipping in 2022. Overall, share price average has grown by about 384.76% over the past 10 years or a Compound Annual Growth Rate of 19.17%. This is an impressive return.
BTMA Stock Analyzer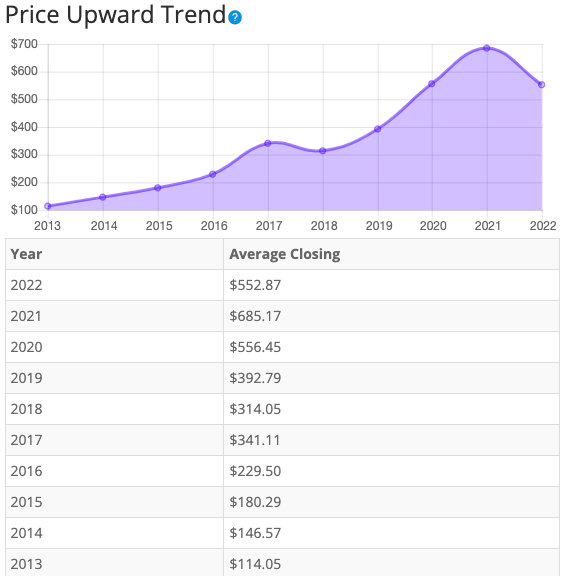
Earnings
Looking closer at earnings history, we see that earnings have not grown consistently over the past 10 years. In fact, the company posted negative earnings from 2012 to 2015. Charter swung to a profit with a massive surge in earnings in 2016. Earnings more than doubled in 2017 before tumbling dramatically in 2018. Earnings growth returned with increases in 2019, 2020 and 2021.
Charter Communications’ earnings variability reveals what can happen as a result of a three-way merger, which occurred in 2016 when Charter acquired both Time Warner Cable and Bright House Networks. The move resulted in Charter becoming the nation’s second-largest cable and broadband service provider. While the merger propelled earnings, the new company’s debt nearly doubled due to the acquisition which can drag on the bottom line. Charter faces stiff competition on pricing, a seemingly endless requirement to reinvest significant capital in technology and infrastructure, and has invested significantly in stock buybacks. These factors make it more challenging to dramatically improve top line performance. The silver lining is that earnings have been improving over the past 3 years.
Consistent earnings make it easier to accurately estimate the future growth and value of the company. So, in this regard, CHTR is a poor example of a stock to accurately estimate future growth or current value.
BTMA Stock Analyzer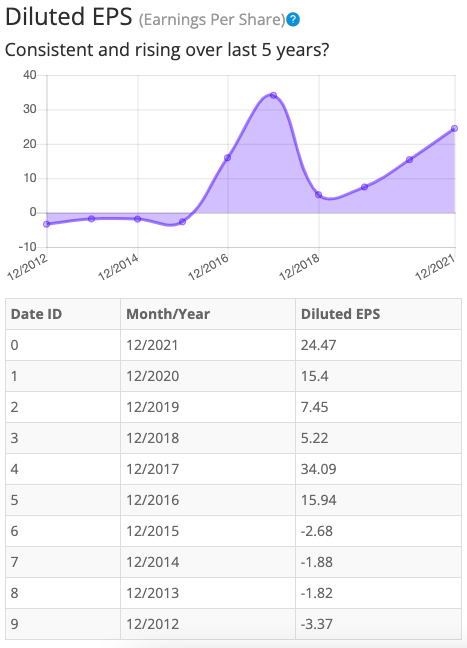
Since earnings and price per share don’t always give the whole picture, it’s good to look at other factors like the gross margins, return on equity, and return on invested capital.
Return on Equity
The return on equity has been inconsistent in the period from 2017 to 2021. In 2018, ROE plummeted from a strong position the previous year, and then rebounded in 2019, 2020 and 2021. By the end of 2021, ROE had nearly returned to the high-water mark established in 2017. Five-year average ROE is below expectations at around 13.88%. For return on equity (ROE), I look for a 5-year average of 16% or more. So, CHTR does not meet my requirements. On the positive side, ROE has been on an upward trend.
BTMA Stock Analyzer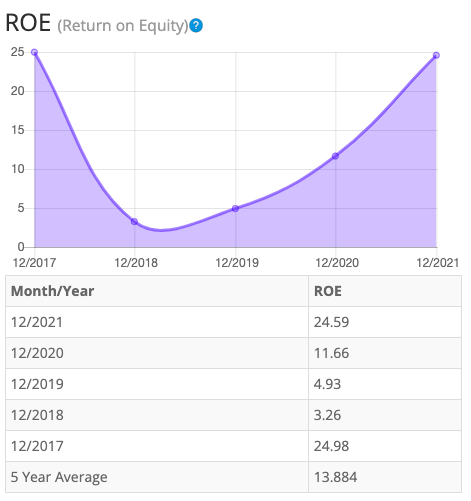
Let’s compare the ROE of this company to its industry. The average ROE of 42 Telecommunication Services companies is 10.41%.
Therefore, Charter’s 5-year average of 13.88% is marginally above average. However, Charter’s current ROE of 24.59% is well above average.
Return on Invested Capital
The return on invested capital (ROIC) has been inconsistent and dropped overall from 2017 to 2021. ROIC dropped significantly in 2018 before rising in 2019, 2020 and 2021. Five-year average ROIC is substandard at around 6.6%. For return on invested capital, I also look for a 5-year average of 16% or more. So, CHTR fails this test as well. Like ROE, the ROIC is also on an upward trend.
BTMA Stock Analyzer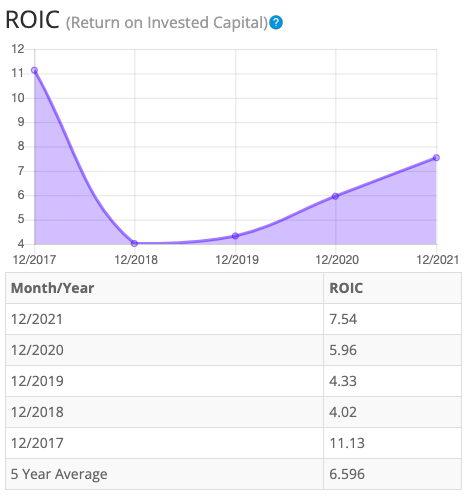
Gross Margin Percent
The gross margin percent (GMP) has mostly increased over the last five years. GMP increased in 2018, 2020 and 2021 with only one decline in 2019. Overall, five-year GMP is good at around 43.4%. I typically look for companies with gross margin percent consistently above 30%. So, CHTR has proven that it has the ability to maintain acceptable margins over a long period.
BTMA Stock Analyzer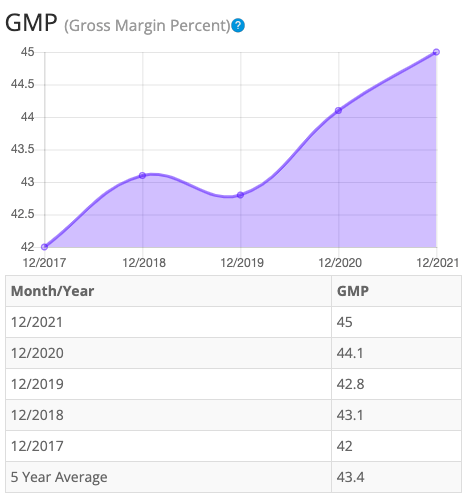
Looking at other fundamentals involving the balance sheet, we can see that the debt-to-equity is greater than 1. This is a negative indicator, telling us that the company owes more than it owns.
CHTR’s Current Ratio of 0.4 is unsatisfactory, indicating that it does not have adequate ability to use its assets to pay its short-term debt.
Ideally, we’d want to see a Current Ratio of more than 1, so CHTR does not meet this amount.
According to the balance sheet, the company could use much improvement. In the long term, the company has significant debts that continue to grow while its assets are shrinking. In the short term, the company is generating free cash flow, but it fluctuates wildly, making it difficult to assess whether the company can cover its obligations without being forced to take on additional debt.
The Price-Earnings ratio of 16.4 indicates that CHTR might be selling at a fair price when comparing CHTR’s P/E Ratio to a long-term market average P/E Ratio of 15. The 10-year and 5-year average P/E Ratio of CHTR has typically been between 56 and 52, so this indicates that CHTR could be currently trading at a very low price when comparing to CHTR’s average historical P/E Ratio range.
CHTR does not currently pay a regular dividend.
BTMA Stock Analyzer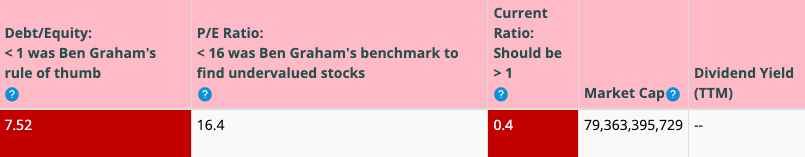
This analysis wouldn’t be complete without considering the value of the company vs. share price.
Value Vs. Price
For valuation purposes, I will be using a conservative 24.47. I’ve used various past averages of growth rates and PE Ratios to calculate different scenarios of valuation ranges from low to average values. The valuations compare growth rates of EPS, Book Value, and Total Equity.
In the table below, you can see the different scenarios, and in the chart, you will see vertical valuation lines that correspond to the table valuation ranges. The dots on the lines represent the current stock price. If the dot is towards the bottom of the valuation range, this would indicate that the stock is undervalued. If the dot is near the top of the valuation line, this would show an overvalued stock.
BTMA Wealth Builders Club BTMA Wealth Builders Club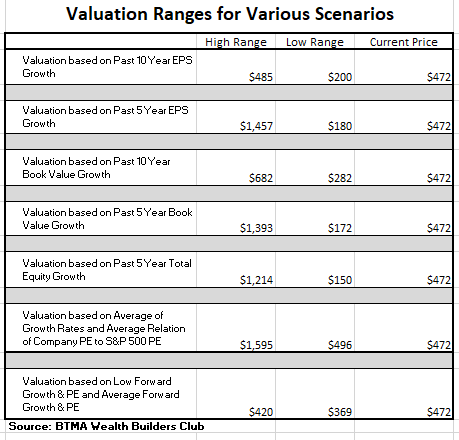
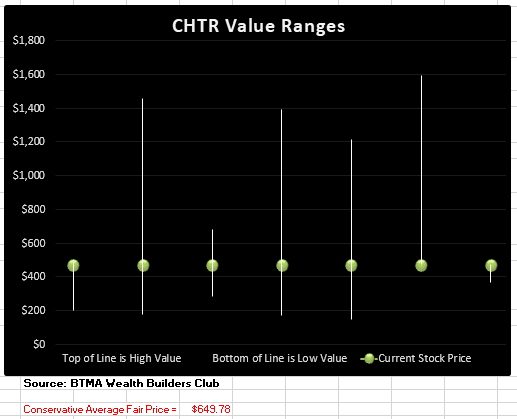
According to this valuation analysis, CHTR is undervalued.
- If CHTR continues with a growth average similar to its past 10 years earnings growth, then the stock is overpriced at this time.
- If CHTR continues with a growth average similar to its past 5 years earnings growth, then the stock is undervalued at this time.
- If CHTR continues with a growth average similar to its past 10 years book value growth, then the stock is fairly priced at this time.
- If CHTR continues with a growth average similar to its past 5 years book value growth, then the stock is undervalued at this time.
- If CHTR continues with a growth average similar to its past 5 years total equity growth, then the stock is undervalued at this time.
- According to CHTR’s typical PE ratio relation to the S&P 500’s P/E Ratio, CHTR is undervalued.
- If CHTR continues with a growth average as forecasted by analysts, then the stock is overpriced.
This analysis shows an average valuation of around $650 per share versus its current price of about $472, this would indicate that Charter Communications is undervalued.
Forward-Looking Conclusion
According to the facts, Charter Communications is far from financially healthy. It will need time and lots of improvement to eat away at its over-reached long-term debt situation. The short term isn’t much better as shown by its poor current ratio.
Other fundamentals including ROE, ROIC, and EPS haven’t been consistent or at satisfactory levels over the past 5 years, but at least these fundamentals have been on an upward trend. The other silver lining is the impressive and consistent gross margin percent.
In terms of value, my valuation analysis shows that the stock is undervalued.
Now, let’s examine how CHTR has performed against the US stock market benchmark (S&P 500). You can see from the chart below that CHTR has easily outperformed the market over the past 10 years.
It’s impressive that this stock has the potential to return more than twice the amount as the S&P 500 over the long haul. CHTR’s substantial gains remind me that this stock’s return potential and undervalued position could make this stock worth investing in despite its risks.
Morningstar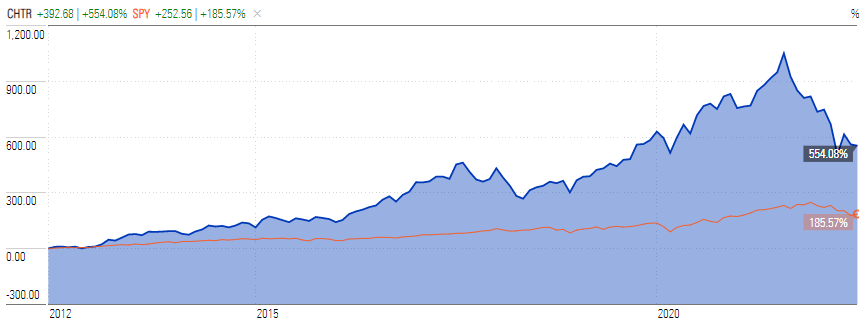
Predicted Growth
“Over the next five years, the analysts that follow this company are expecting it to grow earnings at an average annual rate of 30.92%. This year, analysts are forecasting earnings increase of 26.40% over last year. Analysts expect earnings growth next year of 16.80% over this year’s forecasted earnings”
(Source: Forecast Earnings Growth)
If you invest today, with analysts’ forecasts, you might expect about 16.8% growth per year.
Here is an alternative scenario based on CHTR’s past earnings growth. During the past 10 and 5-year periods, the average EPS growth rate was about 5.02% and -6.42%, respectively.
But when considering cash flow growth over the past 10 and 5 years, the growth has been 48% and 16%, respectively.
If considering actual past results of Charter Communications, the story is a bit different. Here are the actual 10 and 5-year return results.
_______________
10 Year Return Results if Invested in CHTR:
Initial Investment Date: 7/9/2012
End Date: 7/9/2022
Cost per Share: $79.65
End Date Price: $463.55
Total Return: 481.98%
Compound Annualized Growth Rate: 19%
_______________
5-Year Return Results if Invested in CHTR:
Initial Investment Date: 7/9/2017
End Date: 7/9/2022
Cost per Share: $332.43
End Date Price: $463.55
Total Return: 39.44%
Compound Annualized Growth Rate: 7%
_________________
From these scenarios, we have produced results from 7% to 19%. I feel that if you’re a long-term patient investor and believer in Charter Communications, and its existing services (internet access, phone services, and cable television to roughly 40% of the country), you could expect CHTR to provide you with around at least 10% annual return. It wouldn’t be unrealistic to see returns around 20% though as the company has proven its return potential in the past.
With its merger in 2016, it owns almost half the US TV cable market (2nd to Comcast (CMCSA)). While cable TV has slim margins to work with, Charter’s real bread and butter may prove to be converting these cable customers into internet customers. Internet services have much better margins and more people are cutting the cable cord in lieu of internet and streaming options. Plus, internet has become more of a utility-like necessity, therefore it should make Charter Communications more recession-resistant in the future.
In addition, Charter can and does charge lower costs for wireless services, as compared with AT&T (T) and Verizon (VZ). Investment Management Associates explains that this is because AT&T and Verizon have huge costs for building and maintaining the infrastructure of wireless networks, whereas Charter is a mobile virtual network operator (MVNO). Therefore, it buys bulk bandwidth from companies like Verizon at wholesale prices and can sell its wireless services at a discount without the costs and risks that Verizon and AT&T take on.
Let’s be clear, I wasn’t too excited about Charter Communications in the beginning of my analysis when considering the inconsistent fundamentals. But, after seeing the upsides of this company, they reduce much of the risk.
First, the inconsistent fundamentals have been caused mostly by the added debt from the large merger of 2016. Since then, most of these fundamentals have been improving. While Charter still has a hefty amount of debt, it is using this debt responsibly to grow the company and to return value back to shareholders by buying back stock at discounted prices.
Next, the stock’s impressive growth potential of 20% and beyond is enticing and further reduces risk. Finally, the stock is selling at a heavily discounted bargain price, which adds more protection for the conservative investor. Considering these factors, I am considering a position in this dominant cable and internet service business.
Be the first to comment