

MF3d/E+ via Getty Images
VMBreakouts.com
CFO Trading Anomaly For April: Revealing Top Insider Buys In Declining Markets
Introduction
At the request of long time members, this article builds on my analysis of prior live testing of the CFO Insider trading anomaly study that began at the start of April 2019. The purpose today is to examine the CFO response to the declining markets and growing recessionary concerns with rising inflation and interest rates. Currently, the S&P 500 is down -7.86%, the Nasdaq down -14.78%, and the Russell 2000 down -11.36%. Leveraging what we have learned in the research of the V&M Library, I will explore what CFO insider behavior may be revealing to us today.
Insiders might sell their shares for any number of reasons, but they buy them for only one: they think the price will rise. – Peter Lynch
Background on the CFO Trading Anomaly
When it comes to knowledgeable trading — instinctively, we know that corporate insiders have the best information to conduct potentially profitable purchases and sales of their company stock. The basis of the CFO insider trading anomaly stems from a number of key findings in scholarly financial literature to harness the best performance results:
- “Insiders have far superior knowledge about the company and the industry than the market” (Singal, 2004, p. 134)
- “CFOs derive statistically and economically higher abnormal returns from their purchases of company shares than do CEOs. Furthermore, CFOs’ excess return is robust to controlling for risk factors. (Wang, Shin, & Francis, 2012, p. 758).
- “Our results are consistent with CFOs utilizing more (superior) information in their purchase transactions compared to CEOs. The excess returns by CFOs persist even after the trading information is made public, suggesting that the market is slow in incorporating the information in CFOs’ trades” (Wang, Shin, & Francis, 2012, p. 758).
- “A firm is likely to perform better following an insider buying month than an insider selling month. Overall, it can be seen that stocks of firms where insiders have been actively buying outperform stocks where insiders have been actively selling. The difference in returns over the subsequent twelve-month period varies from 4.8 percent to 18.7%.” (Singal, 2004, p. 139).
If we want additional trading advantages, it makes sense to look to insiders’ trading behaviors. If we want to harness the best possible results, it makes sense to look at the most successful group of insiders, namely CFOs, according to published research. If we want to find the best results from the CFOs, we begin to analyze their purchases in the research that follows. Additional discoveries have further enhanced the selection criteria for the best results among CFO Insider purchases. This trading variable plays a part in the more than 75 variables tested over the years since publishing my original MDA research analysis.
Documented Anomaly Results
The results of my studies on the CFO anomaly can be found in Section 11 of the V&M Breakout Library exclusive for members. In summary my live tests for members confirmed published peer-reviewed studies and revealed additional insights for our trading benefit.
“Most of the outperformance by CFOs occurs in the first 9 months, especially the first 3 months after they buy stocks. After their purchases, CFOs on average outperform CEOs by 2.58% in months 1-3, 1.17% in months 4-6, and 1.02% in months 7-9.” (Wang, Shin, Francis, 2012, p. 744)
Because prior financial research has shown that CFOs and CEOs outperform all other insiders based on their purchase histories, this live trading study is focused on the CFOs, in particular. CFOs have been well documented to outperform CEOs and all other qualified insiders who are required to submit Form 4 to the SEC, typically we are most likely to see the best results among this data sample.
“Approximately one-quarter of the abnormal returns on [CFO] purchases were yielded in the first five days, and half of the abnormal returns were yielded in the first month” (Jeng, Metrick, and Zeckhauser, 2003)
According to Jeng, et al (2003), the effects occur quickly in the first months of CFO purchase data for abnormal returns. Wang et al. (2012) documented that the first 3 months were the strongest period for initial abnormal returns. The total returns in the first four months of this study are documented below.
VMBreakouts.com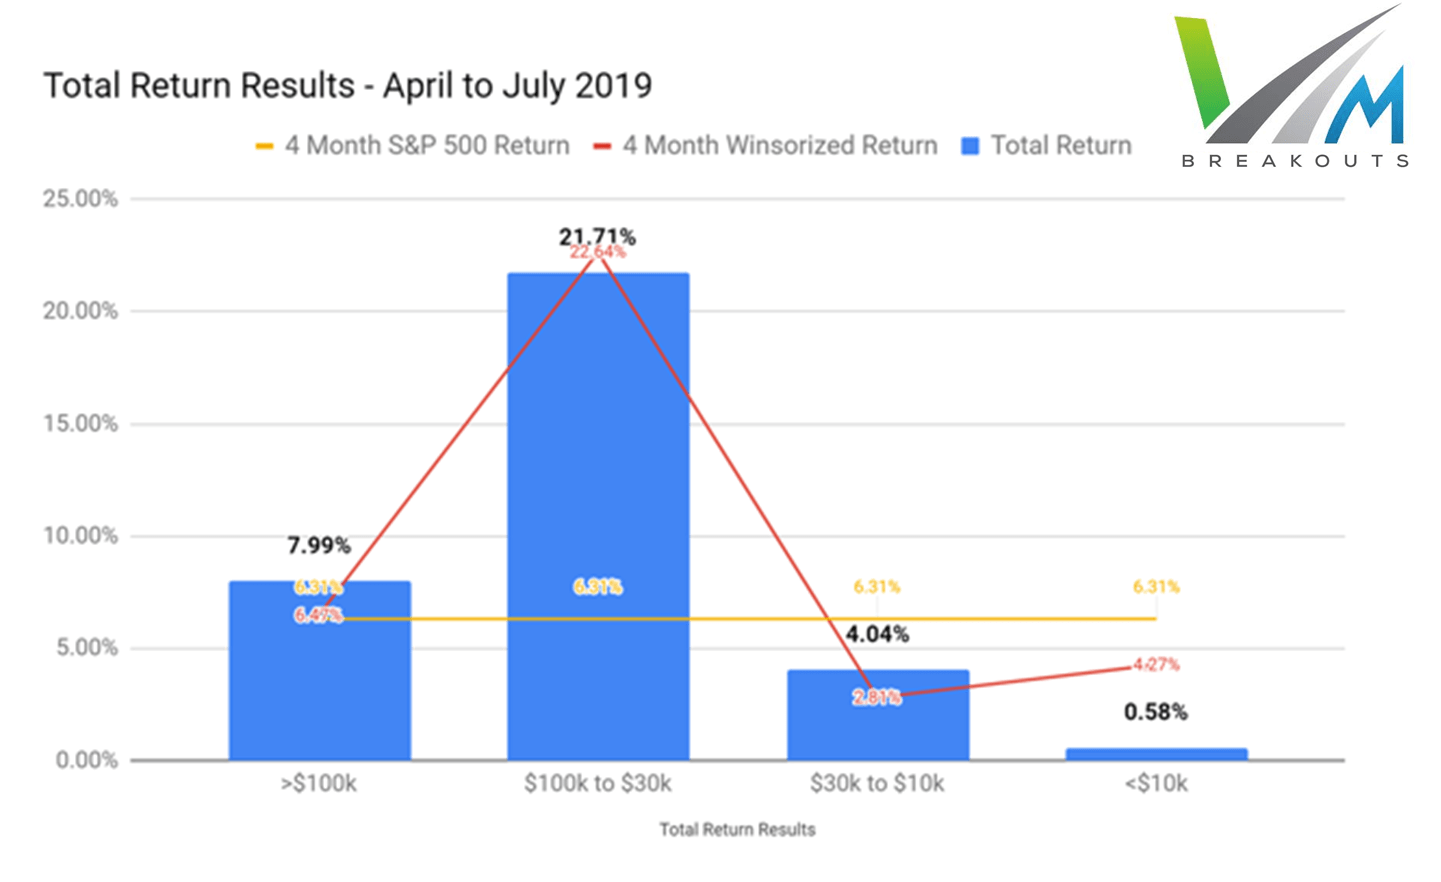
| Total Return Results | >$100k | $100k to $30k | $30k to $10k | <$10k |
| 4 Month Total Return | 7.99% | 21.71% | 4.04% | 0.58% |
| 4 Month Winsorized Return | 6.47% | 22.64% | 2.81% | 4.27% |
| 4 Month S&P 500 Return | 6.31% | 6.31% | 6.31% | 6.31% |
My study found that CFO purchases between $30k – $100k were by far the most significant CFO purchase ranges for profits even after outliers are removed through a Winsorized process. More confirmation was also evident that you should avoid CFO insider purchases of less than $10k per transaction.
The results further confirmed prior peer-reviewed studies that discovered unusually strong performance results by CFOs.
Current 2022 Market Conditions
An application of the CFO trading anomaly can reveal additional insights about expected market conditions among the most knowledgeable insiders. I will begin broadly and then move more specifically into individual stocks.
Net Insider Buy/Sell Ratio in dollars the past 5 years
First, examining the total insider buy/sell ratios over the past 5 years shows that total insider buying tends to increase as the S&P 500 decreases. So far the chart below indicates that the buy ratio is more elevated into 2022 than it has been since the Covid correction in early 2020. However, not all insider buying is equal or produces the outsized gains that CEO/CFOs generate across many studies in the long term.
SECForm4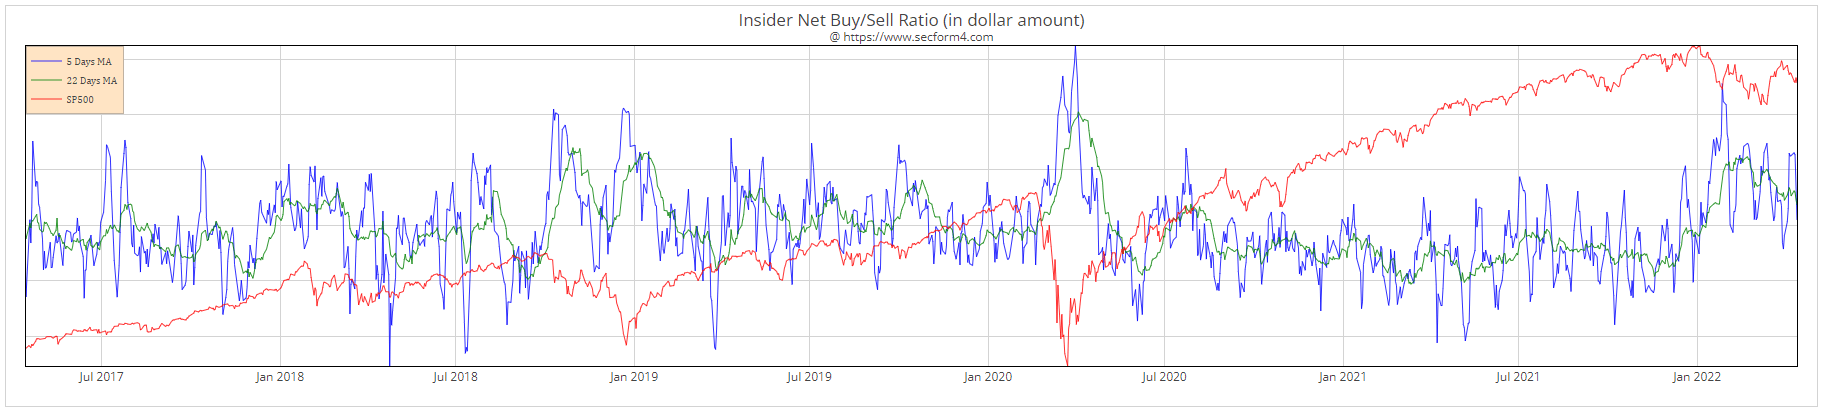
Net Insider Buys & Sells in dollar amount the past 2 years
On closer examination, the net buying of stocks by insiders peaked in March near the lows of the S&P 500 and has since fallen off significantly into April. Additionally, net selling dropped off to the lowest levels in January and February since the Covid correction. The fact that total insider selling has picked up again suggests less optimism for market rebounds than insiders had in early 2022.
SECForm4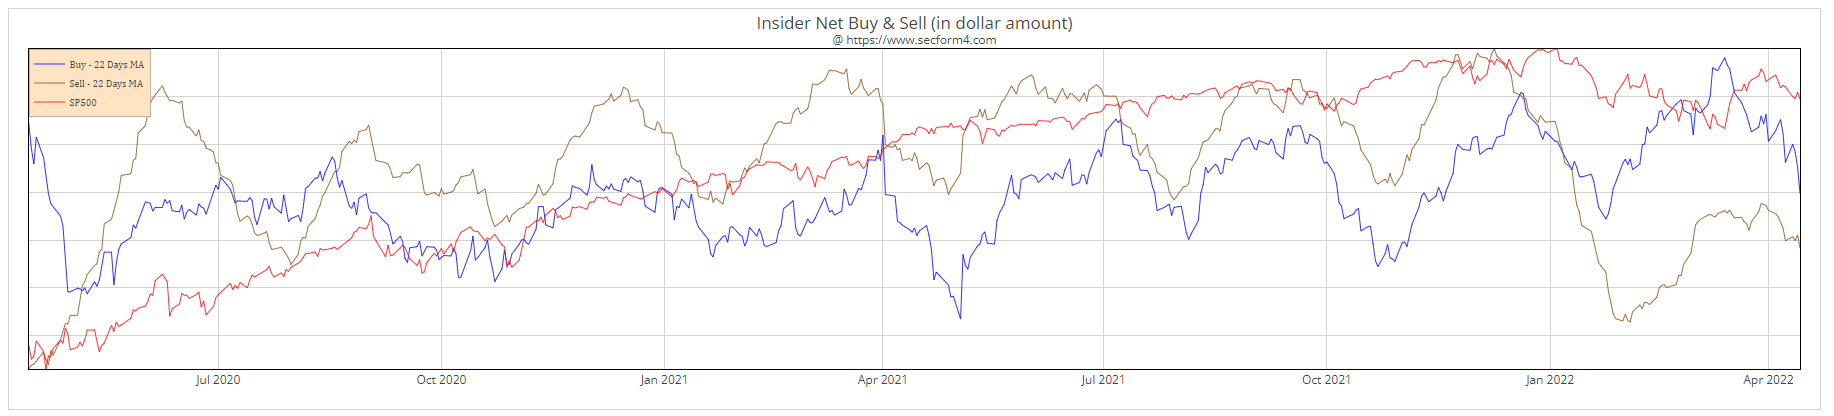
Looking more specifically at the CFO insider buys/sells the last 30 days, we can see that CFO’s are much larger net sellers than net buyers. This is generally true year round as CFO’s frequently cash out stock holdings as part of their compensation packages and is not unusual to see large dollar values. What is more unusual is to see that total CFO purchases of their own companies is extremely low in the past month relative to typical CFO purchases during much more positive market conditions over the years. This decline in dollar purchases certainly reflects CFO risk-off conditions with relatively few large purchases in the past 30 days.
Top 20 CFO insider buys/sells the last 30 days
SECForm4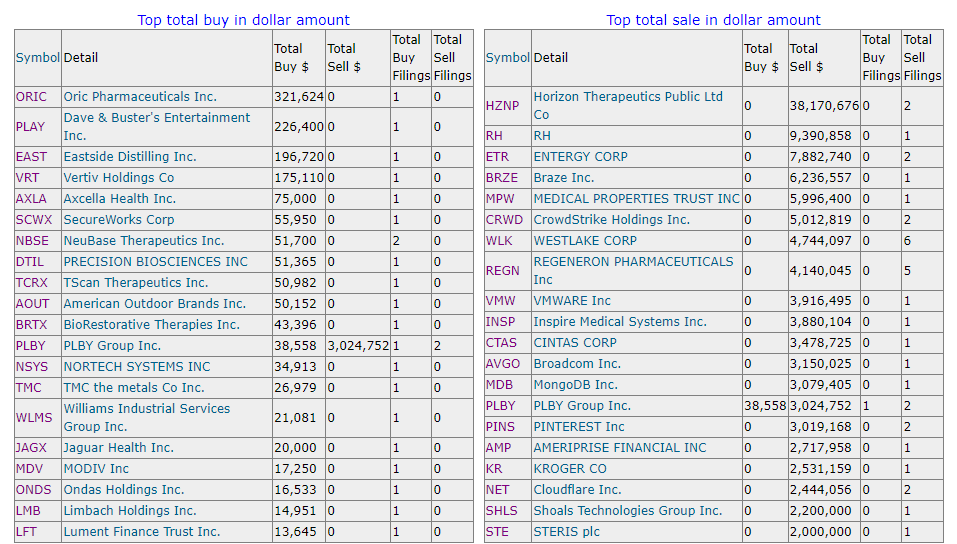
In fact, the SEC Form 4 database report shows there has not been a single $1 million CFO share purchase in over 40 days and only 3 so far into 2022. One of the three purchases was a buyout and is no longer listed. The other 2 major purchases by CFO insiders this year are Parsons Corp (PSN) and AES Corp (AES) and no other major purchases in the past month. Of the 20 largest stock buys by CFO insiders listed above, fully half, 10 stocks come out of only 2 sectors – Technology and Healthcare. Additionally, 17 of the stocks purchased above all have market caps below $469 million in the small cap segment and as tiny as $16 million micro market cap. This is consistent with documented CFO behavior that tends to concentrate profitable trades in small cap stocks:
“We also find that CFOs’ outperformance concentrates in smaller firms, consistent with Lakonishok and Lee (2001), with CFOs obtaining higher abnormal returns in the smallest 3 size quartiles, but not in the highest size quartile.” (Wang, Shin, Francis, 2012, p. 745)
Interestingly the observation by Wang et al. (2012) that the best CFO returns are among the smaller firms is also confirmed by the purchasing behavior of the most successful hedge funds.
In my article series: Cracking The Hedge Fund Code Part I and Part II according to Cao et al. (2018), they found that the average market cap of hedge fund owned stocks is $980 million with a small standard deviation of 2.33. Whereas the full institutional ownership sample (other than hedge funds) had an average market cap of $2.67 billion with a larger standard deviation of 13.51.
The three largest stocks in the past 30 days ranging in market cap from $1.13 billion to $4.93 billion are listed below. These would fit the CFO pattern of lower risk and lower return compared to the very small cap high risk/high returns of the 17 other stocks:
| Ticker | Company | Sector | Industry | Market Cap | Price |
| (VRT) | Vertiv Holdings Co | Industrials | Electrical Equipment & Parts | 4.93B | 12.38 |
| (PLAY) | Dave & Buster’s Entertainment, Inc. | Consumer Cyclical | Restaurants | 2.23B | 45.98 |
| (SCWX) | SecureWorks Corp. | Technology | Software – Infrastructure | 1.13B | 13.24 |
Of the 20 largest purchases by CFO insiders in the last month, 16 of the companies are negative YTD with only (ONDS), (BRTX), (PLAY), and (REPX) producing any positive returns YTD. The full list is below with performance results for the past week and the past month included. These very few bullish CFOs in April may have special insight on their company’s long term potential, but the majority of returns from these top purchases reflect strong initial declines.
| Ticker | Company | Sector | Market Cap | Perf Week | Perf Month | Price |
| (PLAY) | Dave & Buster’s Entertainment, Inc. | Consumer Cyclical | 2.31B | 17.98% | 10.03% | 47.71 |
| (AXLA) | Axcella Health Inc. | Healthcare | 100.90M | 12.21% | -23.11% | 1.93 |
| (ONDS) | Ondas Holdings Inc. | Technology | 298.68M | 9.20% | 15.77% | 7.12 |
| (TCRX) | TScan Therapeutics, Inc. | Healthcare | 61.30M | 8.70% | -24.92% | 2.5 |
| (NSYS) | Nortech Systems Incorporated | Technology | 27.91M | 6.53% | -9.72% | 10.65 |
| (LFT) | Lument Finance Trust, Inc. | Real Estate | 143.07M | 1.12% | -11.11% | 2.72 |
| (AOUT) | American Outdoor Brands, Inc. | Consumer Cyclical | 179.92M | -0.29% | -7.41% | 13.61 |
| (SCWX) | SecureWorks Corp. | Technology | 1.09B | -1.77% | 12.91% | 12.77 |
| (MDV) | Modiv Inc. | Real Estate | – | -2.07% | 2.79% | 18.45 |
| (REPX) | Riley Exploration Permian, Inc. | Energy | 457.79M | -3.33% | 4.11% | 26.1 |
| (LMB) | Limbach Holdings, Inc. | Industrials | 68.42M | -4.89% | -3.56% | 6.51 |
| (JAGX) | Jaguar Health, Inc. | Healthcare | 43.97M | -6.38% | 0.26% | 0.54 |
| (WLMS) | Williams Industrial Services Group Inc. | Industrials | 46.63M | -10.32% | 13.00% | 1.7 |
| (VRT) | Vertiv Holdings Co | Industrials | 4.81B | -10.93% | -8.77% | 12.06 |
| (NBSE) | NeuBase Therapeutics, Inc. | Healthcare | 51.26M | -11.76% | -13.79% | 1.5 |
| (BRTX) | BioRestorative Therapies, Inc. | Healthcare | 18.28M | -14.46% | 20.65% | 4.85 |
| (TMC) | TMC the metals company Inc. | Basic Materials | 438.58M | -16.29% | -33.45% | 1.85 |
| (DTIL) | Precision BioSciences, Inc. | Healthcare | 152.87M | -17.07% | -29.59% | 2.38 |
| (ORIC) | ORIC Pharmaceuticals, Inc. | Healthcare | 160.48M | -23.02% | -41.48% | 3.88 |
| (EAST) | Eastside Distilling, Inc. | Consumer Defensive | 15.56M | -25.93% | 10.25% | 1 |
No stocks were represented in this sample from the Utilities, Communication Services, or Financial sectors. With this small sample it is difficult to be conclusive, but it shows that CFO’s in those sectors are not loading up in any meaningful way on shares of their own companies in the past 30 days. My own interpretation of the April data is that we are in a risk-off environment and CFO’s are behaving more risk averse than the broader insider charts show at the beginning of this analysis. If CFO’s are the best judge of when to buy their own companies, then their behavior suggest continued caution into 2022.
Conclusion
This review of the CFO anomaly in April shows a strong relative decline in dollar amount purchases by CFOs. This may reflect growing concern about the market outlook and the increased risks from buying shares in the companies they manage. Of the declining number of large CFO purchases there is a remarkably high level of activity in the Healthcare and Technology sectors that are down -6.25% and -18.63% YTD in 2022 among the hardest hit sectors. Total insider purchases have increased into 2022 at the highest levels since the 2020 Covid correction.
However, the most informed of insiders, namely the CFO’s, show relatively low activity and dollar amount purchases of their firms. Of all the documented insiders the CEOs and CFOs show the most profitable trading results among many published studies.
CFOs outperform CEOs by 4.62% in purchases. Again, most of the outperformance occurs in the first 9 months and especially in the first 3 months of the accumulation period. (Wang, Shin, Francis, 2012)
I highly recommend you combine other factors in any purchase decision of the CFO insider anomaly stocks. You can find much more in the members V&M Library on this subject and other anomalies. Research experts may appreciate that my prior studies avoid all back-testing that is prone to errors, to data-mining tricks that may harness favorable historical peaks/valley timing of market pricing, and to other such arbitrary adjustments that tend to achieve seemingly significant results.
Prior articles on this active anomaly research study can be found here:
- CFO Insider Trading Anomaly For June: Biggest Buys Yielding Best Returns
- CFO Insider Trading Anomaly: April Results +4.53%
- Top 10 CFO Insider Stocks Ranked By 6 Quantitative Models For May
- CFO Insider Trading For July: 7.85% Total Returns Confirm Anomaly Persistence
I trust these articles examining the unique financial anomaly greatly benefit your trading results in the years to come!
All the very best to you in your investment decisions!
JD Henning, PhD, MBA, CFE, CAMS
References
Jeng, L. A.; A. Metrick; and R. Zeckhauser. “Estimating the Returns to Insider Trading: A Performance Evaluation Perspective.” Review of Economics and Statistics, 85 (2003), 453-471.
Ke, B.; S. Huddart; and K. Petroni. “What Insiders Know about Future Earnings and How They Use It: Evidence from Insider Trades.” Journal of Accounting and Economics, 35 (2003), 315-346.
Lakonishok, J., and I. Lee. “Are Insider Trades Informative?” Review of Financial Studies, 14 (2001),79-111.
Wang, W., Shin, Y. C., & Francis, B. B. (2012). Are CFOs’ trades more informative than CEOs’ trades?. Journal of Financial and Quantitative Analysis, 47(4), 743-762. Doi: 0.1017/S0022109012000257.
Be the first to comment