

naphtalina/iStock via Getty Images
(This article was co-produced with Hoya Capital Real Estate)
Introduction
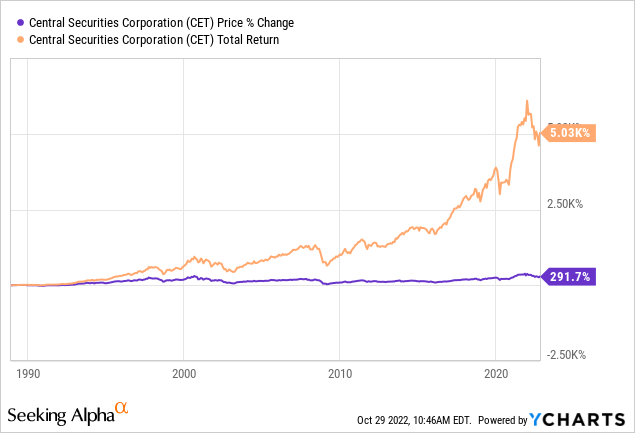
Many, if not most, equity investors would love to find a fund that consistency “beats the market,” commonly defined as the S&P 500 Index, even if only to supplement their exposure that an exchange-traded fund (“ETF”) like the SPDR S&P 500 Trust (SPY) provides. Since late 1993, the Central Securities CEF (NYSE:CET) closed-end fund (“CEF”) has done that, with the caveat that its StdDev has been higher.
In this article, I will review both funds and provide comparisons for investors who might consider CET as means of “beating the market”; represented here by SPY.
Central Securities Corporation review
Seeking Alpha describes this CEF as:
The Company’s primary investment objective is growth of capital. The Fund invests primarily in common stocks, but it may invest in bonds, convertible bonds, preferred stocks, convertible preferred stocks, warrants, options real estate, or short-term obligations of governments, banks and corporations. The Company, from time to time, invests in securities, the resale of which is restricted. The firm employs long term investment strategy to make its investments. CET started just weeks before the October 1929 stock market crash!
Source: Seeking Alpha.
CET has just over $1b in assets under management (“AUM”), and the managers charge 66bps in fees and does not use leverage. Income investors need not consider it, as the yield is heavily dependent on capital gains: more on that later.
The Central Securities Corporation was organized on October 1, 1929, and has operated as a closed-end management investment company. The following investment philosophy points were found on their website.
- The Corporation’s investment objective is long-term growth of capital. Income received from investments is a secondary consideration.
- Central owns a limited number of companies, and it invests for the long-term. We may sell securities for a variety of reasons, including excessive valuation, deteriorating results or to redeploy assets into more promising opportunities.
- Central is not restricted as to the types of securities (e.g., equity, fixed income) in which it invests. We may invest in securities of issuers with any market capitalization. Central is not required to be fully invested in securities and generally maintains a portion of its total assets in cash and securities considered to be cash equivalents.
Holdings review
The most recent data for CET is from June 30, 2022. Based on posted reports, I do not expect the next full holdings report until early 2023.
centralsecurities.com/220630 Semi_Annual.pdf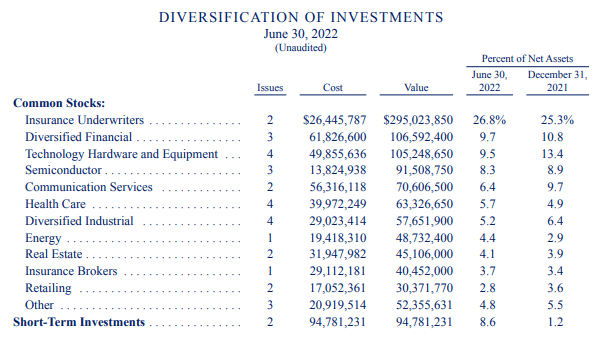
As CET stated, they own a limited number of securities, and tend to hold them for years. The next table shows the portfolio changes from the 1st quarter.
centralsecurities.com/220630 Semi_Annual.pdf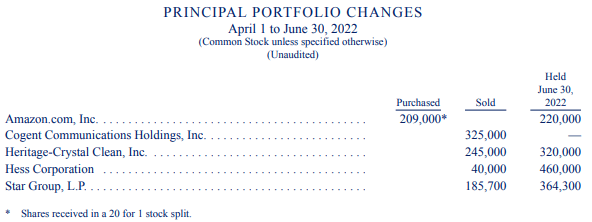
That long-term philosophy also shows when looking at the 10 largest holdings, the newest being from 2020.
centralsecurities.com/220630 Semi_Annual.pdf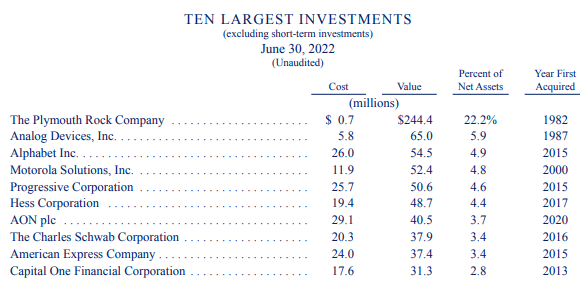
Pulling data from that semi-annual report provides a complete listing from Q2.
| Sector | Holdings w/ shares | Weight |
| Banks 2.4% | ||
| 230,000 JPMorgan Chase & Co | 2.35% | |
| Communications Services 6.4% | ||
| 25,000 Alphabet Inc Class A | 4.94% | |
| 100,000 Meta Platforms, Inc Class A | 1.46% | |
| Diversified Financial 9.7% | ||
| 270,000 American Express Company | 3.40% | |
| 300,000 Capital One Financial Corporation | 2.84% | |
| 600,000 The Charles Schwab Corporation | 3.44% | |
| Diversified Financial 9.7% | ||
| 400,000 AerCap Holdings NV | 1.49% | |
| 240,000 Brady Corporation Class A | 1.03% | |
| 320,000 Heritage-Crystal Clean, Inc | 0.78% | |
| 54,000 Roper Technologies, Inc | 1.93% | |
| Energy 4.4% | ||
| 460,000 Hess Corporation | 4.42% | |
| Health Care 5.7% | ||
| 90,000 Johnson & Johnson | 1.45% | |
| 185,000 Medtronic plc | 1.51% | |
| 200,000 Merck & Co, Inc | 1.65% | |
| 300,000 Roche Holding AG ADR | 1.14% | |
| Insurance Brokers 3.7% | ||
| 150,000 Aon plc Class A | 3.67% | |
| Insurance Underwriters 26.8% | ||
| 28,424 The Plymouth Rock Company Class A | 22.18% | |
| 435,000 Progressive Corporation | 4.59% | |
| Real Estate 4.1% | ||
| 1,000,000 Kennedy-Wilson Holdings, Inc | 1.72% | |
| 700,000 Rayonier Inc | 2.37% | |
| Retailing 2.8% | ||
| 220,000 Amazon.com, Inc | 2.12% | |
| 11,000 Mercadolibre, Inc | 0.64% | |
| Semiconductor 8.3% | ||
| 445,000 Analog Devices, Inc | 5.90% | |
| 420,000 Intel Corporation | 1.43% | |
| 170,000 Wolfspeed, Inc | 0.98% | |
| Software and Services 2.1% | ||
| 90,000 Microsoft Corporation | 2.10% | |
| Technology Hardware/Equip 9.5% | ||
| 335,000 II-VI Incorporated | 1.55% | |
| 200,000 Keysight Technologies, Inc | 2.50% | |
| 80,000 MKS Instruments, Inc | 0.74% | |
| 250,000 Motorola Solutions, Inc | 4.75% | |
| Utilities 0.3% | ||
| 364,300 Star Group, LP | 0.30% | |
| Cash Assets 8.60% | ||
| Fidelity Money Market Fund | 3.20% | |
| Principal US Treasury Bills | 5.40% |
CET has owned Plymouth Rock since its founding in 1982. The following statement provides guidance on how this private company holding is evaluated.
In valuing the Plymouth Rock Level 3 investment as of June 30, 2022, management considered Plymouth Rock’s financial condition and results of operations, the insurance industry outlook, and any transactions in Plymouth Rock’s shares. Management used significant unobservable inputs to develop a range of values for the investment. It used a comparable company approach that utilized the following valuation multiples from selected publicly traded companies. Management also used Plymouth Rock’s book value and a discounted cash flow model. The average of these values was then discounted for lack of marketability and control of the Plymouth Rock shares. Management considered a discount range of 30% to 40%, a range management believes market participants would apply.
Source: centralsecurities.com.
Understanding Plymouth Rock Assurance
Plymouth Rock was established nearly four decades ago to offer its customers a higher level of service and a more innovative set of products and features than they had come to expect from insurance companies. It is no accident that ever since then top-quality service to our customers, our agents, our employees, and our communities has been our hallmark.
We attribute much of our success over the years to this stalwart commitment. Our companies now write and manage more than $1.7 billion in auto and home insurance premiums across Massachusetts, New Jersey, Connecticut, New Hampshire, New York and Pennsylvania. The insurance industry’s premier independent rating service, A.M. Best, has given our group a financial rating of Excellent.
Source: Plymouth Rock.
While the common shares of The Plymouth Rock Company are not publicly traded, CET gets an independent appraisal, performed by Shields & Company, Inc., a local investment banking firm. Here is a list of annual values: Stock Values. Also, this data was available in the 2021 Annual Report:
plymouthrock.com Annual-Report.pdf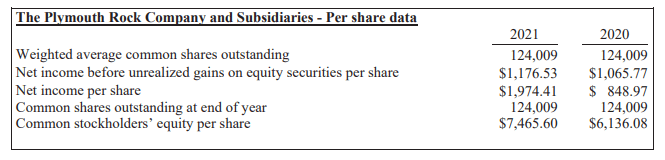
Currently, CET owns about 23% of Plymouth Rock, which is down from 38% back in 2010. The current share count has not changed since 2015, when CET sold 6,000 shares back to the company.
Distribution review
This is how CET explains their policy:
Central Securities’ dividend and distribution policy is to pay out substantially all net investment income and realized capital gains. The amount of our dividends and distributions may vary significantly from year to year.
It has been the Corporation’s policy to make two payments to holders of Common Stock each year. A smaller cash payment is generally made at mid-year, and a distribution consisting primarily of realized capital gains is made at year-end when available. Stockholders have been given the opportunity of receiving the year-end distribution either in additional shares of stock or in cash, at their election.
Source: centralsecurities.com.
seekingalpha.com CET DVDs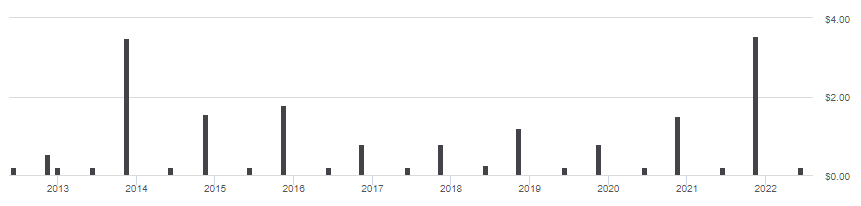
Most of the 2021 payout came from capital gains, none from ROC.
centralsecurities.com/2021TaxNotice.pdf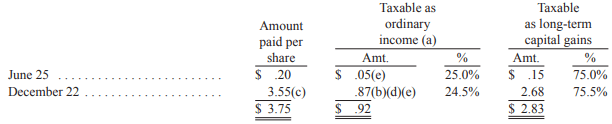
Prior year tax information shows roughly the same results.
Price and NAV review
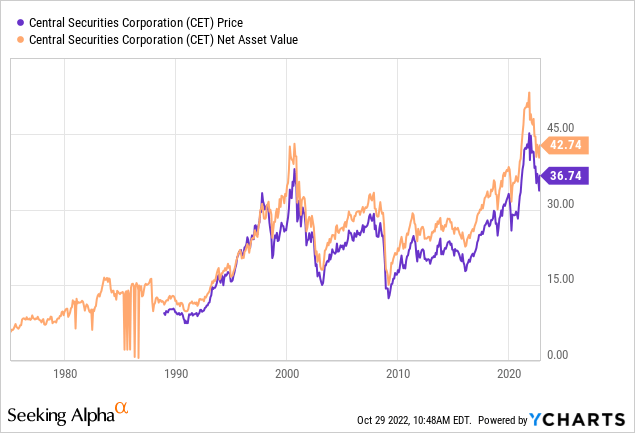
Until the recent setback, both price and NAV have done very well since the GFC of 2008-09. The next chart gives a better view of the price/NAV relationship.
CEFConnect.com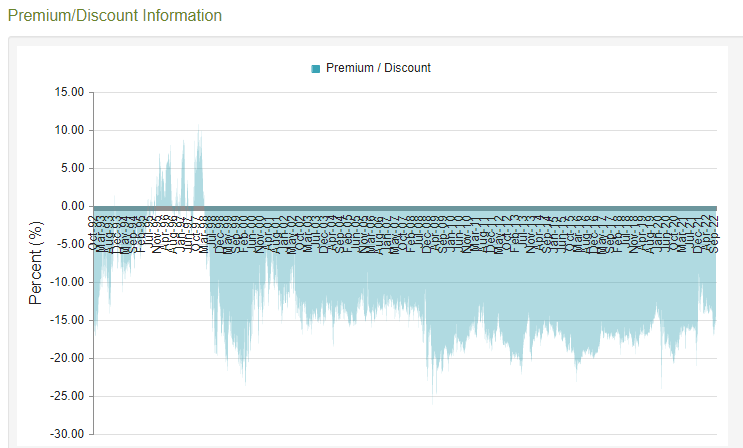
It has been a long time since CET traded at a premium. Except for a brief time in late 2021/early 2022, a discount below 10% was even rare. The current 14% discount is in the middle of what appears to be 10-20% range. The current Z-score for 1-year is about -.1. Since CET adjusts their largest holding down 20%, that alone could account for up to 4-5% of the constant discount (or not).
SPDR S&P 500 Trust ETF review
The SPY ETF invest based off the S&P 500 Index. While not the oldest and maybe not best known, professional investors prefer it over the Dow Jones Industrial Average for its breadth and market-cap weighting.
SPY has about $326b in AUM and has a 1.06% yield. The managers still charge 9bps in fees, 3X what the Vanguard S&P 500 ETF (VOO) charges!
Holdings review
seekingalpha.com SPY sectors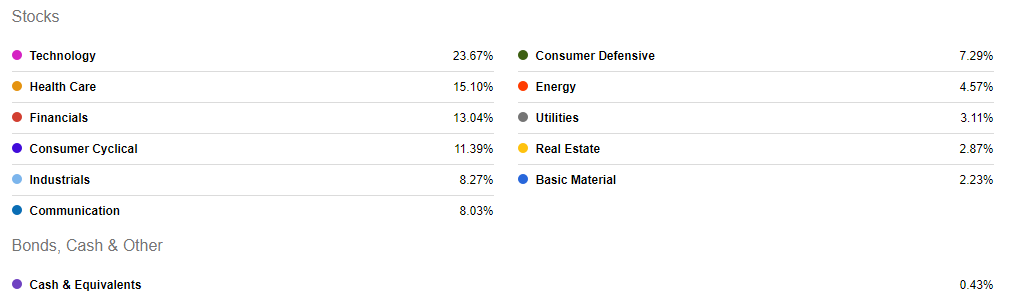
While Technology is the dominate sector, the weight is down 3% from the end of the 3rd quarter; Financials are up 2%. Here is how CET and SPY align for sector allocations.
multiple sites; compiled by author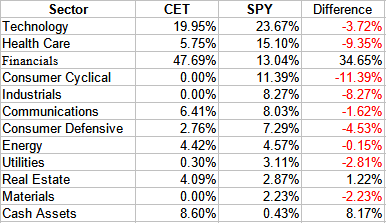
The Financials weight for CET is the result of Plymouth Rock. Surprisingly, the Tech weight is close. CET also had 8% in cash ready to employ at the end of the 2nd quarter.
The recent Top 10 were comprised of:
ssga.com SPY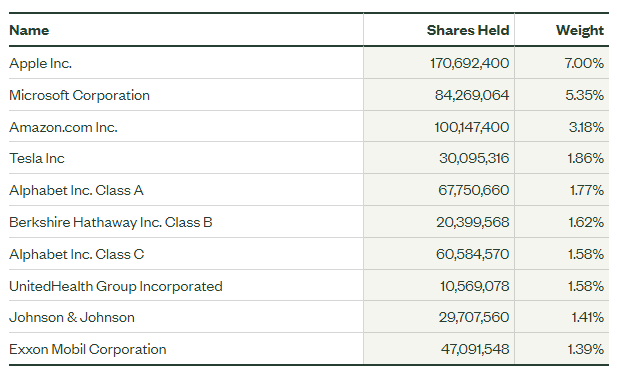
While the order changed a little, the set of stocks matches the end of the 3rd quarter, with a 1% drop in the concentration there.
Distribution review
seekingalpha.com SPY DVDs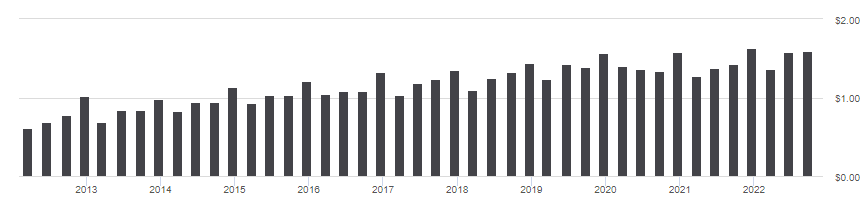
Dividends have grown at a 5+% rate over the past five years, over 8% in the past decade. Like CET, it is not a fund for income seekers.
Portfolio strategy
There are three common reasons investors would pick a CEF over an ETF:
- The benefit leverage should supply in a Bull market, though that doesn’t apply here as CET is unlevered.
- The possibility of buying assets at a discount, which enhances both yield and returns compared to paying “full price”. As shown above, CET does that.
- The desire to own an asset that will outperform a broad market index as most CEFs are actively managed versus most ETFs being passive. The next chart provides this answer.
portfoliovisualizer.com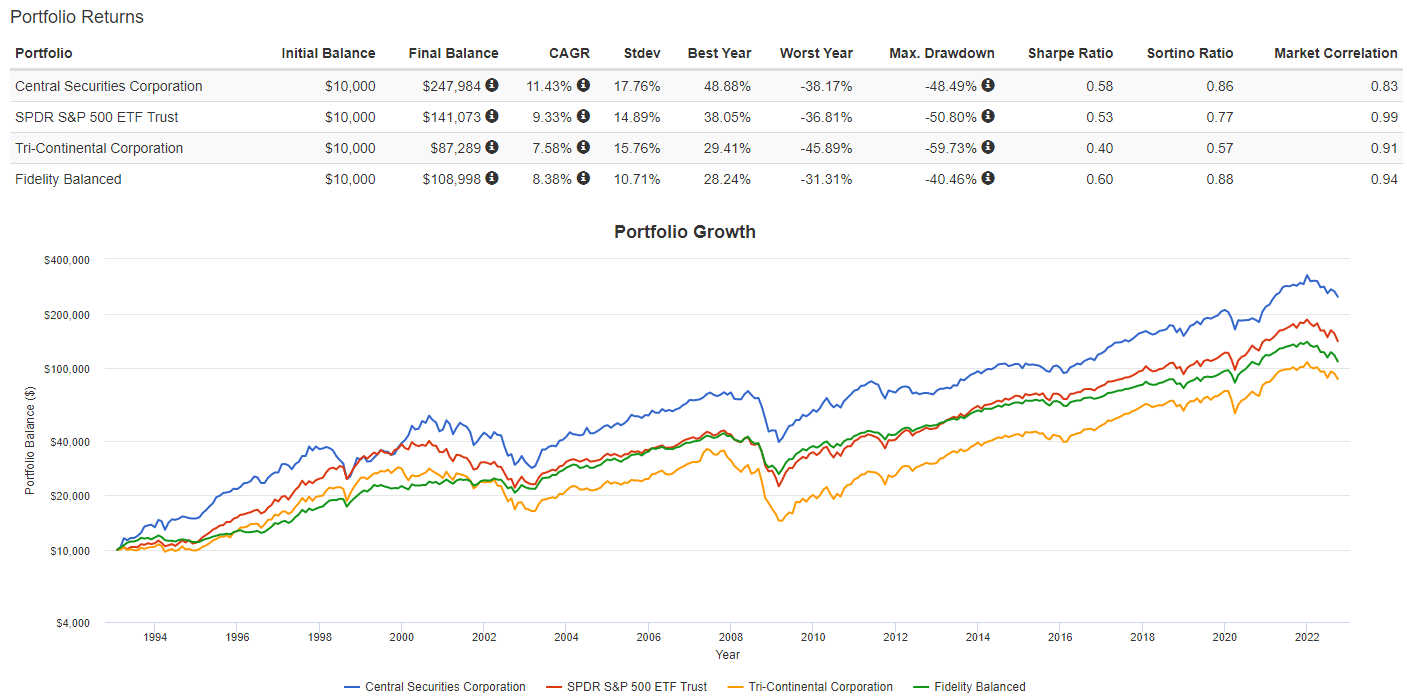
Along with SPY, I included another CEF that dates back to 1929, the Tri-Continental Corporation (TY), and the Fidelity Balanced Fund (FBALX) a balanced mutual fund since CET said they could (but do not currently) own fixed income assets. The data points out two important factors when deciding on what asset to own:
- Return wise, CET is the clear winner since 1993, over 200bps ahead of SPY, the 2nd place choice.
- Risk wise, FBALX was the best and its Sharpe and sortino ratio are slightly ahead of CET’s values.
For investors willing to beat on CET’s concentrated strategy, I rate it as a BUY for the possibility of outperforming the S&P 500 Index.
Final thoughts
Some of my earlier articles focused on the idea of finding funds that could replace SPY for Large-Cap U.S. stocks. Here are a few of those links:
Be the first to comment