


kynny/iStock via Getty Images
In February, Celanese Corporation (NYSE:CE) announced a $11 billion deal to acquire a majority stake in DuPont’s Mobilty and Materials business. The deal will add 29 facilities specializing in thermoplastic and elastomer production and the addition of more than 800 specialized patents. Celanese said the deal will increase earnings by $4 per share by 2026. The deal caused Moody’s to downgrade its outlook for the company to negative over concerns the purchase would cause a “steep increase in debt.”
In late 2021, Celanese completed another acquisition which also was in the elastomer space. The $1.15 billion purchase of Santoprene from Exxon Mobil included the addition of production facilities in Florida and the United Kingdom.
When considering these current stories about Celanese, we need to determine which news topics will have a long-term and ongoing effect on the company and its share price. Celanese’s recent acquisitions show the company’s long-term desire to grow market share in the plastics and polymer manufacturing space. But the expected increases in revenue are offset by adding more debt.
While current news stories, good or bad, can sway our opinion about investing in a company, it’s good to analyze the fundamentals of the company and to see where it’s been in the past and in which direction it’s heading.
This article will focus on the long-term fundamentals of the company, which tend to give us a better picture of the company as a viable investment. I also analyze the value of the company vs. the price and help you to determine if CE is currently trading at a bargain price. I provide various situations which help estimate the company’s future returns. In closing, I will tell you my personal opinion about whether I’m interested in taking a position in this company and why.
Snapshot of the Company
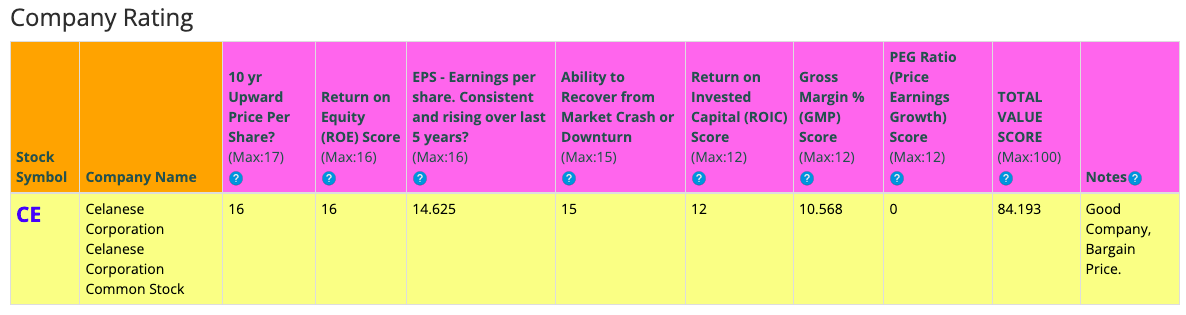
A fast way for me to get an overall understanding of the condition of the business is to use the BTMA Stock Analyzer’s company rating score. It shows a score of around 84/100. Therefore, Celanese Corporation is considered to be a good company to invest in, since 70 is the lowest good company score. CE has high scores for 10 Year Price Per Share, ROE, Earnings per share, Ability to Recover from a Market Crash or Downturn, ROIC, and Gross Margin Percent. It has a low score for PEG Ratio. A low PEG Ratio score indicates that the company may not be experiencing high growth consistently over the past five years. In summary, these findings show us that CE seems to have above average fundamentals since all but one categories produce good scores.
Before jumping to conclusions, we’ll have to look closer into individual categories to see what’s going on.
BTMA Stock Analyzer
(Source: BTMA Stock Analyzer)
Fundamentals
Let’s examine the price per share history first. In the chart below, we can see that price per share has been consistent at increasing over the last 10 years, with one exception in 2021 where share price has declined. Celanese Corporation has significant exposure to the automotive industry, which experienced a large drop in production during to COVID-related supply chain issues in 2021. Overall, share price average has grown by about 326.7% over the past 10 years or a Compound Annual Growth Rate of 17.49%. This is an impressive return.
%5CImages%5CVerizon%20VZ%20stock%20price%20history.PNG)
BTMA Stock Analyzer
(Source: BTMA Stock Analyzer – Price Per Share History)
Earnings
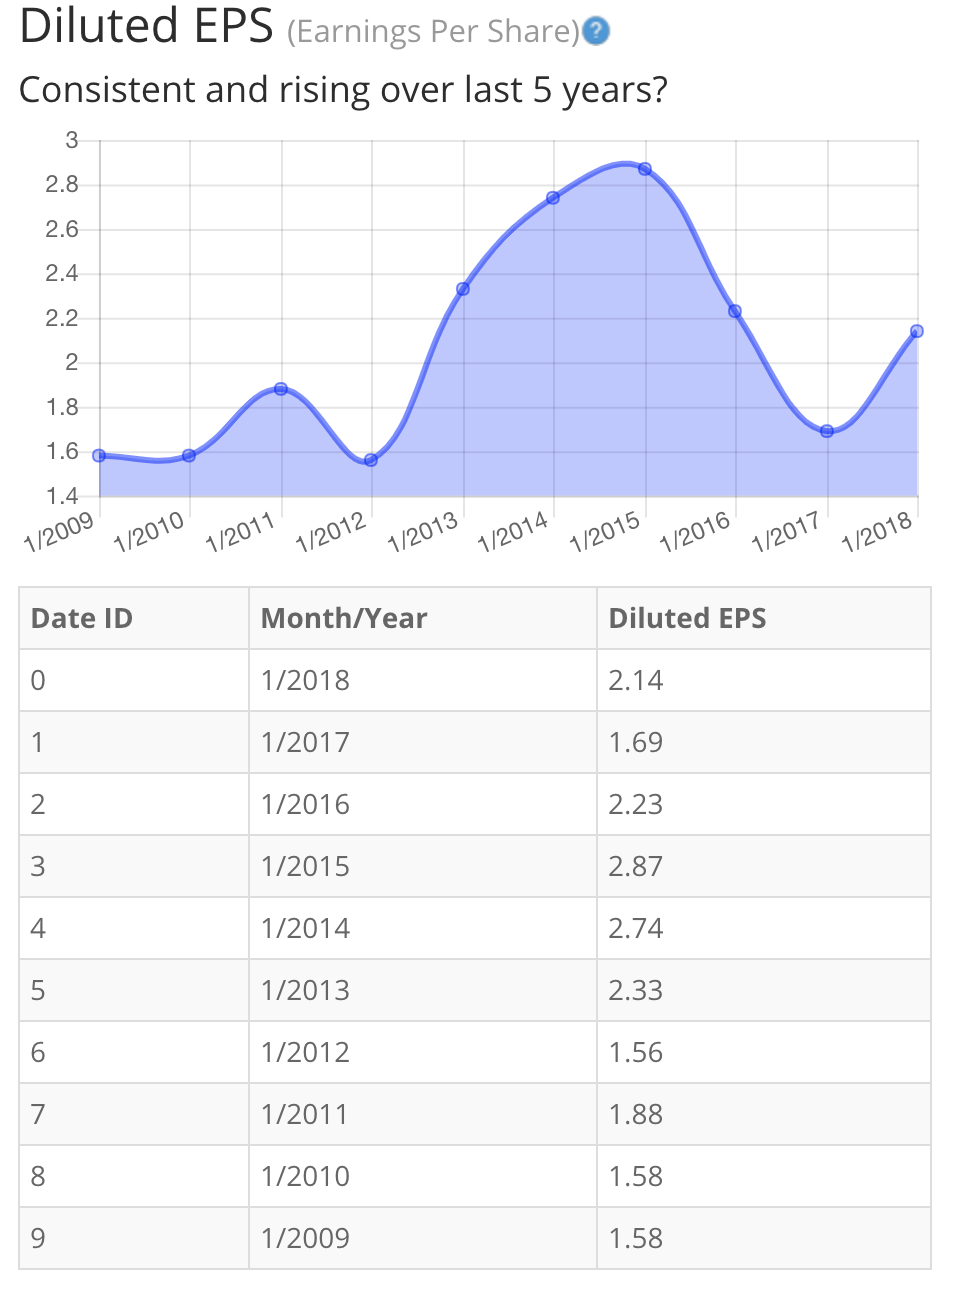
Looking closer at earnings history, we see that earnings have grown overall during the past 10 years, albeit earnings have not grown consistently. It has been more like a “two steps forward, one step back” movement. However, as a whole, the earnings’ history is positive, since earnings have increased eight-fold over the last 10 years.
Consistent earnings make it easier to accurately estimate the future growth and value of the company. So, in this regard, CE is not an ideal candidate of a stock to accurately estimate future growth or current value.
BTMA Stock Analyzer
(Source: BTMA Stock Analyzer – EPS History)
Since earnings and price per share don’t always give the whole picture, it’s good to look at other factors like the gross margins, return on equity, and return on invested capital.
Return on Equity
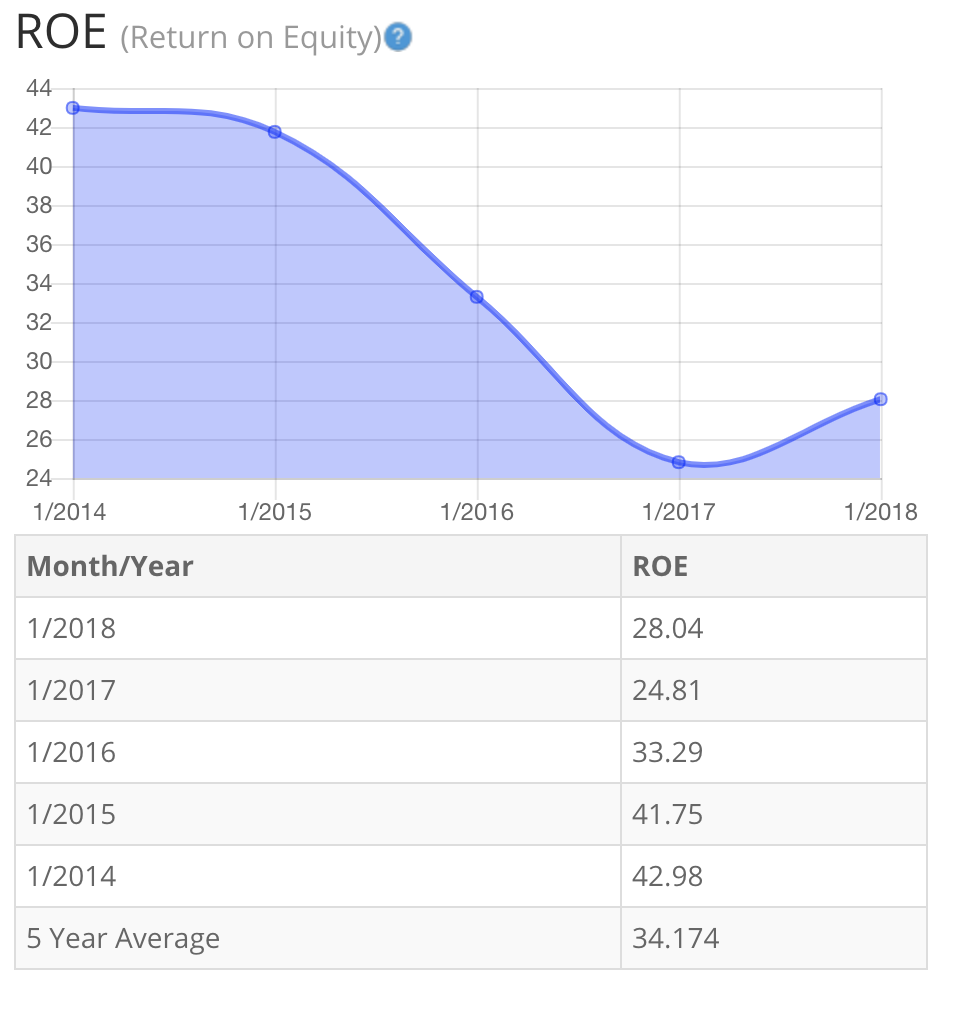
The return on equity has been inconsistent over the past five years. After increasing in 2018, ROE decreased in 2019. After a large swing upward in 2020, ROE fell significantly in 2021. With so much variation, it’s therefore more reliable to focus on the ROE figures for the entire period. Five-year average ROE is very good at around 43%. For return on equity (ROE), I look for a five-year average of 16% or more. So, CE easily meets my requirements.
BTMA Stock Analyzer
(Source: BTMA Stock Analyzer – ROE History)
Let’s compare the ROE of this company to its industry. The average ROE of 81 Specialty Chemical companies is 16.0%.
Therefore, Celanese Corporation’s five-year average of 43.5% and current ROE of 49% are well above average.
Return on Invested Capital
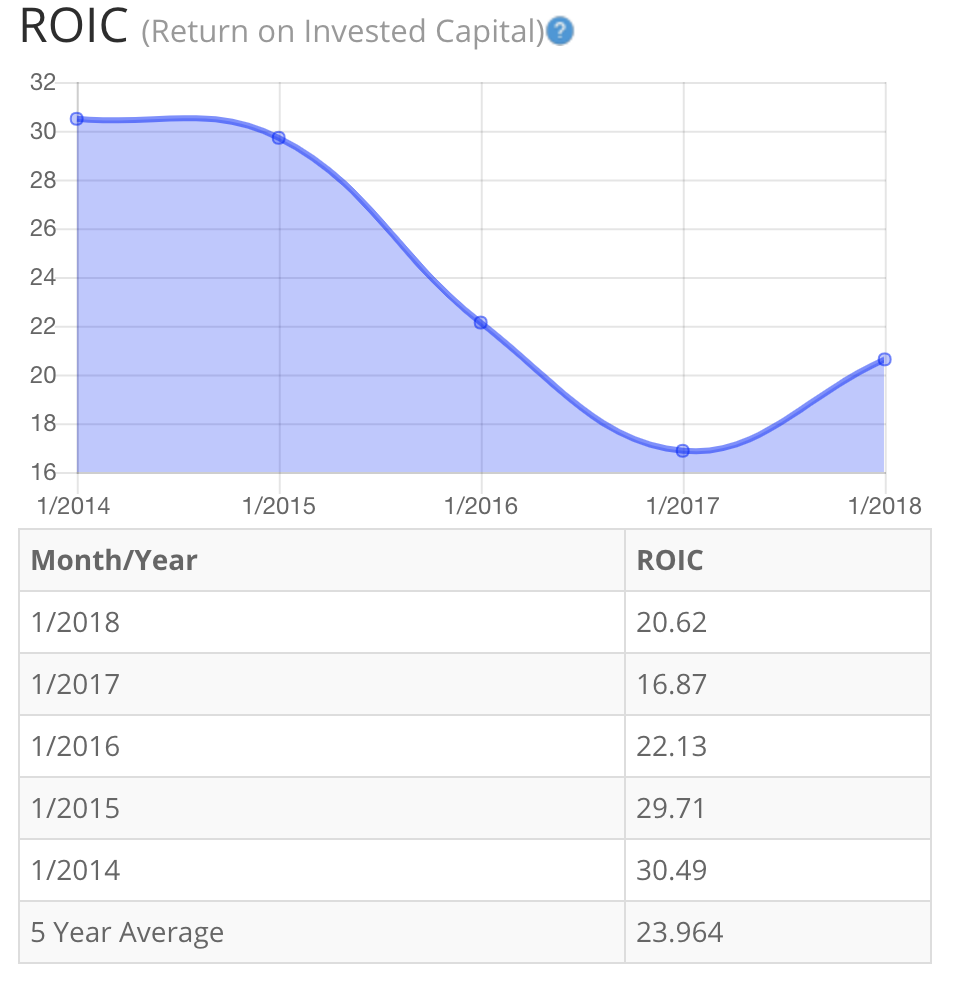
The return on invested capital has fluctuated over the past five years. ROIC fell in 2019 after an increase in 2018. A surge in 2020 was followed by a decrease in 2021. Five-year average ROIC is decent at around 20%. For return on invested capital, I also look for a 5-year average of 16% or more. So, CE passes this test as well.
BTMA Stock Analyzer
(Source: BTMA Stock Analyzer – Return on Invested Capital History)
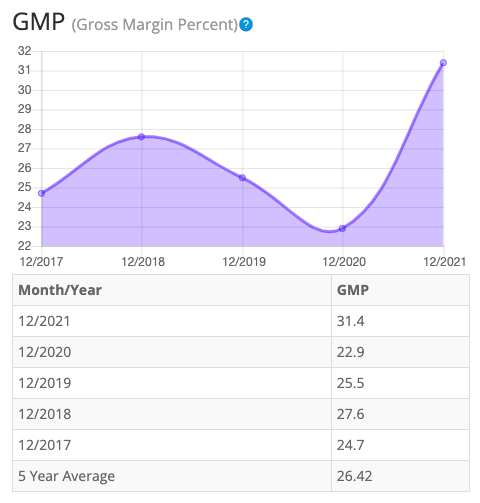
Gross Margin Percent
While gross margin percent – GMP – has increased over the last five years, it’s worth noting declines both in 2019 and 2020. Five-year GMP is sub-standard at around 26%. I typically look for companies with gross margin percent consistently above 30%. So, CE has proven that it may not have the ability to maintain acceptable margins over a long period. However, we should still consider that gross margins could have been affected because of COVID-related issues with the auto industry. It’s also worth noting that gross margins have exponentially improved in the most recent year of data.
BTMA Stock Analyzer
(Source: BTMA Stock Analyzer – Gross Margin Percent History)
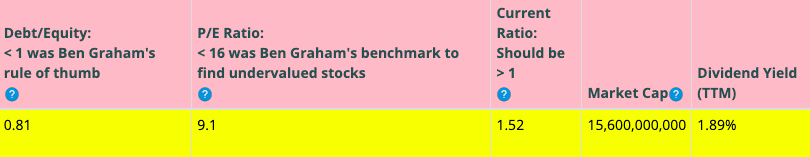
Looking at other fundamentals involving the balance sheet, we can see that the debt-to-equity is less than 1. This is a good indicator, telling us that the company owns more than it owes.
CE’s Current Ratio of 1.52 is satisfactory, indicating that it has an adequate ability to use its assets to pay its short-term debt.
Ideally, we’d want to see a Current Ratio of more than 1, so CE exceeds this amount.
According to the balance sheet, the company appears to be in good financial health. In the long term, the company seems fine in regards to its debt-to-equity. In the short-term the company’s financial situation is also strong.
The Price-Earnings Ratio of 9.1 indicates that CE might be selling at a low price when comparing CE’s PE Ratio to a long-term market average PE Ratio of 15. The 10-year and 5-year average PE Ratio of CE has typically been between 15.1 and 14.3, so this indicates that CE could be currently trading at a low price when comparing to CE’s average historical PE Ratio range.
CE currently pays a dividend of 1.89% (and 1.89% over the last 12 months).
BTMA Stock Analyzer
(Source: BTMA Stock Analyzer – Misc. Fundamentals)
The Story Behind The Dividend
Morningstar
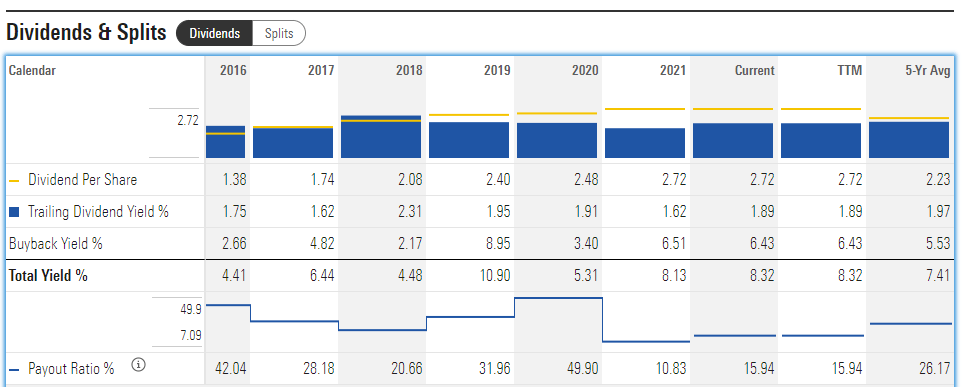
With regard to dividend history, I’m first interested in knowing if the payout ratio is sustainable. At this time, it’s around 16%, which means that there’s still plenty of room to grow the dividend. Also notice that CE has a regular history of buying back shares, which contributes to higher payout ratios.
If we look only at the dividend yield, we see a range of 1.62% to 2.31%. This stock pays out a moderate dividend. Dividend payouts have increased somewhat consistently over the five-year period, therefore this stock may be desireable for some dividend investors.
Although CE participates in share buybacks, sometimes buybacks don’t make sense, as according to Warren Buffett: “There is only one combination of facts that makes it advisable for a company to repurchase its shares: First, the company has available funds — cash plus sensible borrowing capacity — beyond the near-term needs of the business and, second, finds its stock selling in the market below its intrinsic value, conservatively calculated.”
In the example of CE, the company appears to have ample equity as indicated by its satisfactory debt-to-equity ratio and its short-term cash seems sufficient as indicated by its current ratio. Now let’s consider its borrowing capacity.
“Deutsche Bank analysts wrote that “Celanese does not believe there is an engineering materials/plastics deal in the market that it could not do.” The company had previously told investors it had $6 billion in borrowing capacity for deal-making.”
In addition, Celanese has proven that it has great borrowing capacity as it is materializing a deal to acquire a majority of DuPont’s mobility and materials business in an $11 billion cash deal.
Now to see if the buyback timing made sense. From the view of a share price chart over the past five years, one the worst times to do share buybacks would have been in 2018 when CE was climbing highest in stock price. Celanese was buying back less shares at this time, which would make sense. Next, 2021 would have been the best time to buy back shares and this is when CE had increase buybacks from the previous year. This also made strategic sense. Therefore, it seems like CE has bought back stocks on a regular yearly basis, and may have some strategic planning in when to effectively buy back shares.
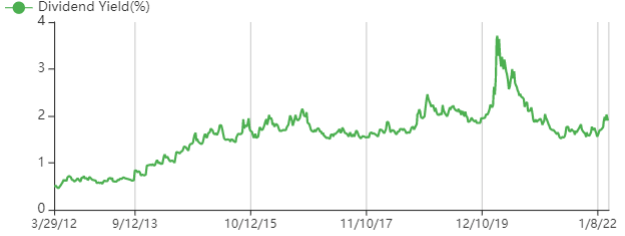
If I were currently interested in buying CE now for the dividend, I would be trying to buy when the dividend yield was highest relative to its past. From the chart below, we can see that the dividend yield is near a mid- point relative to the past 10 years. Therefore, it’s reasonable, but not ideal time to buy now if my priority is a better than average return through dividends.
GuruFocus
Overall, the dividend situation with CE is better than average. On the positive side, the stock pays a moderate and consistent dividend. The dividend payouts and yield have been increasing over the years. CE also aims to regularly return value back to shareholders through buy backs. Finally, the payout ratio leaves plenty of room to increase the dividend.
This analysis wouldn’t be complete without considering the value of the company vs. share price.
Value Vs. Price
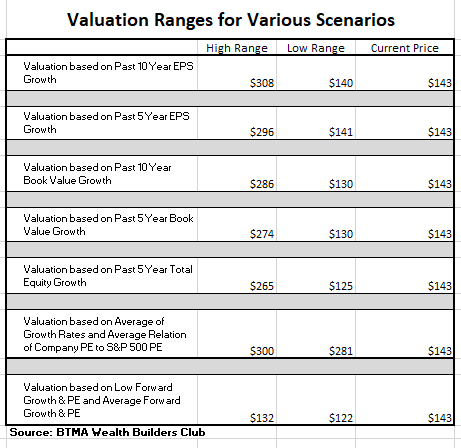
For valuation purposes, I will be using a diluted EPS of 16.86. I’ve used various past averages of growth rates and PE Ratios to calculate different scenarios of valuation ranges from low to average values. The valuations compare growth rates of EPS, Book Value, and Total Equity.
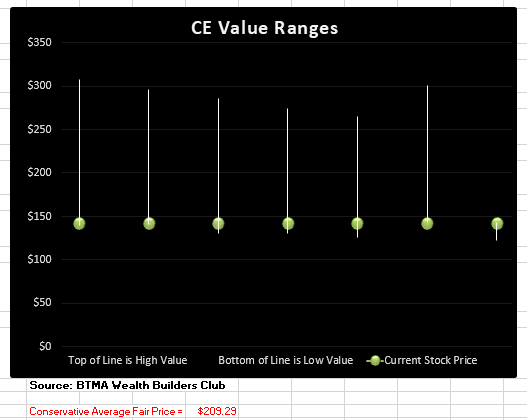
In the table below, you can see the different scenarios, and in the chart, you will see vertical valuation lines that correspond to the table valuation ranges. The dots on the lines represent the current stock price. If the dot is towards the bottom of the valuation range, this would indicate that the stock is undervalued. If the dot is near the top of the valuation line, this would show an overvalued stock.
BTMA Wealth Builders Club
BTMA Wealth Builders Club
(Source: BTMA Wealth Builders Club)
According to this valuation analysis, CE is undervalued.
- If CE continues with a growth average similar to its past 10 years earnings growth, then the stock is undervalued at this time.
- If CE continues with a growth average similar to its past 5 years earnings growth, then the stock is undervalued at this time.
- If CE continues with a growth average similar to its past 10 years book value growth, then the stock is undervalued at this time.
- If CE continues with a growth average similar to its past 5 years book value growth, then the stock is undervalued at this time.
- If CE continues with a growth average similar to its past 5 years total equity growth, then the stock is undervalued at this time.
- According to CE’s typical PE ratio relation to the S&P 500’s PE Ratio, CE is undervalued.
- If CE continues with a growth average as forecasted by analysts, then the stock is slightly overpriced.
This analysis shows an average valuation of around $209 per share versus its current price of about $143, this would indicate that Celanese Corp. is undervalued.
Forward-Looking Conclusion
According to the facts, Celanese is financially healthy in a long-term sense in having enough equity as compared with debt, and in the short-term because the current ratio indicates that it has enough cash to cover current liabilities.
Other fundamentals are strong. EPS has increased over the past 10 years. ROE and ROIC are at impressive levels. Gross margins are slightly less than I would like to see, but the good news is that margins have been on a recent uptrend.
The dividend situation is better than average as the company pays a consistent dividend with payouts and yields that have been increasing over the past five years. Plus, the low payout ratio leaves plenty of room to continue increasing the dividend.
Lastly, this analysis shows that the stock is undervalued.
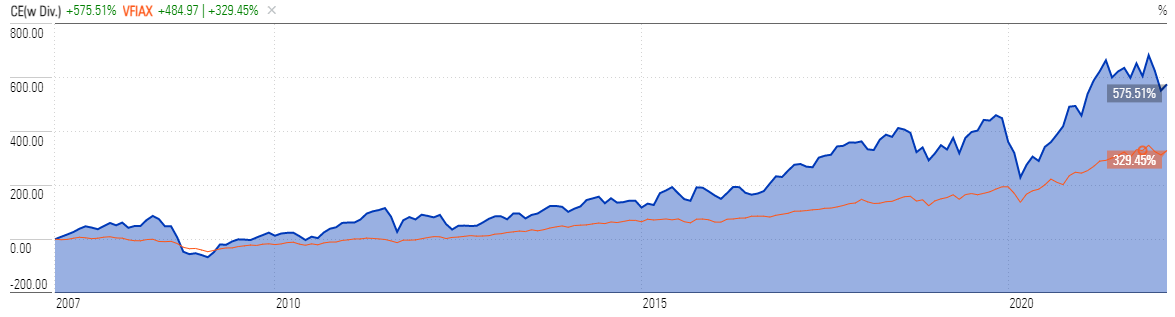
Next, let’s look at how CE performed in the long run against the standard market benchmark S&P 500. We can see from the chart below that CE has significantly outperformed against the S&P 500 most of the time from 2007 to 2022. So, there is good growth potential when investing in CE.
However, this stock may not be for the faint of heart. If you look at periods of recession, such as 2008 and March 2020 (onset of COVID crisis), CE lost ground much faster than the general market. This is believed to be caused by CE’s dependence on selling its products to the auto industry. (Auto-related stocks are often one of the hardest hit industries during economic recessions.) But if you’re patient enough to hold onto the stock through a recession and if you bought it at a bargain price, then you shouldn’t have too much risk with this investment.
Morningstar
Predicted Growth
“Over the next five years, the analysts that follow this company are expecting it to grow earnings at an average annual rate of -2.22%. This year, analysts are forecasting earnings increase of -13.5% over last year. Analysts expect earnings growth next year of 4.3% over this year’s forecasted earnings” (Source: Forecast Earnings Growth).
If you invest today, with analysts’ forecasts, you might expect about -2.22% growth per year. Plus, we’ll add the current 1.89% forward dividend. This brings the annual return to around -0.33%.
Here’s an alternative scenario based on CE’s past earnings growth. During the past 10- and five-year periods, the average EPS growth rate was about 21% and 22%, respectively. Plus, the average 5-year dividend yield was about 1.97%. So, we’re at a total return of 22.97% to 23.97%.
But when considering cash flow growth over the past 10 and five years, the growth has been 15% and 19%, respectively. Plus, the average five-year dividend yield would give us a total return of 16.97% to 20.97%. Therefore, when considering an average of all these return situations, our annual return could likely be around 16%-17%.
If considering actual past results of Celanese, which includes affected share prices, and long-term dividend yields, the story is a bit different. Here are the actual 10 and 5-year return results.
______________
10 Year Return Results if Invested in CE:
Initial Investment Date: 03/26/2012
End Date: 03/26/2022
Cost per Share: $45.25
End Date Price: $144.11
Total Dividends Received: $16.30
Total Return: 254.50%
Compound Annualized Growth Rate: 13%
_______________
5 Year Return Results if Invested in CE:
Initial Investment Date: 03/26/2017
End Date: 03/26/2022
Cost per Share: $89.47
End Date Price: $144.11
Total Dividends Received: $11.74
Total Return: 74.19%
Compound Annualized Growth Rate: 12%
_________________
From these scenarios, we have produced results from 12% to 13%. I feel that if you’re a long-term patient investor and believer in CE, and its existing products (chemical coatings, adhesives, and polymers used in the automotive, electronics, medical markets, as well as cellulose derivatives used in cigarette filters), you could expect CE to provide you with around at least 12%-13% annual return. Plus, you could achieve more significant returns in the high teens or low twenties, if you make sure to buy at a bargain price and don’t sell during periods of recession.
As a comparison, the S&P 500’s average return from 1928 – 2014 is about 10%. So, in a typical long-term hold scenario with CE, you could expect to earn a higher return result as compared with an S&P 500 index fund.
For me, the choice is certain. I would take an objective look at this company and realize that Celanese offers a chance to own a solid company with good long-term fundamentals, and a healthy amount of growth left.
Since it’s one of one of the world’s largest producers of acetic acid (which can be used in various chemical products), it has a size advantage over competition and its ability to sell acetic acid to various industries provides diversity and stability.
Since automobile production has experienced setbacks because of COVID, there has recently been less demand for Celanese automotive coatings, polymers, and adhesives. I see this as an opportune time to buy while share prices are lower. Therefore, I’m interested in buying Celanese at a bargain price soon in order to take advantage of this relatively low-risk, healthy-growth-potential stock.
Be the first to comment