

Darren415
This article was first released to Systematic Income subscribers and free trials on Nov. 26.
Welcome to another installment of our CEF Market Weekly Review where we discuss closed-end fund (“CEF”) market activity from both the bottom-up – highlighting individual fund news and events – as well as the top-down – providing an overview of the broader market. We also try to provide some historical context as well as the relevant themes that look to be driving markets or that investors ought to be mindful of.
This update covers the period through the fourth week of November. Be sure to check out our other weekly updates covering the business development company (“BDC”) as well as the preferreds/baby bond markets for perspectives across the broader income space.
Market Action
It was another strong week for the CEF space with all sectors seeing gains in NAVs. Only a handful of sectors experienced discount widening. Utilities, REITs and Munis outperformed. So far over the month many sectors generated high single-digit gains.
Systematic Income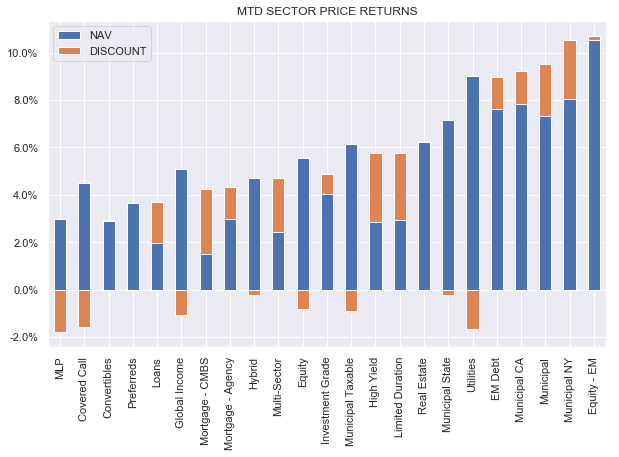
CEFs look on track to have two strong consecutive months, something they haven’t done in over a year.
Systematic Income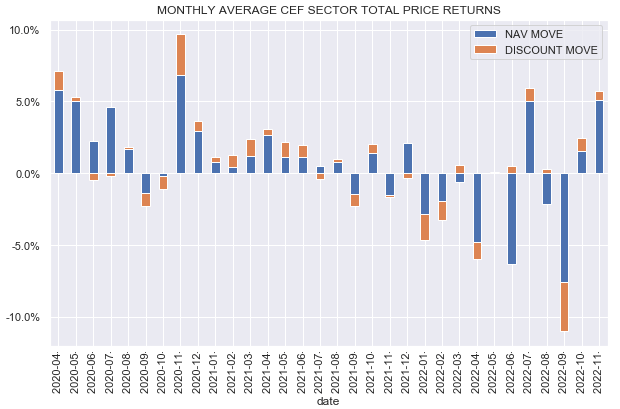
Discounts continue to retrace though most sectors remain significantly wider of their levels at the start of the year.
Systematic Income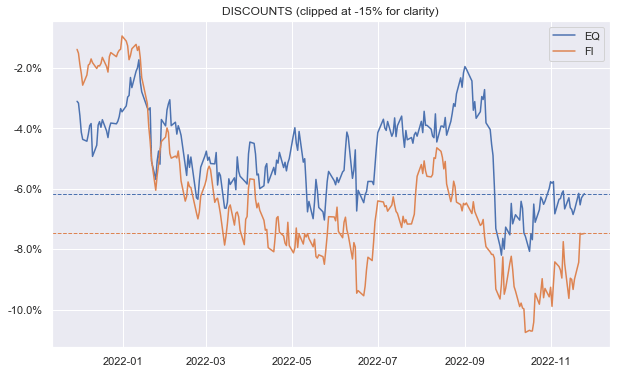
Within the CEF space some of the discount picture remains puzzling. For example, despite being strong outperformers this year, Loan and MLP sectors continue to trade at cheap discount valuations (i.e. in the lower left quadrant) both on an absolute basis (i.e. wide discounts relative to other sectors) as well as relative to their own history (i.e. at 5-20% 5-year percentiles). On the other hand, REITs and Municipal Taxable sectors which are the second and third worst performers this year are trading at elevated valuations (i.e. in the top right quadrant).
Systematic Income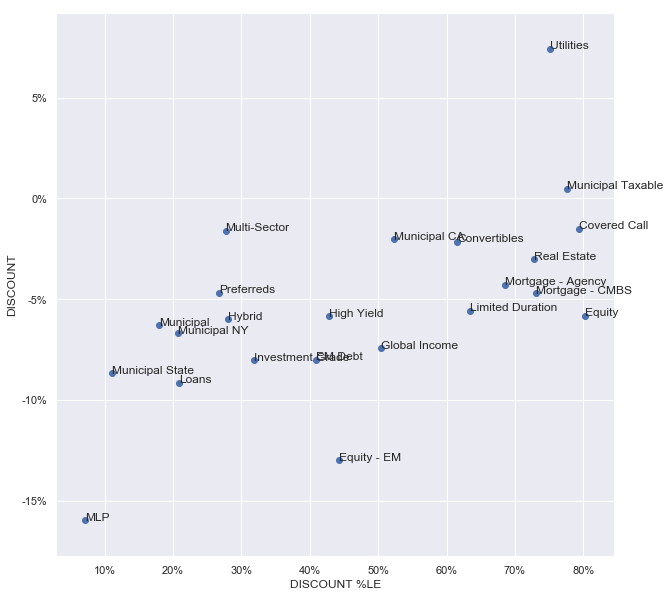
It is certainly possible that investors are taking a forward-looking view of expecting lower inflation / rates which would favor taxable Munis and REITs and would challenge MLPs and loans (driving lower revenues for MLPs as energy prices would likely fall in a disinflationary scenario while loan coupons would also fall in the face of lower rates). That said, tax-exempt Munis and Preferreds are somewhat cheap as well and they will also benefit as well from lower rates. In short, the discount valuation picture in the CEF space is not totally efficient and this is one reason why the space remains attractive for investors with conviction.
Market Themes
Term CEFs continue to remain a core part of our CEF allocation. Investors who are less familiar with this type of fund can have a look at our earlier articles here, here and here.
A question came up on the service of whether it’s possible to predict whether target term CEFs (which, unlike plain term CEFs, target a specific NAV to return at maturity) will indeed be able to return their target NAV. Some investors who don’t understand how these CEFs work look at the large gap between the target and the current NAV and think there is easy money to be made when the fund returns a much higher NAV at termination.
It goes without saying that the target NAV is not guaranteed and is simply a target, as it says on the tin, so to speak. It is typically set at the fund’s inception NAV with the idea that, if the fund just holds assets maturing on roughly the same date as the termination date of the fund, then if these assets return par, the fund should be able to repay its original NAV to investors.
This all makes perfectly good sense in theory, however, in reality there are a number of frictions that get in the way. These are things like trading costs, realized losses, defaults, deleveraging and other factors that stand in the way of the fund returning its original NAV to investors.
As an example, let’s take a look at the Nuveen Corporate Income 2023 Target Term Fund (JHAA) which is a High Yield corporate bond CEF. It has a termination date in Dec-2023 and a target NAV of $9.875. The fund’s current NAV is $9.43 which is 4.5% away from its target.
There are two tailwinds that should help the fund’s NAV to move higher into its termination. First is the fact that it underdistributes a bit – it has distribution coverage of 112% – the 12% in retained income will top up its NAV. The second NAV tailwind is pull-to-par of about 2% which should generate around 2.5% of additional NAV gains, absent defaults. Another potential tailwind is that many target term CEFs cut their distributions ahead of the termination date which may further top up the NAV via retained income.
On the other hand, a headwind to its NAV is the fact that many of its holdings mature before its termination date which means that they will be moved to lower-yielding cash assets. Another headwind is that the fund will very likely start to deleverage several months ahead of its termination date as has happened with many other Nuveen funds, further lowering its net income.
Overall, we don’t see a way for a fund like JHAA to be able to return its target NAV at termination and this is fairly common across the broader target term CEF population.
However, this doesn’t make JHAA unattractive. In fact, it is very appealing, particularly for investors who want to maintain a lower duration / higher-quality profile. The fund’s duration is a very low 1 and more than 80% of the portfolio is allocated to bonds rated BB (i.e. the highest sub-investment-grade rating) and above.
In terms of total yield, we need to add its net investment yield of 3.9% to its pull-to-NAV yield of 3.8% (i.e. the additional tailwind of discount amortizing to zero) to the additional pull-to-par of about 2% which gets us around 9.7%. In our view, JHAA presents the lowest risk option for a near-10% yield at the moment.
Market Commentary
The Western Asset Diversified Income Fund (WDI) raised its distribution for the third time this year. What’s a bit odd is that the WDI NAV distribution rate of 10.3% is well above the sister fund Western Asset Mortgage Opportunity Fund (DMO) NAV distribution rate of 8.9%.
This is odd for three reasons. First, DMO has a higher amount of floating-rate holdings and so has benefited more from rising short-term rates. Two, DMO has a lower management fee. Three, DMO has a higher level of leverage than WDI. When you put all these together the fund should have raised its distribution so that its NAV yield is above that of WDI.
The only thing that could explain the reason DMO hasn’t raised the distribution this year is that its holdings are higher-quality. This is hard to gauge because it holds mostly unrated securities but it would be surprising if its holdings were much higher-quality given its 2020 NAV drawdown. In any case we expect DMO to lift the distribution at some point as well. Both funds remain in the High Income Portfolio.
Stance And Takeaways
There has been a nice rally in the CEF space with both NAV gains as well as discount tightening. There are fewer double-digit discounts on offer. For fans of Flaherty preferreds, (FLC) is worth a look – it is trading 2.5% wider of the sector average (off a 4% level when we first highlighted it) which is fairly unusual in the last few years. It’s worth keeping an eye on – it is a fund that should do particularly well once short-term rates start falling.
Systematic Income CEF Tool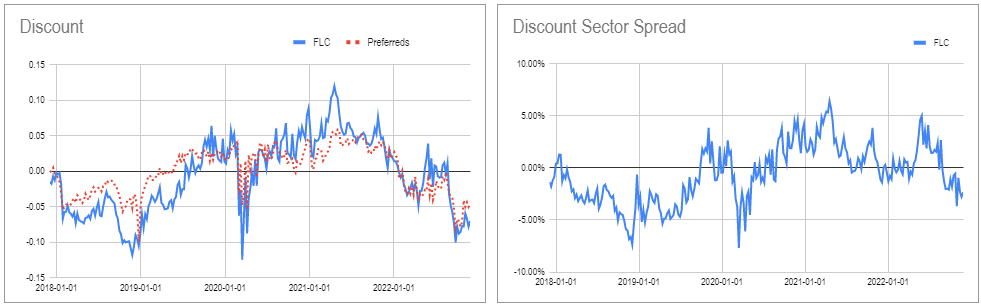
In the Cohen preferred suite, (LDP) looks compelling versus (PTA) which are both trading at an 8.9% discount. The two funds are broadly similar but LDP has a lower management fee and so should trade at a significantly tighter discount over PTA.
Systematic Income CEF Tool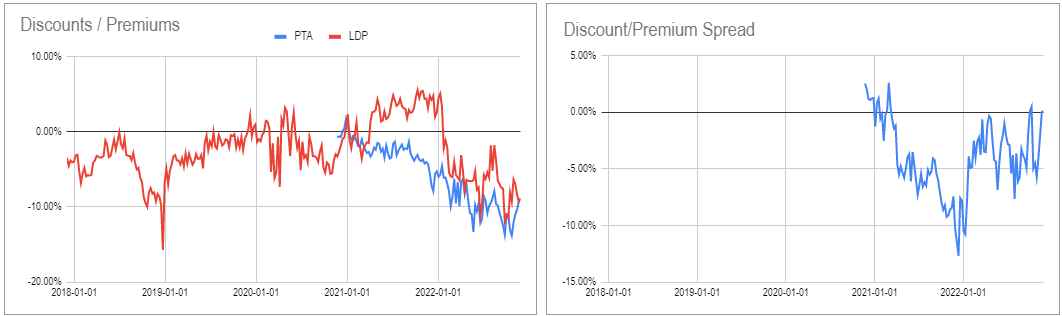
In the Multi-sector space, (PAXS) discount just jumped 1% below that of (PDO) so it’s less compelling now.
In High Yield, the two Credit Suisse funds which we tend to favor (CIK) and (DHY) are both trading at elevated valuations (zero and 2% discounts respectively vs. a 5.8% sector average). For holders it’s worth rotating into something like (ISD), (GHY) or a higher-quality fund like (FINS).
Be the first to comment