

Darren415
This article was first released to Systematic Income subscribers and free trials on Oct. 1.
Welcome to another installment of our CEF Market Weekly Review where we discuss closed-end fund (“CEF”) market activity from both the bottom-up – highlighting individual fund news and events – as well as the top-down – providing an overview of the broader market. We also try to provide some historical context as well as the relevant themes that look to be driving markets or that investors ought to be mindful of.
This update covers the period through the last week of September. Be sure to check out our other weekly updates covering the business development company (“BDC”) as well as the preferreds/baby bond markets for perspectives across the broader income space.
Market Action
It was another tough week for the CEF space, with all but one sector finishing in the red. The two best-performing sectors in September fell 6.5% with about 3/4 of the space seeing double-digit losses. Equity-linked and longer-duration sectors underperformed given the large moves in stocks and Treasuries.
Systematic Income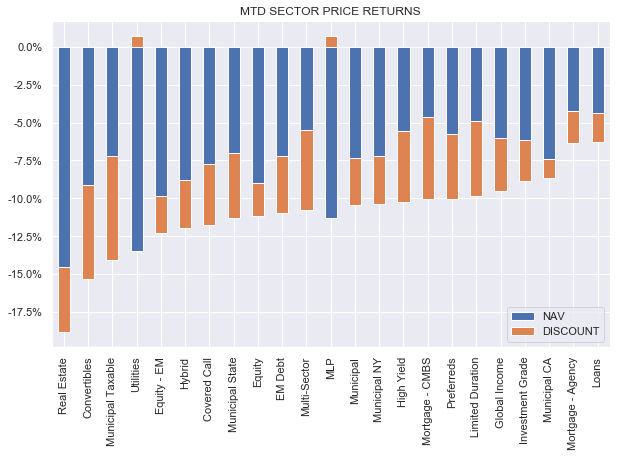
September was grim for the sector – the worst month since March of 2020.
Systematic Income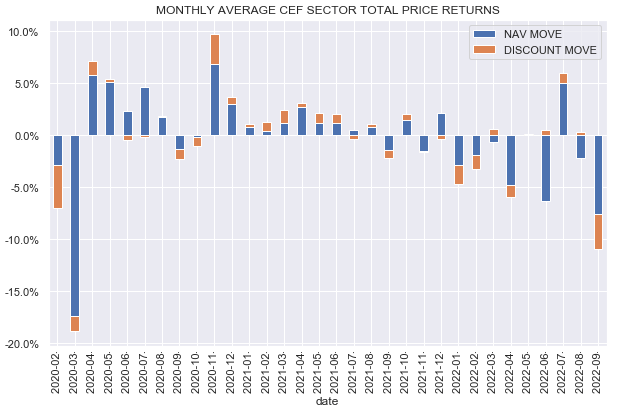
As the chart below of the CEF index shows, the selloff accelerated in September. The market is now flat over the last 2 years.
Systematic Income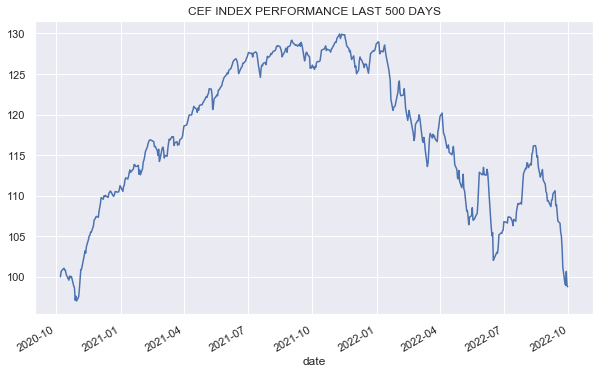
Despite new lows, the selloff appears fairly orderly, with no obvious signs of capitulation. CEF beta to stocks is elevated but well off the highs.
Systematic Income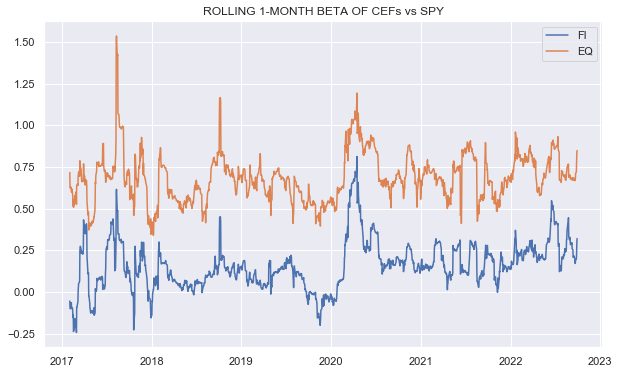
Discounts are relatively wide but well off their historic wides, particularly in equity CEF sectors.
Systematic Income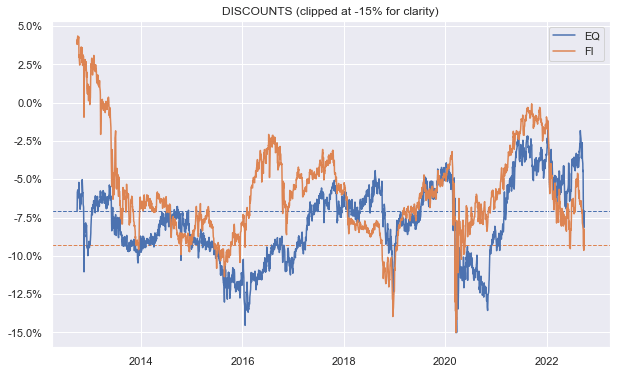
CEF volume is relatively contained.
Systematic Income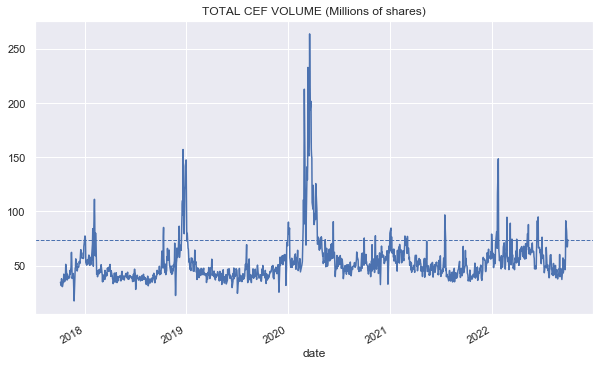
Market Themes
Rising leverage costs remain a headwind for a significant number of CEFs. Funds that are most affected are those with: 1) higher-quality credit allocations, 2) assets with predominantly fixed-rate coupons, 3) floating-rate leverage instruments such as repo and credit facilities, 4) those without interest rate hedges, and 5) those with higher leverage.
Sectors that are more impacted are Munis (both tax-exempt and taxable), Preferreds and Investment-Grade due to the combination of higher-quality / lower-yielding assets and, typically, fixed-rate assets/floating-rate liabilities.
As we highlight below, the Flaherty suite of preferred funds, which fits this pattern, has cut distributions for the fourth time this year. The main reason is the increase in leverage costs which have eaten into income.
The chart below shows how the net income of the fund’s leveraged assets look in various short-term rate scenarios. By leveraged assets, we refer to those assets of the fund that are financed with leverage. For some perspective, as of the last shareholder report FLC had $194m of unleveraged assets (i.e., financed with equity capital as opposed to leverage) and $119m of leveraged assets (i.e., those financed with leverage). It goes without saying that leverage costs apply only to assets financed with leverage.
We start with an asset yield of 6.91%, which is the yield of the broader preferreds sector according to Nuveen (blue bars). We then subtract the leverage cost (orange bars), which are 1-Month Libor + 0.8%, for FLC as well as management fees (grey bars) to come up with a net yield that is passed on to investors.
Systematic Income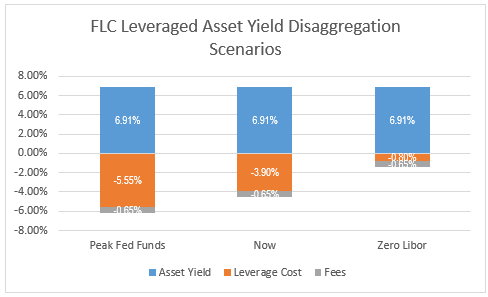
In the scenario of zero Libor – roughly what we had at the start of the year – FLC would be able to pass on 5.46% to investors (i.e., 6.91% – 0.8% of leverage cost – 0.65% of fees).
Currently, with 1-Month Libor around 3.1% the fund is passing on 2.36% of the 6.91% yield it earns on its leveraged assets to investors.
With Libor expected to peak around 4.75%, the fund will be passing on 0.71% to investors out of the 6.91% it earns on its leveraged assets.
And, of course, if Libor rises above the current consensus level, then net income from leveraged assets could easily go negative.
In addition to ticking all the boxes mentioned above, the Flaherty funds also try to align their distributions with net income, which explains why they keep moving their distributions lower.
This is why on the service we continue to tilt to funds that feature any of the following features, at least in part: floating-rate assets, fixed-rate liabilities or interest-rate hedges.
Market Commentary
The Invesco Senior Income Trust (VVR) had a chunky 23% distribution hike, which has been a trend in the loan sector this year for obvious reasons. What’s also interesting about the fund is that about a third of its leverage is sourced via floating-rate preferreds, which have an interest expense of about 0.6-8% below the more traditional credit facilities / repo which the fund also uses. This allows the fund to pay a bit less on its cost of leverage than other funds which use credit facilities.
That said, it does slightly raise the possibility of deleveraging given the likely stricter asset coverage requirements of the preferreds. The fund’s long-term performance has been very good – about 1% above the sector average over the last 5 years in total NAV terms. Its discount is slightly wider than the sector average so it’s a nice pick for loan CEF exposure.
As mentioned above, Flaherty preferred funds FFC, FLC, DFP, PFD, PFO cut dividends once again. That makes it the fourth time this year. The chart below of FLC distributions shows that distributions are now below the earlier pre-COVID trough.
Systematic Income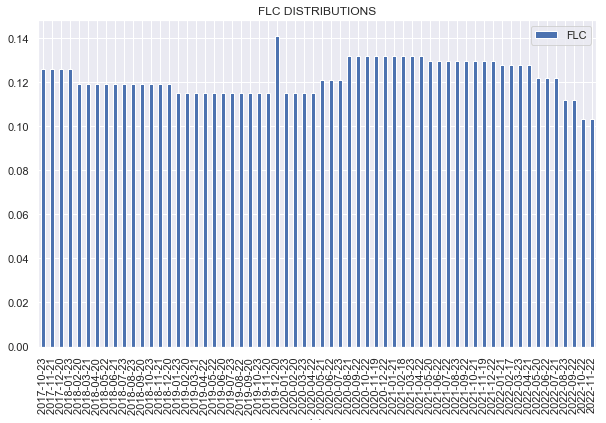
Articles about how the Flaherty funds were “best of breed” were a dime-a-dozen in 2021, and here we are with them bringing up the rear in 2022 in terms of performance and distributions. Instead, something like PTA which was never overvalued, has a more stable level of income and a shorter duration due to timely interest rate hedges has outperformed. At the end of the day, very few funds are appropriate for all market environments. If short-term rates collapse and Flaherty fund discounts remain as wide as they are now, it would make a lot of sense to switch over to them for preferred exposure, but until then they are going to cut distributions and be more vulnerable to weakness in rates.
The key takeaway here is that few, if any, managers are able to overcome the structural features of their funds. This mistake that many investors make is to confuse these structural features, when they are aligned with the market, for manager alpha. Once the market shifts direction, these funds often underperform, causing investor disappointment.
Stance and Takeaways
Our recent stance has been to tilt to higher-quality funds with a stable income profile. Two big reasons for this are the fact that high-yield corporate bond credit spreads rallied to a much too tight level of below 4.5% – a level that does not align with the probability of a recession over the next year. Now that spreads have widened back to around 5.5%, credit market valuations make a bit more sense. That said, we would wait for spreads to move above their recent highs as of June and closer to 7-8% before committing new capital to sub-investment-grade assets.
Until that happens we continue to see value in adding to funds like FINS, PTA, JPI, and DMO which hold decent-quality assets and feature a relatively stable level of income.
Be the first to comment