

cemagraphics/E+ via Getty Images
This article was first released to Systematic Income subscribers and free trials on June 25.
Welcome to another installment of our CEF Market Weekly Review where we discuss CEF market activity from both the bottom-up – highlighting individual fund news and events – as well as top-down – providing an overview of the broader market. We also try to provide some historical context as well as the relevant themes that look to be driving markets or that investors ought to be mindful of.
This update covers the period through the fourth week of June. Be sure to check out our other weekly updates covering the BDC as well as the preferreds/baby bond markets for perspectives across the broader income space.
Market Action
It was a good week for the CEF space with all sectors registering positive total returns. However, it wasn’t good enough to turn June around due to the horrific performance earlier in the month. Two-thirds of sectors are still registering total returns of -5% or worse in June.
Systematic Income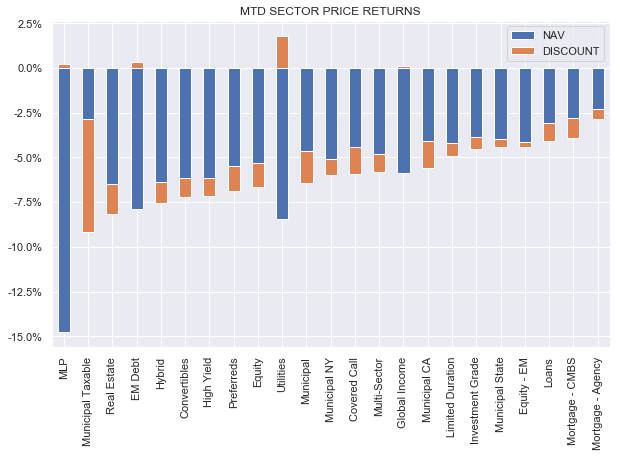
The chart of the overall CEF index shows that the most recent bounce only recovered a small part of the previous fall.
Systematic Income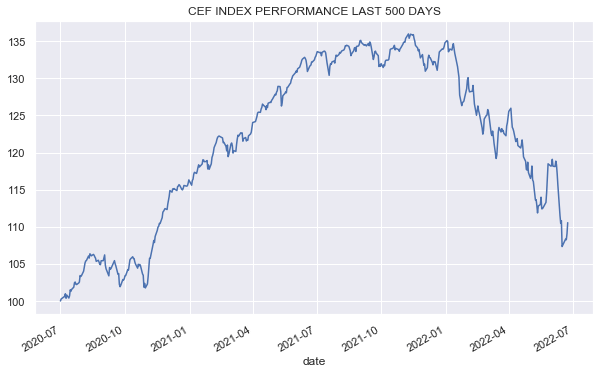
Tax-exempt municipal sectors have been relatively resilient lately and have been marching closer to the middle-of-the-pack in terms of year-to-date total returns from an earlier position as some of the worst performers. This dynamic is due to the sell-off becoming more of a credit rather than a rates story. Increasing recession estimates have pushed credit spreads significantly wider while slowing down the rise in Treasury yields.
Systematic Income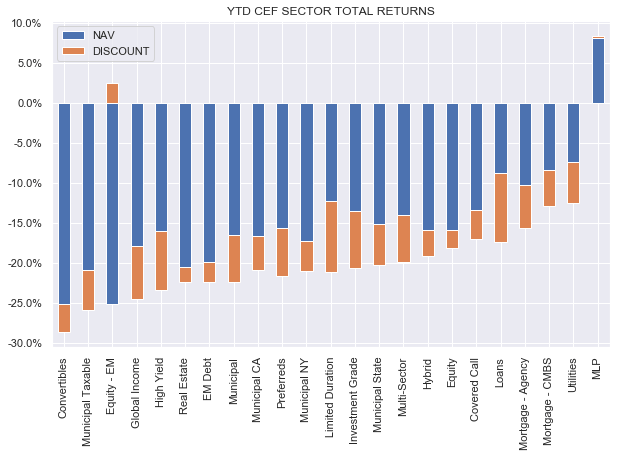
Fixed-income CEF discounts have recovered somewhat from the very wide levels we saw in the previous week. Equity CEF discounts, on the other hand, widened off their unusually expensive levels.
Systematic Income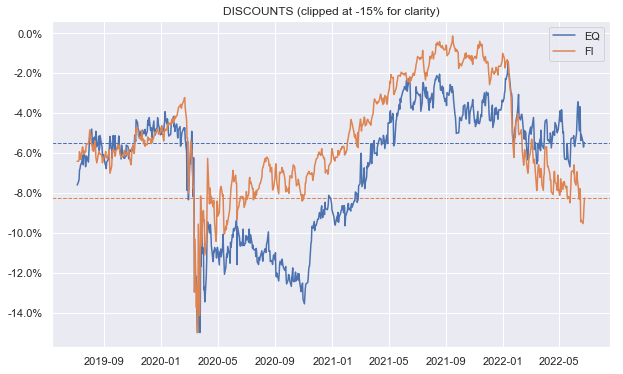
Market Themes
Over the last few months we have seen a number of misconceptions related to CEF fees so we take the opportunity to highlight them in this section. Investors looking for a quick review of key fee-related conceptions can have a look at our earlier article on this topic.
The first thing worth highlighting is that some investors always worry that CEF fees are just too damn high. For instance, in our Credit Suisse Asset Management Income Fund (CIK) article where we highlighted the fund’s unusually low fee structure, a reader responded with the view that CIK fees are extremely high relative to a number of vanguard open-end bond funds that charge 0.05% or less.
Even without getting into an active (CEFs) vs. passive (Vanguard funds) management discussion, let’s consider an apples-to-apples hypothetical scenario where a Vanguard fund and CIK both held the same high-yield bond portfolio having a yield of 8.75% – roughly where high-yield corporate bonds are trading now.
If we disaggregate the CIK net asset yield based on its metrics and the 8.75% portfolio yield it looks like the following.
Systematic Income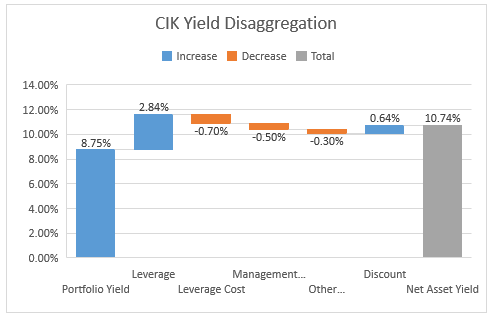
Specifically, the fund charges a management fee of 0.5% alongside sundry fund expenses of 0.3% for total expenses of around 0.8% on net assets. However, because the fund trades at a 6% discount, investors get 0.64% of that back, leaving the “real” fee of just 0.16%. That’s not a million miles away from the Vanguard 0.05% fee.
The other important point is that CIK carries leverage which allows it to generate a net asset yield of 2% above its portfolio yield whereas the Vanguard fund delivers a total yield that is 0.05% below its portfolio yield as it carries no leverage and doesn’t trade at a discount. Some investors may not consider that quite apples-to-apples and that’s fair but it’s worth saying nonetheless.
The second issue is many commentators don’t offer a very useful view on fund fees. For instance, a recent article on the PIMCO Dynamic Income Opportunities Fund (PDO) simply said that PDO has a total expense ratio of 2.61%. This is accurate but it’s totally unhelpful.
First, it combines both the fund’s management fee and its interest expense into a single number. This may seem like a good thing to do but it’s not because the interest expense is dependent on the fund’s leverage level – a fund with lower leverage will feature a lower interest expense and vice-versa, all else equal. So, a fund with a higher stated interest expense can seem like a worse deal but it could actually feature a lower level of borrowing costs but a higher level of leverage which results in a higher stated expense ratio.
The second problem with the 2.61% number is that it’s totally devoid of context – is 2.61% high or low, should I worry that it’s a bad deal or should I be happy that it’s a great deal? Fees need to be presented in context of what, roughly speaking, the average fees are in the CEF space. This is why splitting the fund’s fees into management fees (PDO charges 1.15% on total assets – a relatively high figure even for PIMCO funds) and finances itself with repo which is pretty typical in the taxable space as far as interest expense goes.
The third problem is that the 2.61% PDO number is very stale. In fact, eagle-eyed investors may have noticed that it hasn’t changed this year despite the fact that short-term rates have risen sharply by around 2% or so. This is simply because it’s not updated very often. What is more useful than a stale number for investors is a forward-looking number. Here, we can say that with the market expecting short-term rates to rise closer to 3-4%, the fund’s interest expense will rise to around 4-5% over the next year.
The key takeaway here is that whenever investors see fund fee commentary they should ask the question – is it high or low for the sector and the broader CEF space? They should also ask what the split looks like between management fee and interest expense and whether interest expense is likely to keep rising with the path of short-term rates. This kind of breakdown can help investors make a better decision of the attractiveness of certain funds over others.
Market Commentary
Barings Corporate Investors (MCI) came up on the service. The fund is a quasi-BDC in that it holds primarily private placement loans but is different from a typical BDC in a few key respects. First, it’s unusually lightly leveraged for a BDC with leverage of just 0.1x vs. an average of 1.0x. Two, it’s very obviously under-resourced for a real BDC. It charges 1.25% on net assets which works out to a bit over $4m. $4m might be fine for a couple of fund managers, legal support plus sundry expenses but it’s just too small to run a well-staffed BDC.
A fund that trades public securities doesn’t need a lot of support – just a couple of people to run the fund and some research analysts. A BDC, on the other hand, needs a lot of loan structuring work plus it needs people who can work with the company to solve problems that come up and get the company back on track. This is why BDCs tend to charge a fee on 1) total assets, not net assets, 2) charge a higher management fee – 1.25% is at the very low end of the sector, 3) charge income and capital gains incentive fees, 4) are just larger – MCI would be one of the very smallest BDCs if it were one.
From what we can tell MCI only has 2 fund managers – a laughable number of people for a real BDC. What seems to be going on here is that MCI is not a BDC in the sense of having relationships with companies, structuring loans, supporting company management etc. MCI is a private credit trader – which sounds the same as a BDC but is not. Rather than working with company management on structuring loans they get a call from financial sponsors asking them if they want to participate in a private placement deal on terms that are more or less pre-agreed. Many BDCs also deal with sponsors but not at a 100% level.
Does this matter? It may not – MCI has delivered a pretty similar return as the BDC market over 3-10 years which is actually fairly impressive given its very low leverage level. We should keep in mind that it does have a higher equity profile and a pretty low first-lien allocation so it is higher-beta than the broader sector before leverage and this has juiced its historic performance. One downside of this is that the fund is not going to be in position to help its borrowers in a difficult macro environment so its portfolio might struggle, all else equal. One thing to watch out for is that the fund publishes its NAV quarterly. This means you can’t say that the fund’s discount to NAV is 19% (i.e. current price of $13.65 versus last official Q1 NAV of $16.84). This is because unless you’ve been sleeping under a rock – much has happened since the end of Q1. Specifically, stocks are down 14% and junk bonds are down 9%. Now it’s true that BDC NAVs are weirdly robust through drawdowns but everyone knows this smoothing over of NAVs is not to be taken at face value which is why BDC discounts tend to blow up in weak market periods.
The BlackRock Taxable Municipal Bond Trust (BBN) has moved to a more sensible valuation – now at a 4.6% discount. It spent most of the last two years trading at a premium which never really made sense. It’s still not exactly cheap but it’s not super expensive either.
Systematic Income CEF Tool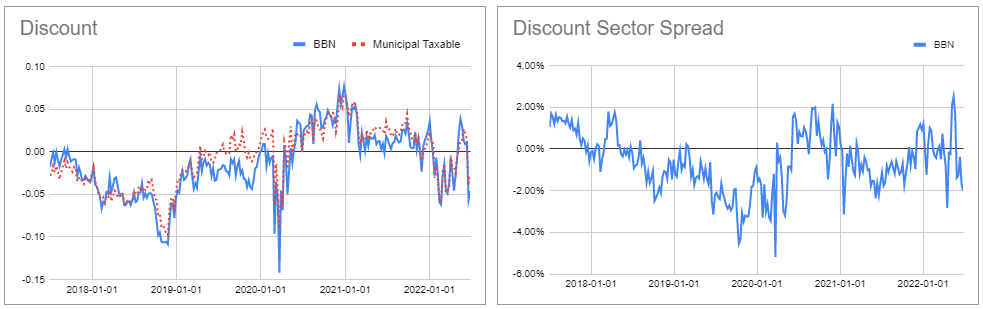
One thing to watch out for is that it has deleveraged by about 20%.
Systematic Income CEF Tool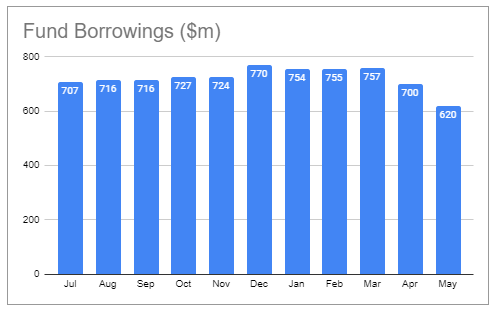
Coverage is around 88% but will be heading lower due to both rising leverage cost and fewer assets due to the deleveraging.
Systematic Income CEF Tool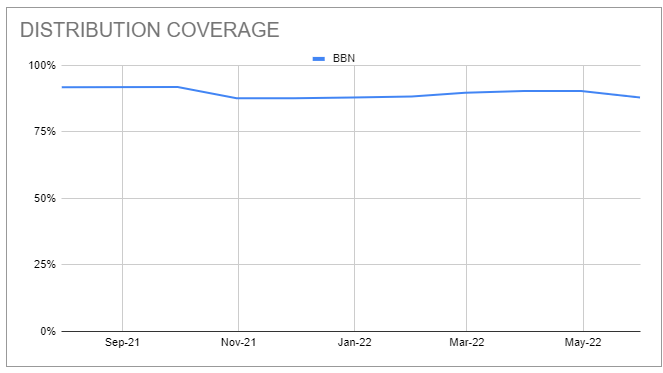
BBN should outperform the broader CEF space in a scenario where credit spreads blow out and Treasury yields collapse back lower – a fairly typical recession scenario. This is due to the fund’s combination of high duration and high quality.
Stance And Takeaways
The Municipal sector continues to deliver unusually volatile moves in a number of its funds. For instance we recently took a position (green circle below) in the BlackRock MuniAssets Fund (MUA) – a lower-leveraged, high-yield tax-exempt fund which tends to trade at a higher valuation than the sector average. The fund then jumped to a very expensive valuation (red circle) at which point it made little sense to keep it.
Systematic Income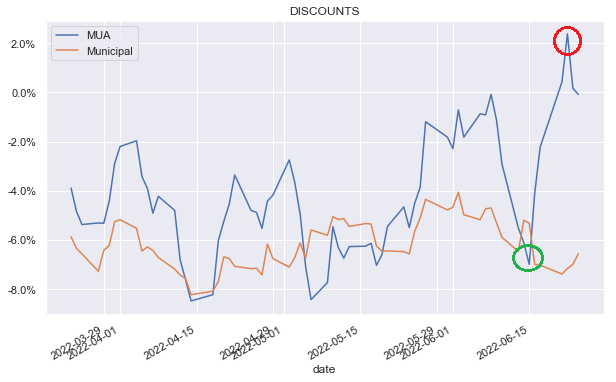
Instead we rotated its capital into a number of other attractive funds in the sector including the Nuveen Municipal Credit Income Fund (NZF) which has a similarly high-yield / unrated tax-exempt focus. NZF remains very attractively valued in the sector, features above-100% distribution coverage and historic outperformance in the sector.
Systematic Income CEF Tool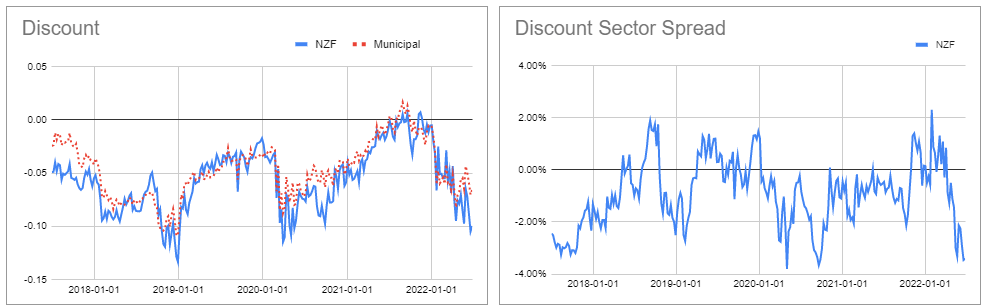
Be the first to comment