

Darren415
This article was first released to Systematic Income subscribers and free trials on Aug 7.
Welcome to another installment of our CEF Market Weekly Review, where we discuss CEF market activity from both the bottom-up – highlighting individual fund news and events – as well as top-down – providing an overview of the broader market. We also try to provide some historical context as well as the relevant themes that look to be driving markets or that investors ought to be mindful of.
This update covers the period through the first week of August. Be sure to check out our other weekly updates covering the BDC as well as the preferreds/baby bond markets for perspectives across the broader income space.
Market Action
It was a good week for the CEF sector. Although NAV performance was mixed, most sector discounts tightened, fueling price gains. July erased all of the June CEF losses and August is, so far, in the green as well.
Systematic Income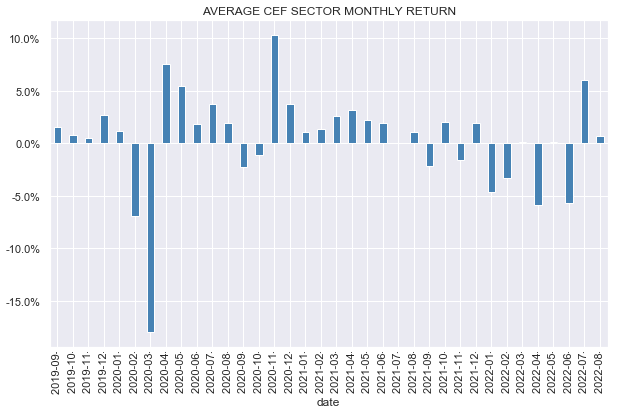
The CEF space has clawed back about half of its year-to-date losses in total return terms.
Systematic Income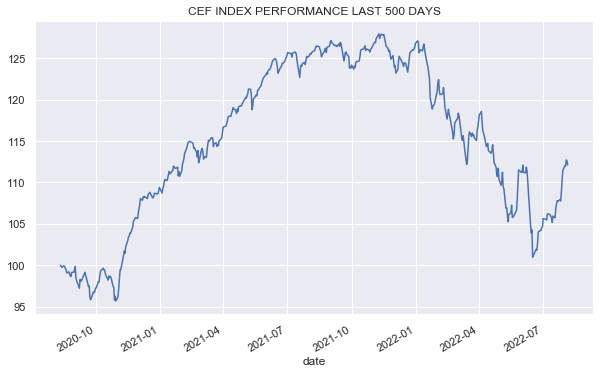
A lot of the recent gains were on the back of a tightening in discounts. Sector discounts have come in around 3-4% from their recent wides.
Systematic Income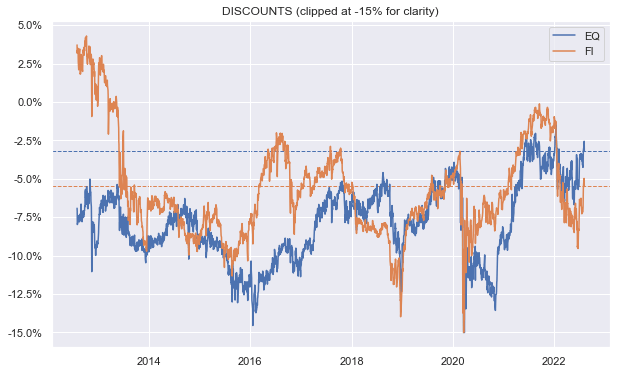
The average sector discount is now close to its pre-COVID level. In our view, the CEF market discount valuation is on the expensive side now, particularly given how much more the Fed needs to do to bring inflation (and by extension the level of economic activity) lower.
Systematic Income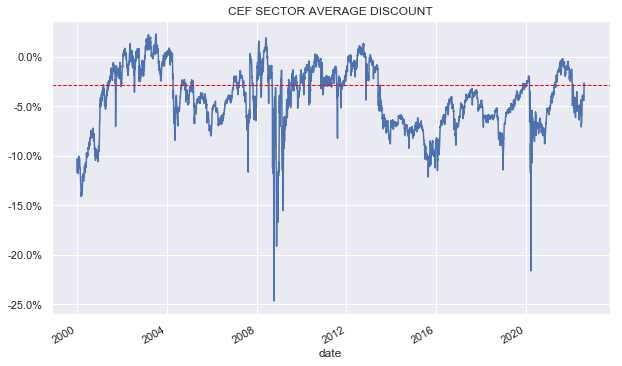
A number of sectors have rallied more than 10% from their troughs as the following chart shows. Convertibles and REITs have rallied the most.
Systematic Income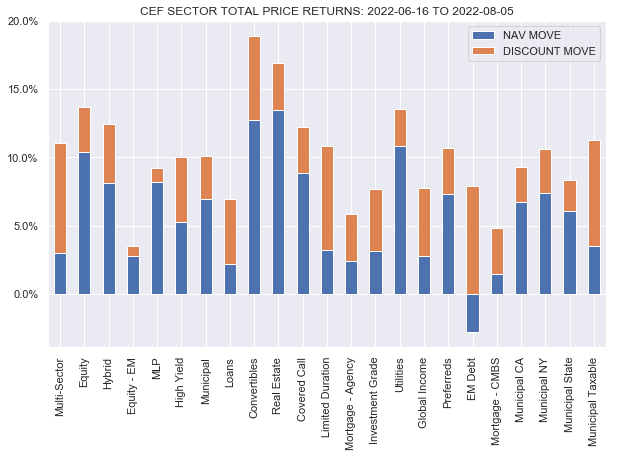
Market Themes
The performance of the CLO Equity-focused Eagle Point Credit Co (ECC) came up on the service. The fund’s 5Y total NAV return is on the order of something like 2-4% depending on whether you DRIP or not and precisely which source you are using. Given the fund’s high-octane allocation profile and very high yield that seems like a terrible result for investors. The implication here is that the fund is just bad and investors should steer clear of it.
Although this kind of “analysis” may seem intuitive and compelling, it actually does not provide any informational content. In other words, saying that a credit fund has delivered a low return in an environment when prices of credit instruments are unusually low is a simple tautology.
To illustrate why this is the case, imagine someone looking at a 10Y total return of the Nasdaq from 2000 to 2010 which was slightly negative and saying, gee whiz these Tech stocks are just not a good investment I guess. Or imagine someone looking at the negative 10Y total return of Banks from 1998 to 2008 and saying no one in their right mind should ever own a single Bank stock, common or preferred.
We can keep going here for a while, but the point is clear. If you look at the performance of a given asset over a period ending in a low price, you are going to see a bad number – that’s just math. A low return number over any given period does not actually tell investors very much about the merits of a given asset class or fund. And in fact, investors who follow this kind of view and who will tend to buy assets that have run up a whole lot (because, presumably that makes them “good”) and sell assets that have fallen sharply (because, presumably, that makes them “bad”) are going to see their wealth dwindle pretty quickly because they will keep buying high and selling low.
A much better way to approach the question of whether any given fund or asset class is attractive or not requires a bit more work. Specifically, investors should look at the fund’s total NAV performance over a flat-yield (for fixed-coupon credit assets) or flat-credit spread environment (for floating-rate credit assets).
For example, many investors were seduced to significantly overweighting Municipal bond funds in 2021 when yields were at rock-bottom levels because they saw that these funds generated something on the order of 6-7% annual returns over the last decade despite the fact that much of that strong performance was simply due to the continued fall in yields which was obviously unsustainable as many subsequently found out this year. When we did the same analysis of Municipal funds over a flat yield period we saw that the sector’s sustainable annual return was closer to 2-3% which made a lot of sense since that’s what the underlying yields were in that sector. Getting a sense of a fund’s performance over this neutral period can give investors a better sense of what they should expect from it going forward, all else equal.
Another kind of analysis which is interesting is to take the period ending today but compare the performance of multiple asset classes to each other rather than look at the performance of a single fund. For example, over the last 5 years how do high-yield bonds compare to loans, CLOs, CMBS, ABS, RMBS and other assets? That kind of cross-asset comparison can give investors a much better sense of asset class dynamics than looking at a single asset or fund.
A final key point is that investors should derive conviction about any given asset or fund from its characteristics, valuation as well as the broader market environment rather than from its recent performance.
Market Commentary
There was not much news on the CEF distribution front for August – PIMCO, BlackRock, Nuveen had no changes. Invesco had one cut from the Pennsylvania Value Municipal Income Trust (VPV). Eaton Vance had 3 raises for loan funds. Although it wasn’t as highly pronounced this week, the dynamic of cuts in fixed-rate sectors and raises in floating-rate sectors continues.
The CLO Equity focused Oxford Lane Capital Corp (OXLC) released two monthly NAVs in quick succession. The June NAV was delayed by over a month due to the fiscal quarter end. The July NAV was released unusually quickly, after just 2 days, almost as if the company wanted to move past the terrible June numbers as quickly as possible. The NAV fell 14% to $5.07 in June and then bounced 7% in July, with the overall move going from $5.92 in May to $5.41 in July. Our current daily NAV estimate of $5.50 means the fund is trading around a 15% premium, which is fairly elevated historically.
Systematic Income CEF Tool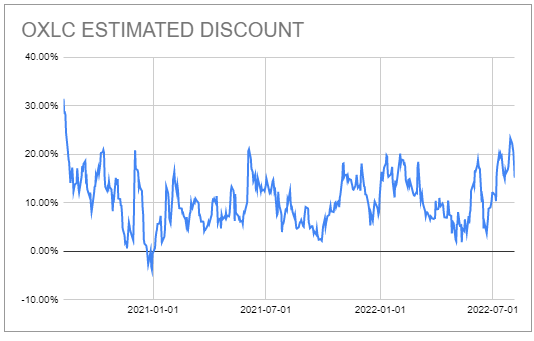
Stance And Takeaways
Last week, we expressed skepticism that the Fed’s apparent dovish pivot was real. This week’s sharp rise in short-term rates as well as a pause in the tightening of credit spreads appears to bear this out. We suspect that even if inflation does peak in the coming months, it is very unlikely to subside quickly back to the Fed’s target of 2% as the market expects. This suggests that short-term rates could stay elevated for longer than the market thinks, and that credit spreads could rise back up. For this reason, we continue to look for attractively-valued funds with both floating-rate exposure such as the Western Asset Mortgage Opportunity Fund (DMO) as well as higher-quality funds such as the Tax-Advantaged Preferred Securities and Income Fund (PTA). We would consider adding to both on pullbacks in risk sentiment.
Be the first to comment