

MicroStockHub
In the middle of any extended drawdown, getting your bearings as an investor can be very difficult. In this article we provide a bit of context around the current drawdown in the CEF space, paint a bigger picture of where it stands at the moment and highlight attractive opportunities.
The key takeaway is that while the price action has been tough, there is little sign of investor revulsion that might indicate a sharp turning point. And while underlying asset yields are attractive, credit spreads remain tight by the standards of previous sell-offs or by the likely recessionary outcome next year.
This suggests that we are far from a “buy everything” kind of market environment. That said, opportunities in specific pockets of the CEF space are available and we highlight these below.
Where Things Stand
In this section, we add some context of where the CEF market stands at the moment. Making allocation decisions depends as much as identifying bottom-up opportunities as well as being aware of some of the bigger picture issues and trends.
The chart below shows daily CEF volume. This indicator can be useful to identify market sentiment and gauging a sense of investor revulsion. Over the last week, volumes have been elevated but not excessively so. CEF volume is running at about half the level we saw earlier in the year and at about a quarter of what we saw in 2020. So far the CEF market is not begging for mercy.
Systematic Income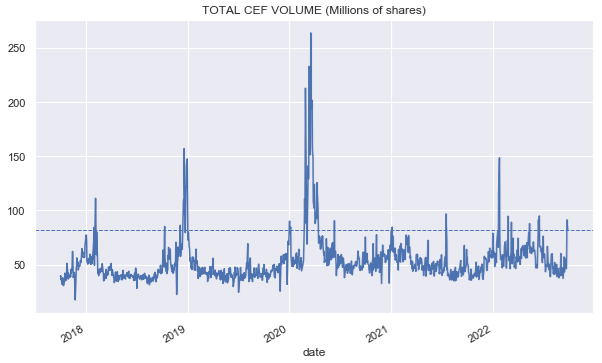
What does seem extreme to our eyes is the consistency of weakness. The chart below shows the 1-week rolling average proportion of declining funds. It highlights that this past week especially has been unusually tough for the CEF space.
Systematic Income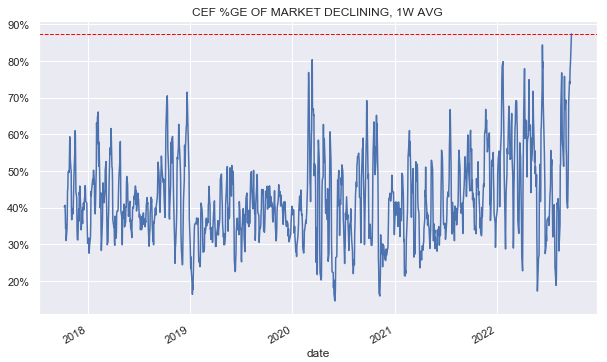
If we take a look at September, we see that it has been much worse than any of the previous months since Mar-2020 with an average CEF sector return of a bit worse than -10%.
Systematic Income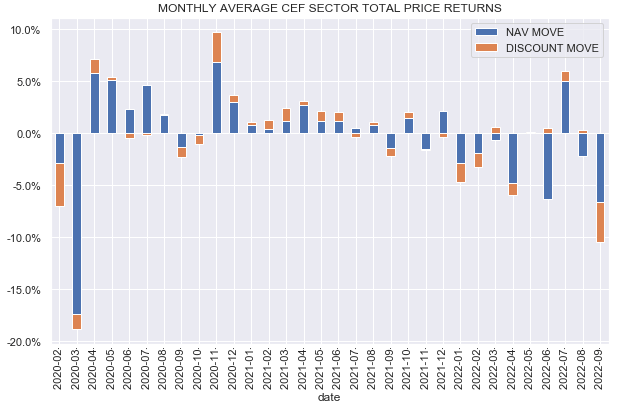
Hardest hit sectors have been higher-beta assets like REITs and MLPs as well as longer-duration sectors like Taxable Munis.
Systematic Income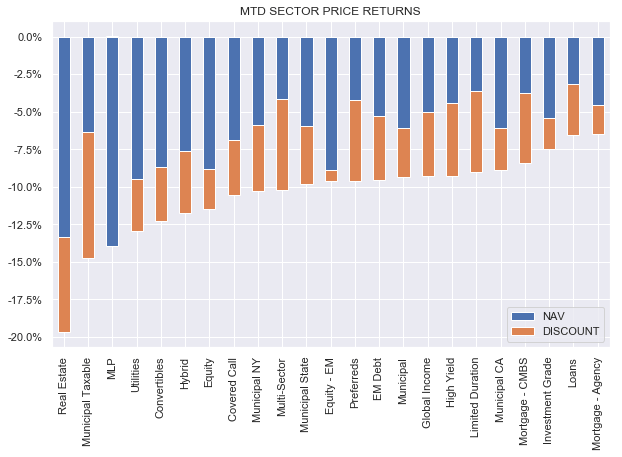
The broader CEF space is now below its June level and back to its level two years ago.
Systematic Income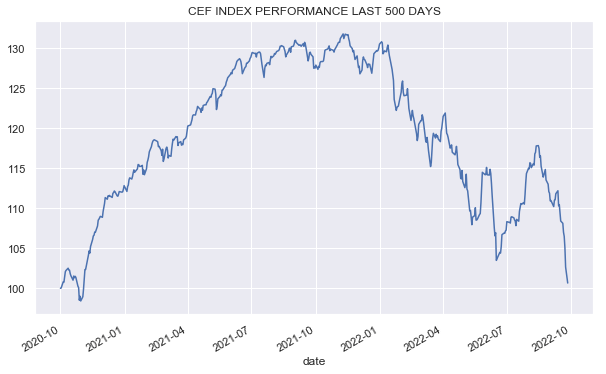
The average fixed-income CEF sector discount is nearly at 10% which has been wider fairly briefly a few times in the past decade.
Systematic Income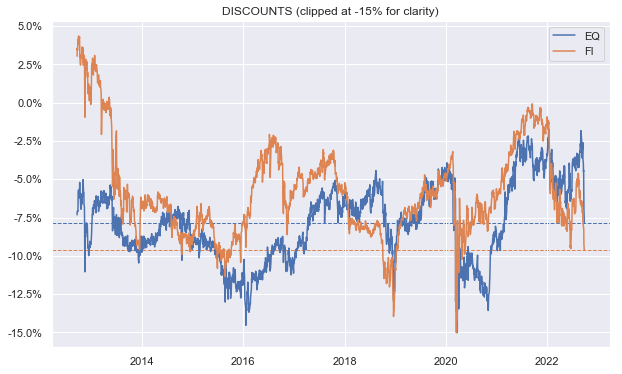
If we look at the credit CEF sub-sector over the last decade across two dimensions of HY bond yields (x-axis) which we use as a proxy for the overall level of income asset yields in the market as well as credit CEF discounts (y-axis), we see that we are now at one of the most attractive periods.
Systematic Income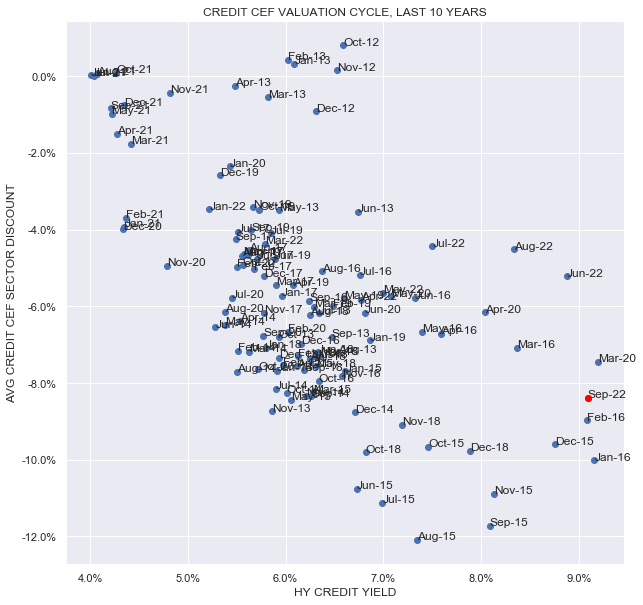
The current figure is even better than what we saw at the end of March-2020 – even though asset yields were a little higher then, discounts are higher today. Keep in mind that on a trough intra-month basis we are not yet close to what we saw in March-2020. That said, the overall valuation picture is a very strong one – even if markets continue weakening from here, putting capital to work incrementally at current levels is clearly not a dumb move.
The chart below shows roughly what the current underlying portfolio yield looks like for an average High Yield corporate bond CEF. Keep in mind this is before taking into account fees, leverage and discounts.
Systematic Income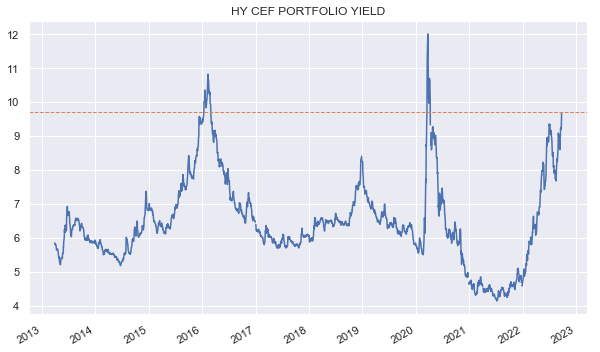
Where does this leave us?
It’s important to note that while the overall picture of the CEF market is an attractive one, there are a few things to keep in mind.
First, despite the strength of the recent sell-off, market volumes are nowhere near panic territory, indicating that we could easily see a bigger wobble ahead.
Two, while overall yields are very attractive by historical standards, credit spreads remain stubbornly modest, trading below 5%. A recession or a typical market panic should push spreads out to 7-8%.
Three, leverage costs are unusually high by recent historic standards and will only increase from here. The chart below shows the yield that a typical HY corporate bond leveraged CEF can generate after fees and leverage costs and this number is not significantly above its June level and well below previous peaks.
Systematic Income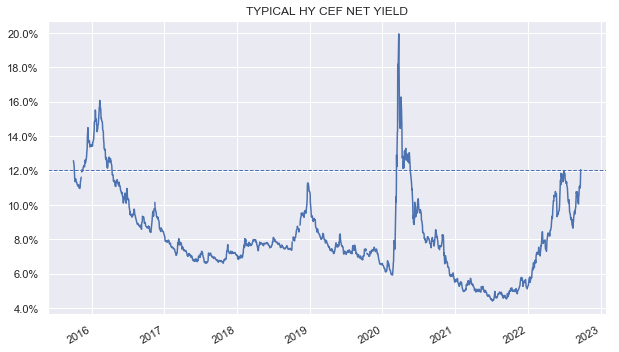
In conclusion, we are not in a “buy everything” territory. Many funds are very attractive but investors need to be selective to avoid pockets of the market that are not particularly attractive just yet. These less attractive include many equity-linked funds which remain expensive in aggregate. It includes longer-duration, lower-quality funds. And it includes funds with fixed-rate assets and floating-rate leverage instruments which will see a significant reduction in their income over time.
Where do we see opportunities?
We continue to see value in the Angel Oak Financial Strategies Income Term Trust (FINS) with a 8.7% yield and a 14% discount. The fund is allocated to mostly floating-rate investment-grade bonds and has about half of its leverage cost fixed.
We also like the higher-quality preferreds fund Nuveen Preferred and Income Term Fund (JPI) which trades at a 5.9% discount and 8.45% yield. The fund’s discount is not particularly exceptional, however, that’s because its 2024 expected termination date provides a valuation anchor as well as a 3% annual performance tailwind. The fund has a relatively modest 3.66 duration.
The Western Asset Mortgage Opportunity Fund (DMO) allocates mostly to non-agency residential mortgages and trades at a 15.4% discount and 11% yield. It has a mostly floating-rate profile and fixed-rate liabilities and we expect its income level to continue to increase through next year.
The PIMCO Dynamic Income Opportunities Fund (PDO) trades at a 9.6% discount and an 11.45% yield. It recently raised its distribution and continues to boast a high distribution coverage level. The fund has a multi-sector credit portfolio with a modest duration of 2.9.
For more adventurous investors, it makes sense to start considering the XAI Octagon Floating Rate & Alternative Income Term Trust Fund (XFLT) which boasts a mix of individual loans and CLO Equity securities and has a 14.4% yield with a rare 7% discount. Although credit spreads can move higher in the medium term, the valuable CLO Equity reinvestment option can generate additional value for the fund by reallocating loan repayments into loans trading below par.
Be the first to comment