

ClaudineVM
Earnings of Cathay General Bancorp (NASDAQ:CATY) will likely continue to surge through the end of 2023 on the back of strong top-line growth. The margin will continue to grow and support the top line, albeit at a slower pace. Further, strong job markets and healthy economic activity will boost loan growth, which will support earnings. Overall, I’m expecting Cathay General to report earnings of $4.93 per share for 2022, up 30%, and $5.44 per share for 2023, up 10% year-over-year. Compared to my last report on the company, I’ve raised my earnings estimates because I’ve revised upwards by margin estimates. Next year’s target price suggests a high upside from the current market price. Therefore, I’m maintaining a buy rating on Cathay General Bancorp.
Margin Expansion Likely to Decelerate
Cathay General’s margin expanded by a remarkable 31 basis points in the third quarter following the 26-basis points growth in the second quarter of the year. Going forward, the margin won’t fare as well partly because the pace of the fed funds rate hike has declined from the third quarter’s level. Moreover, Cathay General took some actions on the funding side during the third quarter, which will hurt the margin.
The company’s advances from the Federal Home Loan Bank (“FHLB”) surged by 279% to $360 million during the quarter. This growth will hurt the margin going forward because FHLB carried a high rate of more than 2.3% during the third quarter, as opposed to the average interest-bearing deposit cost of 0.69%, as mentioned in the 10-Q filing. According to my calculations, this additional borrowing could raise the funding cost by three basis points. The full-quarter impact will be seen in the results for the fourth quarter of the year.
Further, the deposit mix has worsened during the quarter. Non-interest-bearing deposits were down to 23.7% of total deposits at the end of September from 24.2% at the end of June and 24.9% at the end of December 2021. Moreover, there is a good chance the deposit mix will worsen even further in the upcoming quarters. The management mentioned in the conference call that they are seeing an increased interest in certificates of deposits (“CD”) as rates are rising. Customers are wanting to shift their lower-earning deposits into CDs.
The management mentioned in the earnings presentation that it has increased its margin outlook for 2022 from 3.50% – 3.65% to 3.60% – 3.70%. Considering the factors given above and management’s guidance, I’m expecting the margin to grow by five basis points in the last quarter of 2022 and ten basis points in 2023. Compared to my last report, I’ve raised my margin estimates for both years because the third quarter’s performance beat my expectations.
Further Reduction in Loan Growth Rate Likely
Loan growth slowed down to 1.8% during the third quarter, from 2.2% in the second quarter and 6.5% in the first quarter of the year. Further deceleration is likely because of the high interest-rate environment, which is already hurting credit demand.
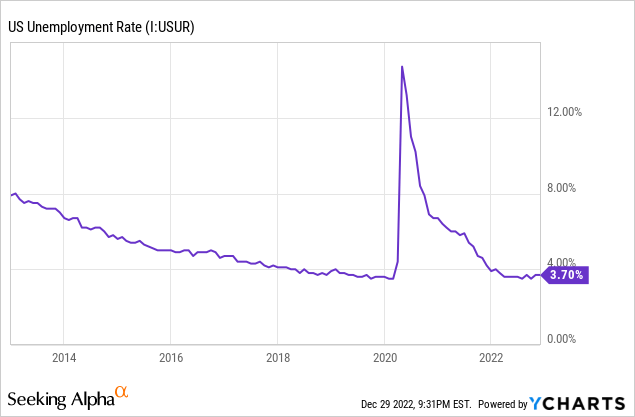
On the plus side, strong job markets will keep loan growth from declining too low. Cathay General caters to high-density Asian-populated urban areas across the country, from California to New York. Therefore, the national average unemployment rate is an appropriate proxy for the company’s markets. As shown below, the unemployment rate has remained near record lows throughout 2022.
Moreover, as the loan portfolio is concentrated in New York and California, the coincident economic activity indexes of both states are good gauges of credit demand. As shown below, California currently has steeper growth in economic activity than the national average and New York. (The base year is 2007 for all three trend lines.)
The Federal Reserve Bank of Philadelphia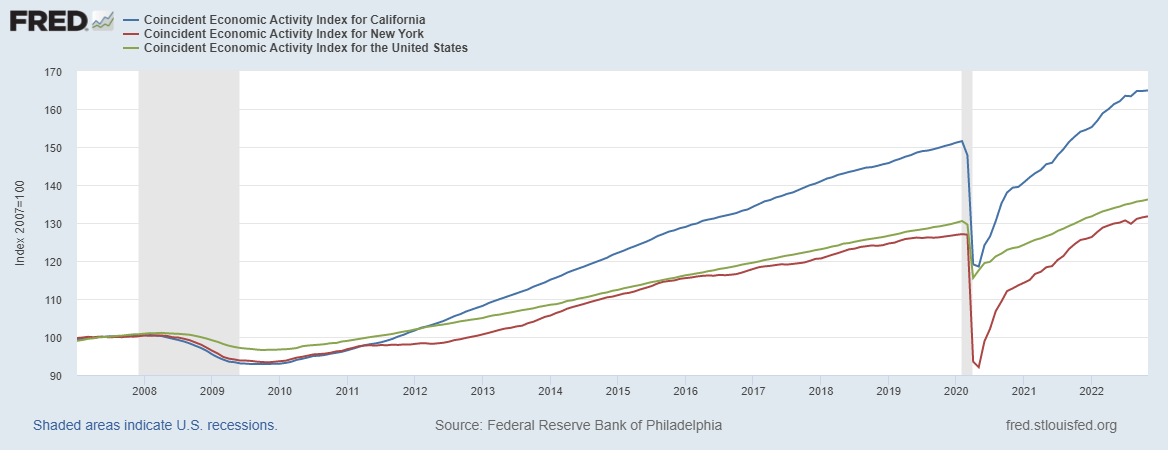
Overall, I’m expecting the loan growth to slow down to 1.25% in the fourth quarter and remain at that level throughout 2023. Further, I’m expecting deposits to grow somewhat in line with loans. The following table shows my balance sheet estimates.
| Financial Position | FY18 | FY19 | FY20 | FY21 | FY22E | FY23E |
| Net Loans | 13,872 | 14,952 | 15,475 | 16,202 | 18,175 | 19,101 |
| Growth of Net Loans | 8.9% | 7.8% | 3.5% | 4.7% | 12.2% | 5.1% |
| Other Earning Assets | 1,955 | 1,914 | 2,343 | 3,443 | 2,532 | 2,661 |
| Deposits | 13,702 | 14,692 | 16,109 | 18,059 | 18,873 | 19,834 |
| Borrowings and Sub-Debt | 737 | 844 | 293 | 193 | 501 | 499 |
| Common equity | 2,122 | 2,294 | 2,418 | 2,446 | 2,434 | 2,634 |
| Book Value per Share ($) | 26.0 | 28.6 | 30.3 | 31.1 | 33.1 | 35.9 |
| Tangible BVPS ($) | 21.4 | 23.9 | 25.6 | 26.3 | 27.9 | 30.7 |
| Source: SEC Filings, Author’s Estimates (In USD million unless otherwise specified) | ||||||
Earnings Likely to Grow by 10% Next Year
The anticipated loan growth and slight margin expansion will continue to lift earnings through the end of 2023. Meanwhile, I’m expecting the provisioning for expected loan losses to remain near normal levels. Cathay General’s exposure to Hong Kong is limited, so I’m not worried that any of China’s problems, including the Covid resurgence, will hurt Cathay General. Overall, I’m expecting the net provision expense to make up around 0.08% of total loans in 2023, the same as the average for 2017 to 2019.
I’m expecting the company to report earnings of $4.93 per share for 2022, up 30% year-over-year. For 2023, I’m expecting the company to report earnings of $5.44 per share, up 10% year-over-year. The following table shows my income statement estimates.
| Income Statement Summary | FY18 | FY19 | FY20 | FY21 | FY22E | FY23E |
| Net interest income | 566 | 575 | 552 | 598 | 736 | 850 |
| Provision for loan losses | (5) | (7) | 58 | (16) | 15 | 16 |
| Non-interest income | 32 | 45 | 43 | 55 | 59 | 50 |
| Non-interest expense | 264 | 277 | 283 | 287 | 309 | 364 |
| Net income – Common Sh. | 272 | 279 | 229 | 298 | 362 | 400 |
| EPS – Diluted ($) | 3.33 | 3.48 | 2.87 | 3.80 | 4.93 | 5.44 |
| Source: SEC Filings, Author’s Estimates(In USD million unless otherwise specified) | ||||||
In my last report on Cathay general, I estimated earnings of $4.59 per share for 2022 and $5.22 per share for 2023. I’ve raised my earnings estimates mostly because I’ve revised upwards the margin estimates following the third quarter’s result release.
My estimates are based on certain macroeconomic assumptions that may not come to fruition. Therefore, actual earnings can differ materially from my estimates.
Maintaining a Buy Rating Due to a High Total Expected Return
Cathay General is offering a dividend yield of 3.3% at the current quarterly dividend rate of $0.34 per share. The earnings and dividend estimates suggest a payout ratio of 25% for 2023, which is below the five-year average of 37%. The below-average payout ratio suggests that there is plenty of room for a dividend hike. Nevertheless, I’m not expecting any change in the dividend level because Cathay General does not often increase its dividends.
I’m using the historical price-to-tangible book (“P/TB”) and price-to-earnings (“P/E”) multiples to value Cathay General. The stock has traded at an average P/TB ratio of 1.37 in the past, as shown below.
| FY19 | FY20 | FY21 | Average | |||
| Tangible BVPS ($) | 23.9 | 25.6 | 26.3 | |||
| Average Market Price ($) | 35.9 | 27.2 | 40.4 | |||
| Historical P/TB | 1.50x | 1.06x | 1.54x | 1.37x | ||
| Source: Company Financials, Yahoo Finance, Author’s Estimates | ||||||
Multiplying the average P/TB multiple with the forecast tangible book value per share of $30.7 gives a target price of $41.9 for the end of 2023. This price target implies a 2.4% upside from the December 29 closing price. The following table shows the sensitivity of the target price to the P/TB ratio.
| P/TB Multiple | 1.17x | 1.27x | 1.37x | 1.47x | 1.57x |
| TBVPS – Dec 2023 ($) | 30.7 | 30.7 | 30.7 | 30.7 | 30.7 |
| Target Price ($) | 35.8 | 38.8 | 41.9 | 45.0 | 48.0 |
| Market Price ($) | 41.0 | 41.0 | 41.0 | 41.0 | 41.0 |
| Upside/(Downside) | (12.6)% | (5.1)% | 2.4% | 9.8% | 17.3% |
| Source: Author’s Estimates |
The stock has traded at an average P/E ratio of around 10.2x in the past, as shown below.
| FY19 | FY20 | FY21 | Average | |||
| Earnings per Share ($) | 3.5 | 2.9 | 3.8 | |||
| Average Market Price ($) | 35.9 | 27.2 | 40.4 | |||
| Historical P/E | 10.3x | 9.5x | 10.7x | 10.2x | ||
| Source: Company Financials, Yahoo Finance, Author’s Estimates | ||||||
Multiplying the average P/E multiple with the forecast earnings per share of $5.44 gives a target price of $55.3 for the end of 2023. This price target implies a 35.1% upside from the December 29 closing price. The following table shows the sensitivity of the target price to the P/E ratio.
| P/E Multiple | 8.2x | 9.2x | 10.2x | 11.2x | 12.2x |
| EPS 2023 ($) | 5.44 | 5.44 | 5.44 | 5.44 | 5.44 |
| Target Price ($) | 44.4 | 49.9 | 55.3 | 60.8 | 66.2 |
| Market Price ($) | 41.0 | 41.0 | 41.0 | 41.0 | 41.0 |
| Upside/(Downside) | 8.5% | 21.8% | 35.1% | 48.4% | 61.7% |
| Source: Author’s Estimates |
Equally weighting the target prices from the two valuation methods gives a combined target price of $48.6, which implies an 18.7% upside from the current market price. Adding the forward dividend yield gives a total expected return of 22%. Hence, I’m maintaining a buy rating on Cathay General Bancorp.
Be the first to comment