


Fly View Productions/E+ via Getty Images
One thing that I’ve learned about the clothing and apparel market during my time as an investor is that the space can be highly competitive. At the same time, however, it can be particularly rewarding for the companies with the right product and the right messaging. One way to improve the chance of success in this space is to find a niche to grow into. And one company that has done that over its life by focusing on the branded clothing for babies and young children category is Carter’s (NYSE:CRI), the owner of the Carter’s and OshKosh B’gosh megabrands. Recently, financial performance achieved by the company has been a bit disappointing. Sales, profits, and cash flows have all taken a step back because of broader economic concerns. At the same time, however, shares of the company have outperformed the broader market. This is the benefit that comes with investing in value stocks. Even a company that underperforms fundamentally can fare well against the market if purchased at the right price. Investors would be right, however, to wonder just how much more upside potential still exists considering current conditions. But based on how shares are priced right now, I would say that some additional upside could be warranted moving forward.
Still a nice fit
Near the end of August of 2022, I wrote an article discussing the bullish case for Carter’s. In that article, I discussed the company’s rocky operating history. At the same time, I pointed out that the most recent performance achieved by the company had not been great. This even led me to conclude that the firm could see some additional pain, but that did not deter me from rating it a ‘buy’ based on how cheap shares were. Since the publication of that article, the market has rewarded shareholders rather handsomely. While the S&P 500 is down 5.4%, shares of Carter’s have generated upside of 3.3%.
Author – SEC EDGAR Data
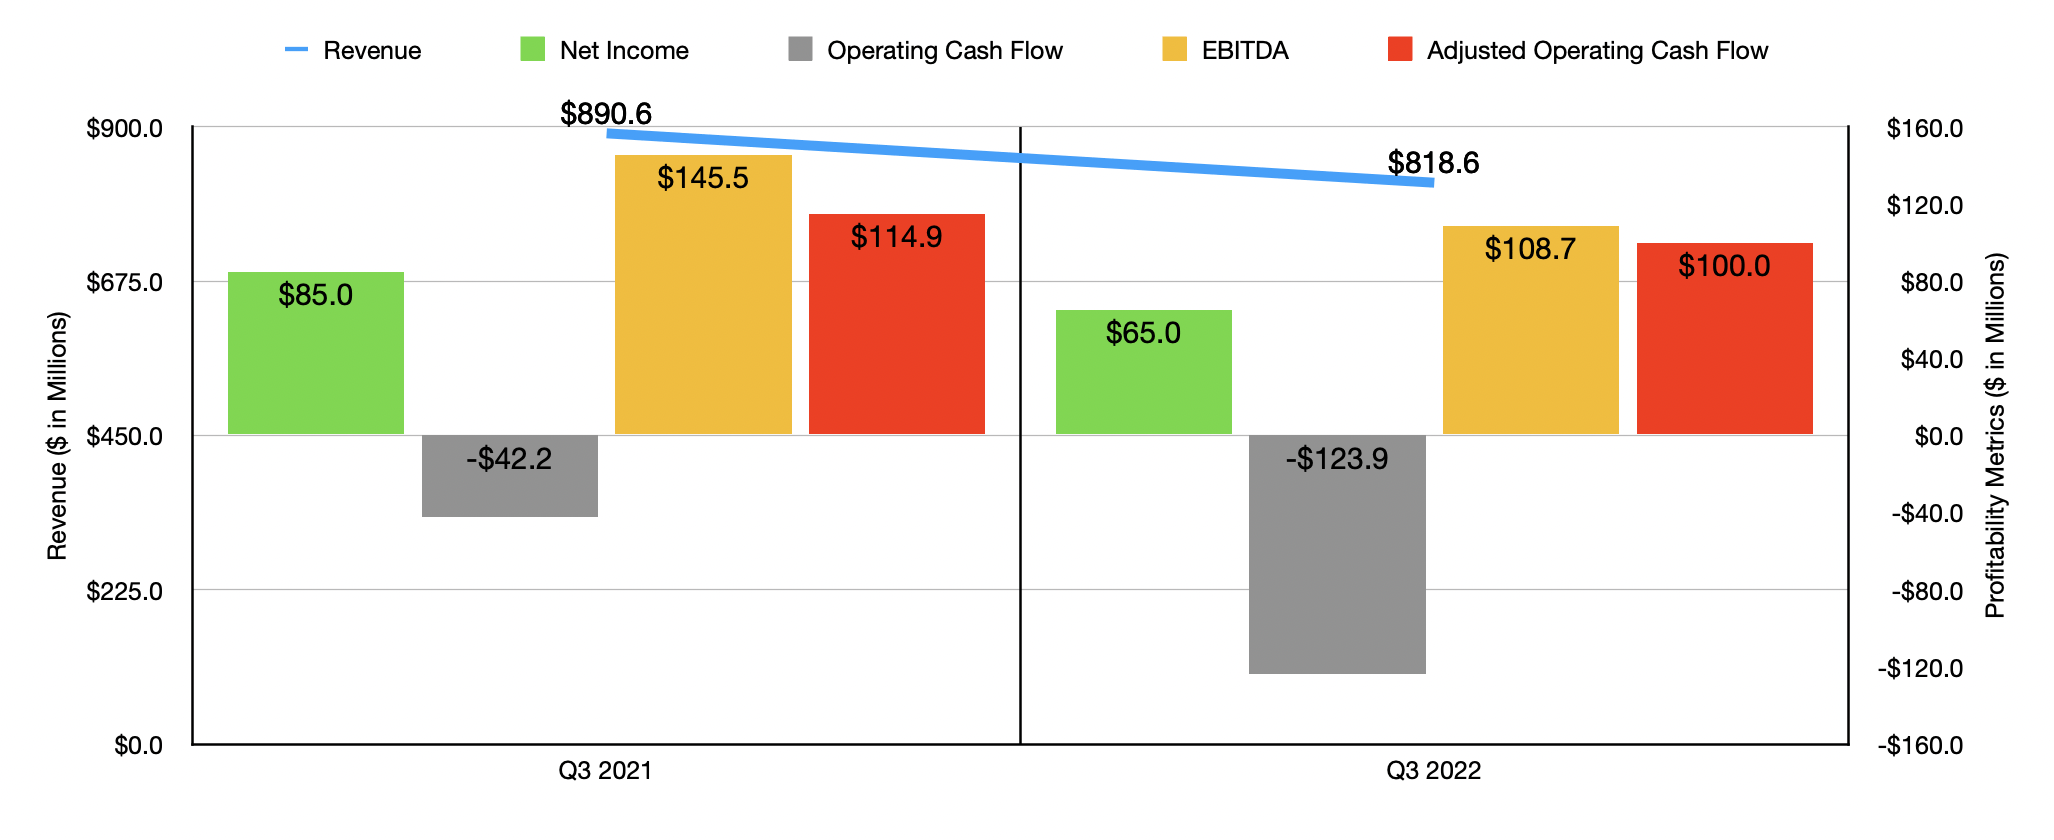
This performance disparity is really surprising when you look at the fundamental data provided by management. Consider the third quarter of the company’s 2022 fiscal year, the only quarter for which new data is available that was not available when I last wrote about the firm. Sales for that time came in at $818.6 million. That’s 8.1% lower than the $890.6 million reported one year earlier. According to management, this decrease was primarily driven by lower sales in the company’s US Retail segment and across Canada. Here at home, the company faced the absence of pandemic relief money that was previously circulating through the economy, plus it was faced with inflationary pressures, lower consumer demand, and a decrease in the number of stores it had in operation. The firm also suffered to the tune of $2.9 million from foreign currency fluctuations.
This decrease in revenue brought with it a drop in profitability. For the third quarter of 2022, net income came in at $65 million. This is down from the $85 million reported one year earlier. The drop in revenue certainly had an impact, as did a modest decrease in the company’s gross profit margin because of supply chain issues, inflationary pressures, and other factors outweighing price increases. But perhaps a bigger impact for the company from a profitability perspective than its cost of goods sold was the selling, general, and administrative cost side. This dropped by 2.1% of sales because of higher fixed costs in relation to revenue, higher transportation costs, and other miscellaneous factors. Other profitability metrics followed a similar path. Operating cash flow went from negative $42.2 million to negative $123.9 million. If we adjust for changes in working capital, it still would have fallen from $114.9 million to $100 million. Also on the decline was EBITDA, with the metric dropping from $145.5 million to $108.7 million.
Author – SEC EDGAR Data
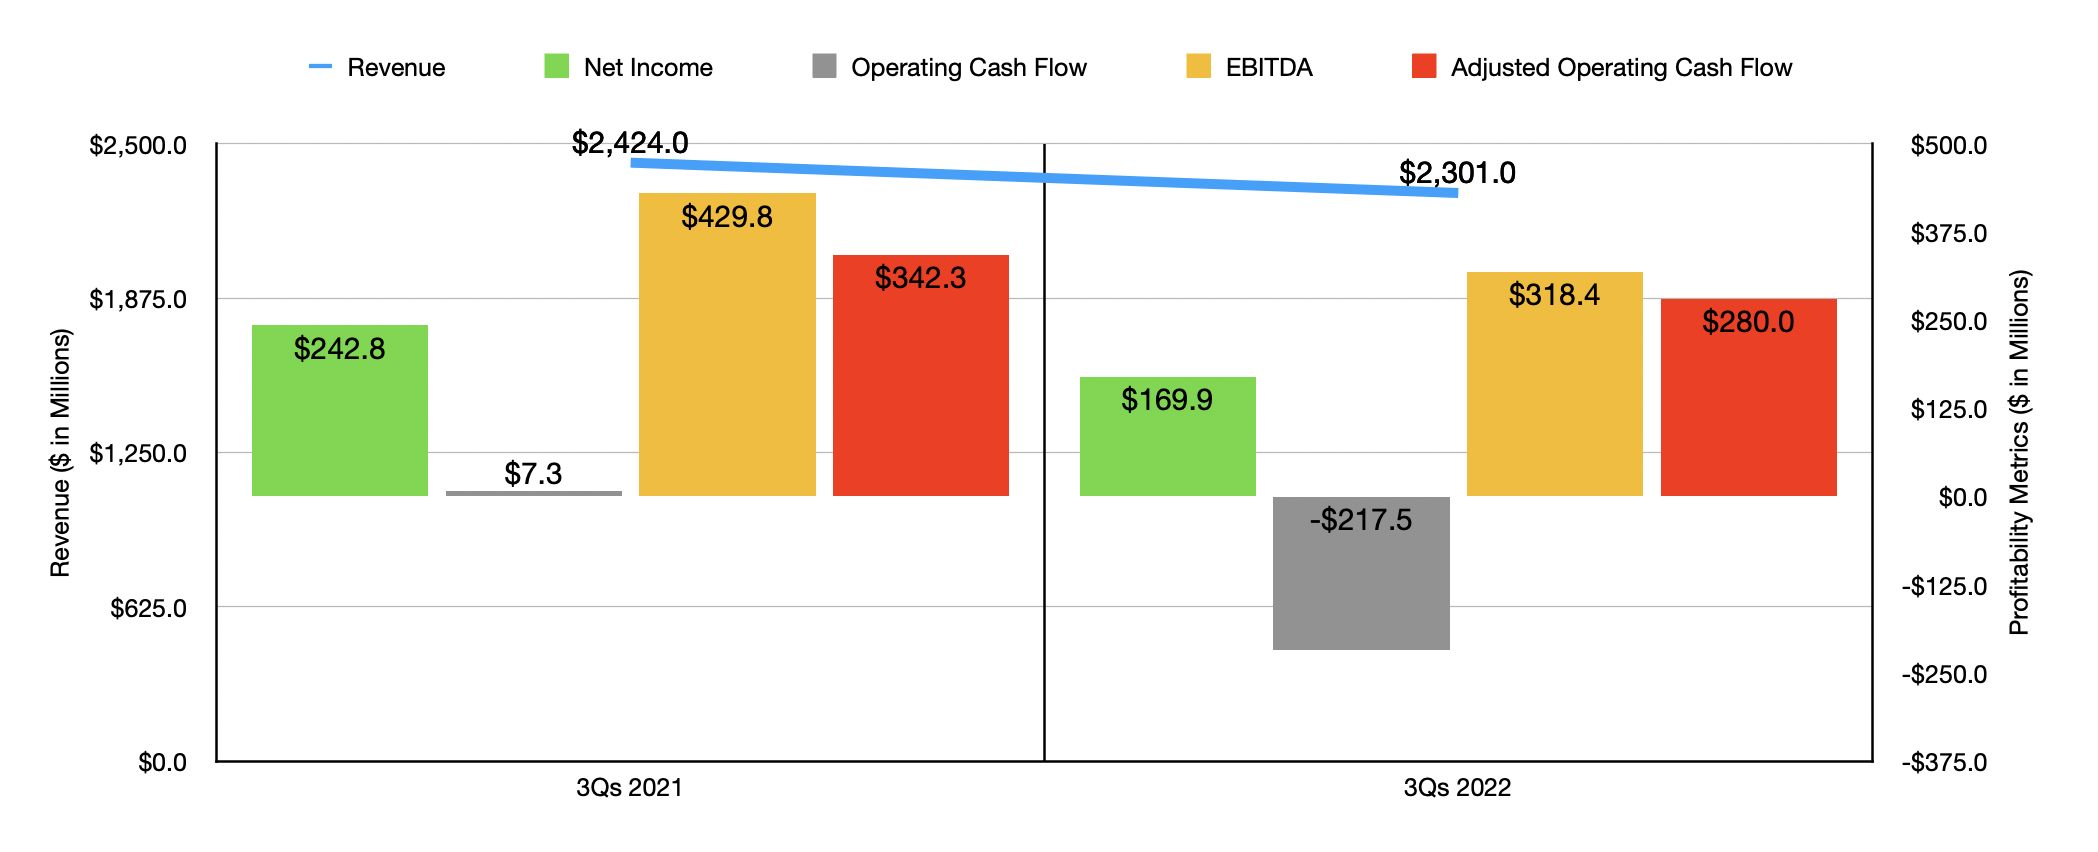
What the company endured during the third quarter was indicative of the pain it had experienced for the first nine months of 2022 as a whole. Revenue, for instance, dropped from $2.42 billion in the first nine months of 2021 to $2.30 billion during the same time of the 2022 fiscal year. The same factors led the way here, with the only bright spot being the 1.3% rise in revenue for the US Wholesale segment and the 2.6% increase in revenue associated with the firm’s International operations. The same cost pressures for the company pushed net profits down from $242.8 million to $169.9 million. Operating cash flow went from $7.3 million to negative $217.5 million, while the adjusted figure for this went from $342.3 million to $280 million. And finally, EBITDA also took a beating, dropping from $429.8 million to $318.4 million.
When it comes to the 2022 fiscal year in its entirety, management is forecasting revenue of between $3.145 billion and $3.185 billion. At the midpoint, this should translate to a 9.2% decline compared to the $3.486 billion the company reported for 2021. The biggest pain for the firm will come from a 10% to 15% decline in US Retail segment comparable sales. Under the company’s other segments, as well as under the US Retail segment, sales should be pressured by supply chain issues and reduced consumer demand. Earnings per share, meanwhile, should be between $6.05 and $6.65. At the midpoint, this would translate to net income of $242.9 million. Management has not provided any guidance when it comes to other profitability metrics. But if we annualize results experienced so far, we should anticipate adjusted operating cash flow of $366.5 million and EBITDA of $440.1 million.
Author – SEC EDGAR Data
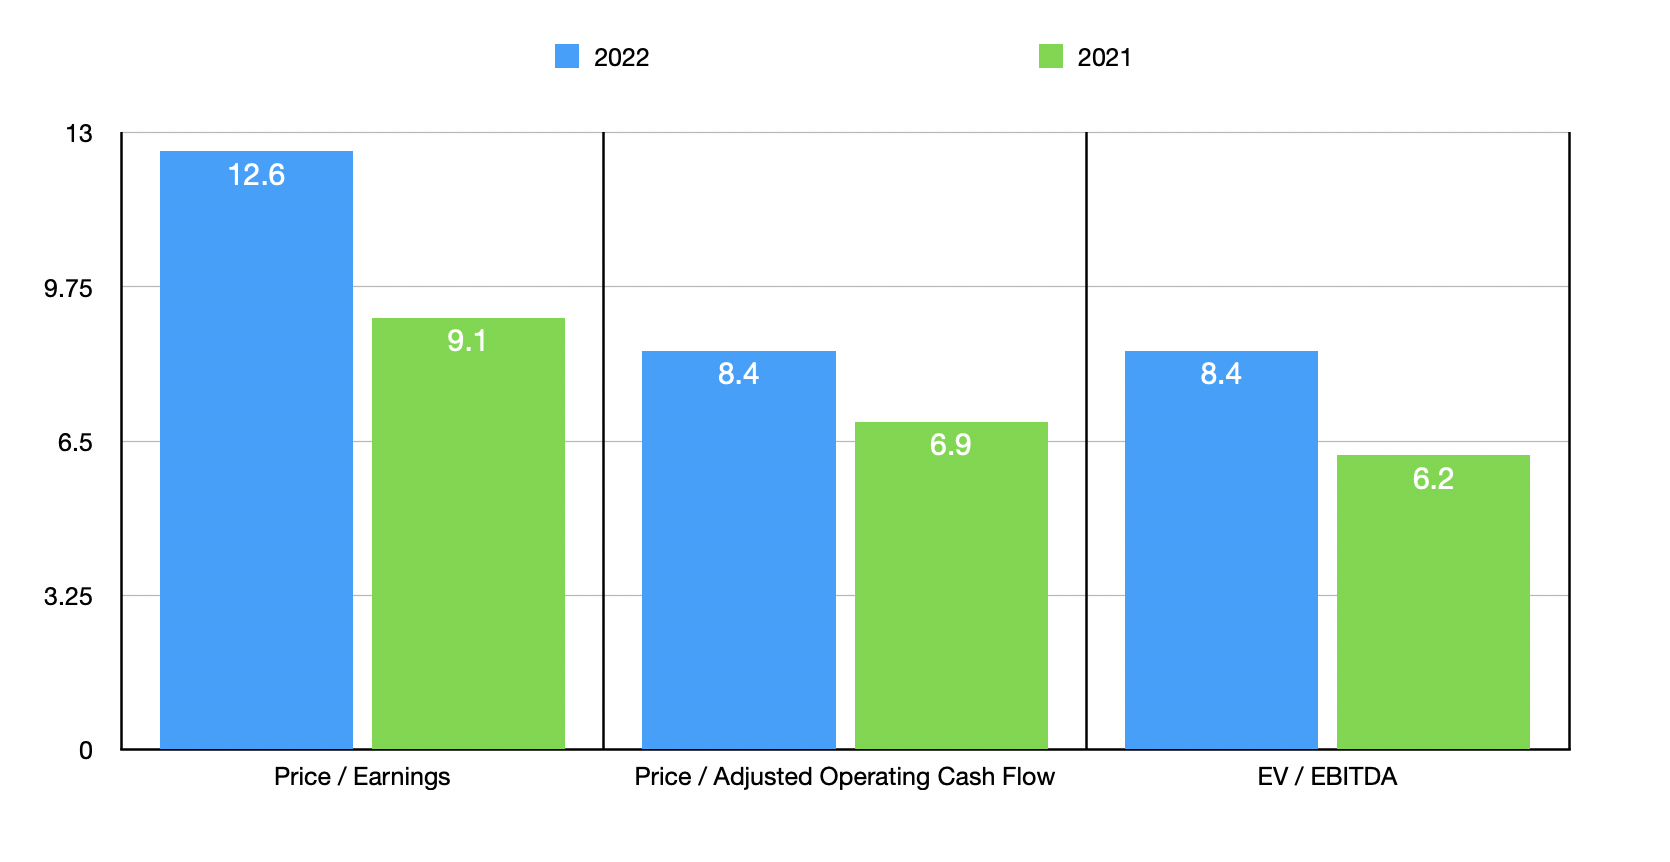
Based on these figures, the company is trading at a forward price-to-earnings multiple of 12.6. The price to adjusted operating cash flow multiple should be 8.4, while the EV to EBITDA multiple should match it. By comparison, if the company were to revert back to the figures achieved in 2021, these multiples would be 9.1, 6.9, and 6.2, respectively. As part of my analysis, I compared the company to five similar firms. On a price-to-earnings basis, the four companies with positive results ranged from a low of 8 to a high of 34.7. Three of the four companies were cheaper than Carter’s. Using the price to operating cash flow approach, the range was from 9.8 to 30.2. In this case, our target was the cheapest of the group. And when it comes to the EV to EBITDA approach, the range was from 7.2 to 37, with only one of the five firms being cheaper than our prospect.
| Company | Price / Earnings | Price / Operating Cash Flow | EV / EBITDA |
| Carter’s | 12.6 | 8.4 | 8.4 |
| Hanesbrands (HBI) | 8.0 | 9.8 | 9.5 |
| Ermenegildo Zegna (ZGN) | N/A | 10.9 | 37.0 |
| Kontoor Brands (KTB) | 11.1 | 30.2 | 8.9 |
| Canada Goose Holdings (GOOS) | 34.7 | 25.7 | 14.0 |
| Oxford Industries (OXM) | 11.3 | 14.2 | 7.2 |
Takeaway
Fundamentally speaking, Carter’s is showing signs of continued deterioration. It is possible this trend could continue in the near term and investors would be wise to watch what numbers are reported by management very closely. As it stands now, shares still do look cheap enough to warrant some upside potential. Just enough for me to rate this a soft ‘buy’, but if the pain does worsen materially from here, the firm could ultimately be due for a downgrade. So what the company reports in the next quarter or two could be very important.
Be the first to comment