

Darren415
This article was first released to Systematic Income subscribers and free trials on Aug. 30.
In this article, we catch up on Q2 results from the business development company (“BDC”) Carlyle Secured Lending Inc. (NASDAQ:CGBD). CGBD is currently trading at a dividend yield of 11% and a valuation of 86%.
CGBD has been one of the strongest performers in the BDC sector this year with a 12% total return – outpacing the sector by about 16%. This reflects a combination of an above-average yield, low starting valuation and a relatively resilient portfolio. We have held CGBD in our High Income Portfolio since last year and continue to have a Buy rating on the stock.
CGBD has a credit-focused portfolio with a relatively low allocation to Equity of around 4% – about half the sector average. Its sector overweights are in Healthcare, Defense and High Tech.
CGBD
CGBD increased its base dividend from $0.32 to $0.34. However, its total declared dividend remained the same at $0.40 as the supplemental fell from $0.08 to $0.06, fully offsetting the rise in the base. Although the overall dividend remained the same, the increase in the base is an overall positive development for investors as it clearly shows that management expect the portfolio to generate a higher sustainable level of income going forward.
CGBD has put up a very impressive total return of 12% this year in the context of the BDC sector delivering a -4% total return and loan CEFs delivering a -11% total return. A lot of this owes to the fact that the stock traded at a too low valuation at the start of the year. And although the valuation has improved, it remains well below the sector average, offering potential future capital gains.
Quarter Update
Net income (blue and red bars) fell from Q1 levels but matched or beat previous quarters. As we highlighted in our previous update, Q1 adjusted net income of $0.47 was flattered by a non-recurring event – a successful exit from SolAero which contributed $0.07. Excluding SolAero, GAAP Q2 net income was actually higher than its Q1 level while adjusted net income was flat. Recall that adjusted net income includes the dividends on the preferred CGBD issued to its affiliate during the COVID crash.
Systematic Income BDC Tool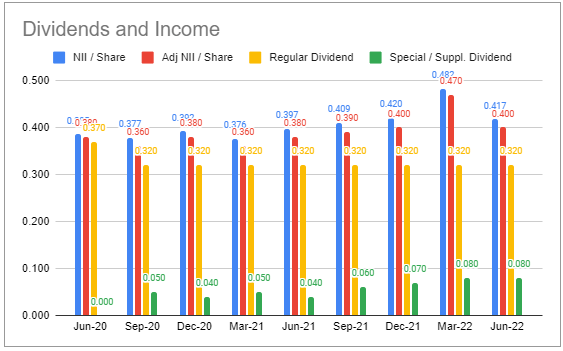
Total dividend coverage fell slightly from its Q4 level (a better benchmark given the large non-recurring non-accrual repayment in Q1) due to the supplemental dividend raise.
Systematic Income BDC Tool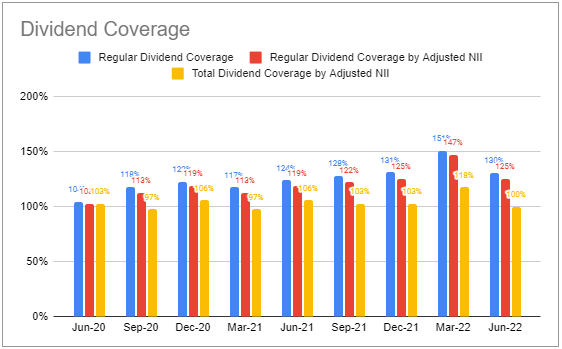
On the earnings call management are guiding to Q3 net income of $0.43-0.44 due to the expected impact of short-term rates as well as an improvement in non-accruals. This would equate to coverage of around 109% and would very likely lead to an increase in the total dividend.
NAV fell 1.8% – better than the sector average and median levels.
Systematic Income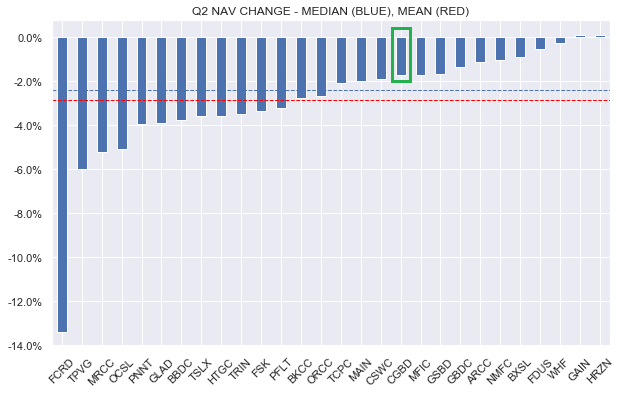
Total NAV return for the quarter was +0.6% or 0.3% above the median level and 1% above the average.
Systematic Income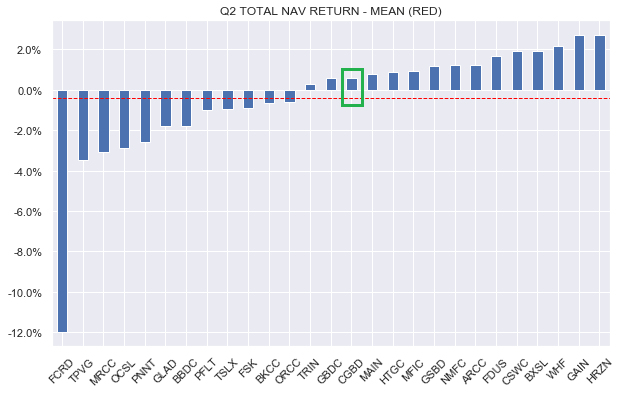
NAV remains above its pre-COVID level, which is good to see.
Systematic Income
CGBD continues to repurchase shares which drove a $0.03 gain to the NAV. The NAV drop was due entirely to unrealized losses from credit spread widening.
CGBD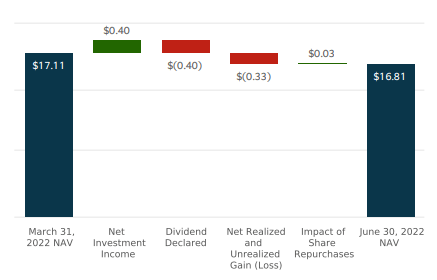
Income Dynamics
Net new investments were slightly positive for the second quarter in a row and for the 5th out of the last 6 quarters. This should continue to support income.
Systematic Income BDC Tool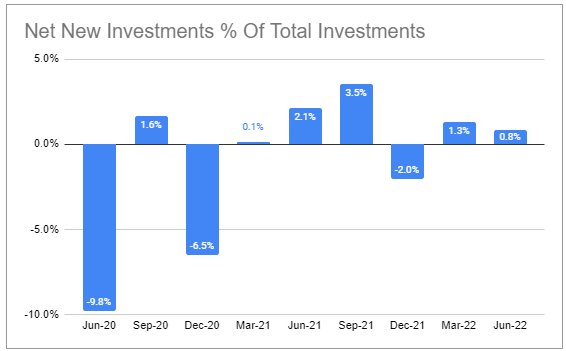
Leverage ticked higher. CGBD publishes two flavors of leverage – regulatory leverage (blue bars) treats its preferred as debt and net leverage (red bars) treats it as equity. It targets net leverage of 1.0x-1.4x so it is currently at the lower end of its range, leaving additional room for net new assets.
Systematic Income BDC Tool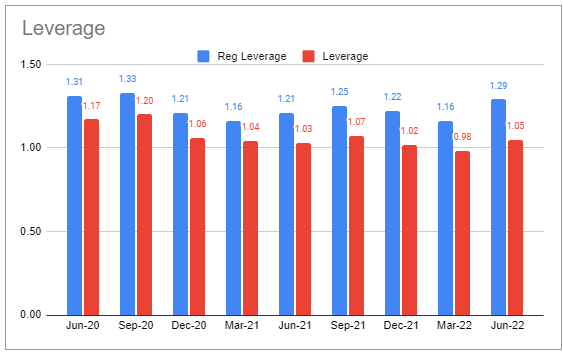
CGBD managed to reduce the spread on its revolving facility from 2.25% to 1.875% which is a great result. The facility is a chunky 41% of the company’s total borrowings. This will lift net income by about 1.9% and generate another small income tailwind. The company doesn’t have bonds coming up for refinancing until 2024.
The weighted-average yield on assets moved higher on the back of higher base rates.
Systematic Income BDC Tool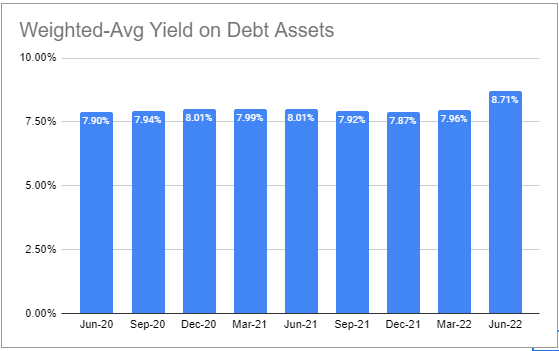
CGBD is well set up to deliver higher net income on the back of rising short-term rates. It is now out of the Libor-floor driven NII valley which has held back its net income in Q2. Its net income beta to higher rates is now among the highest in the sector.
Systematic Income BDC Tool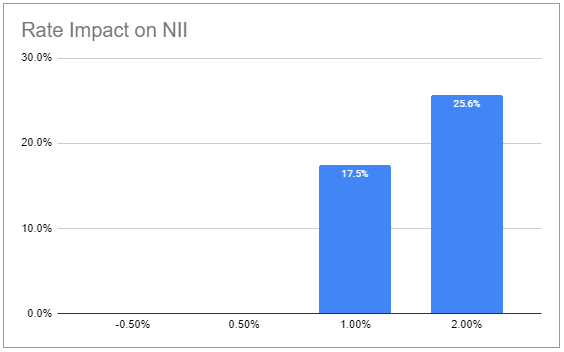
Management highlighted three key drivers of higher net income going forward: an improvement in non-accruals which is discussed in more detail below, wider spreads on new investments and a continued rise in short-term rates.
Portfolio Quality
There were no new non-accruals. The fair-value of non-accruals ticked higher to 4%, however, this was due to mark-ups on existing non-accruals. Derm Growth which is a chunky 4.9% of net assets was placed back on partial accrual status at the start of Q3 and this will drive non-accruals to a sub-3% level as well as contributing a penny to net income. The other large non-accrual position – Direct Travel – which makes up 3.5% of net assets is improving according to management as air travel moves closer to its pre-COVID trend level. Based on these numbers the CGBD non-accrual figure will be a bit below the 3% sector average though still above a 1% median level. This continued drop in non-accruals at cost (blue bars) alongside net realized gains is a great result.
Systematic Income BDC Tool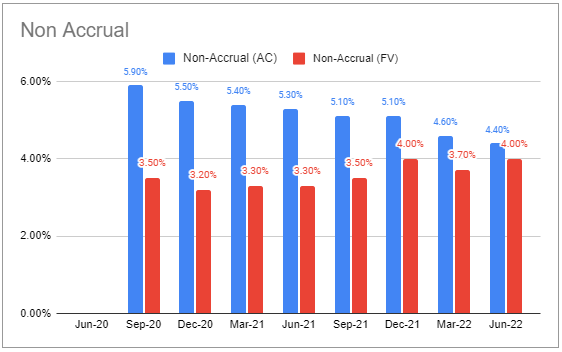
Weighted-average internal portfolio quality rating improved slightly though the bottom 3 ratings remained flat.
Systematic Income BDC Tool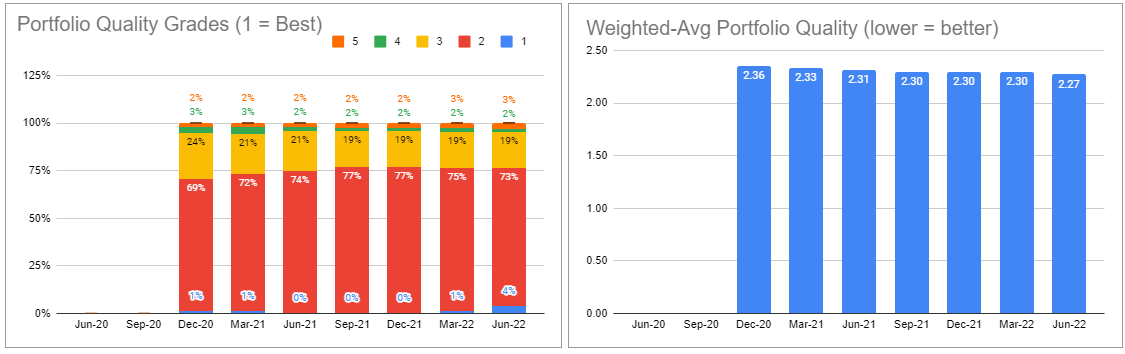
PIK has continued to increase and is worth watching.
Systematic Income BDC Tool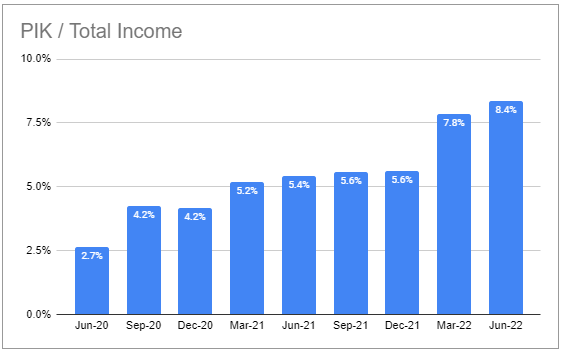
The company has generated no net realized losses for the last 6 quarters which is always good to see.
Systematic Income BDC Tool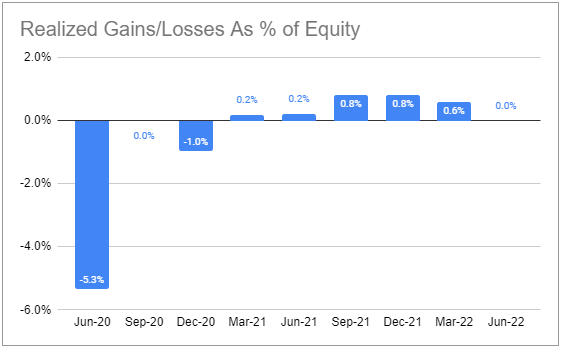
Valuation And Return Profile
CGBD has put up solid total NAV returns in the sector. Its 5Y return lags the sector by about 0.65% per annum, however, its 3Y return beats the sector by 0.67% per annum. This suggests that the company has done better recently – the kind of trend we prefer over the opposite of near-term underperformance and longer-term outperformance.
Systematic Income BDC Tool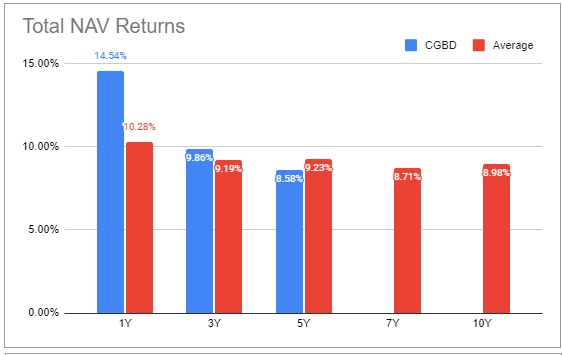
One way we like to visualize the performance trend is via the following chart which plots the quarterly total NAV percentile rank in the sector. Each bar shows where the company’s quarterly total NAV return lies (i.e., 1 means it was the best performer that quarter and 0 means it was the worst performer). The red line shows the trailing-twelve month average. CGBD has clearly moved from being an underperformer to being a consistent outperformer as the red line has continued to rise and remains above 0.5.
Systematic Income BDC Tool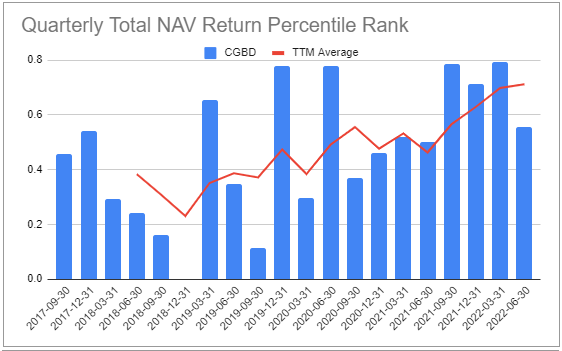
Drilling down into actual quarterly total NAV performance shows that it has outperformed the sector in the last 4 quarters.
Systematic Income BDC Tool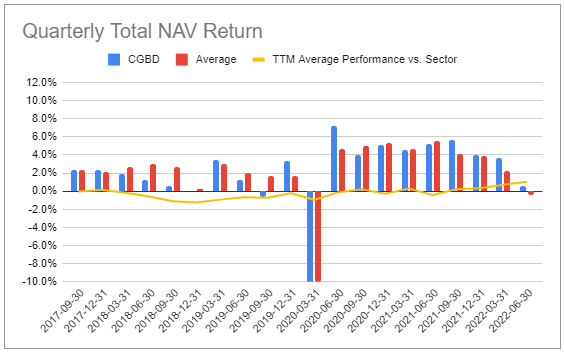
CGBD is trading slightly above its 5-year average valuation level.
Systematic Income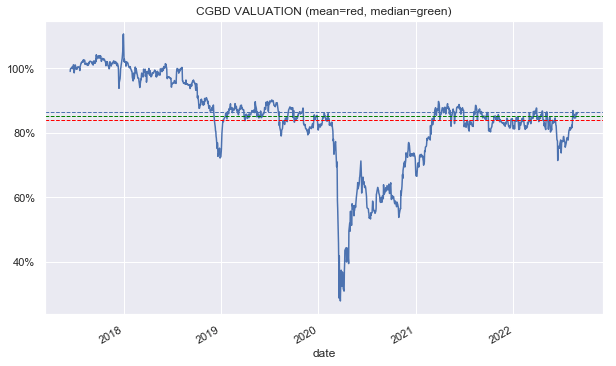
However, relative to the sector its valuation remains depressed – it currently trades at a 14% discount to the sector average valuation (86% vs. 100% sector average).
Systematic Income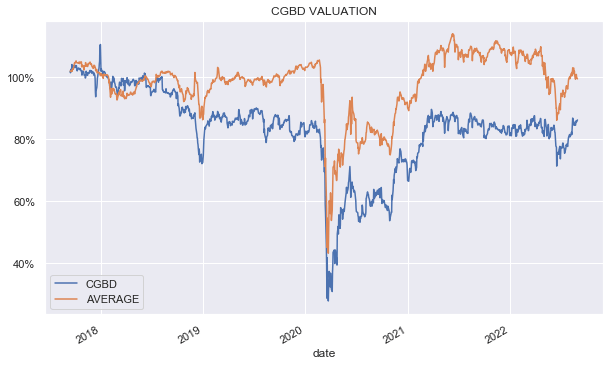
Combining the 3Y total NAV return and the valuation metrics we see that CGBD looks very attractive on this combined basis.
Systematic Income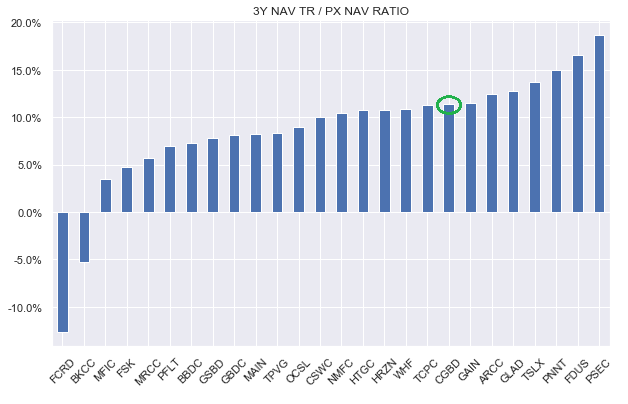
Another way to look at it is that among BDCs that have delivered 5Y total NAV returns in the 8-10% range CGBD trades at a relatively low valuation.
Systematic Income BDC Tool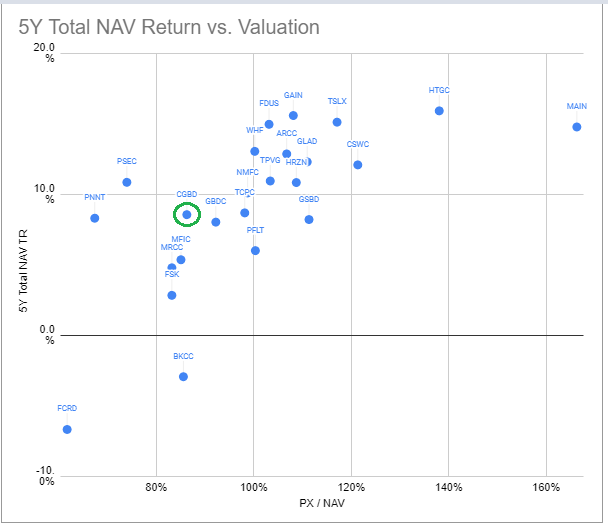
Takeaways
CGBD continues to perform well in the BDC sector while trading at an attractive valuation. It continues to work out of its non-accrual position without incurring net realized losses. It is also well-positioned to grow its net income as a result of rising short-term rates. CGBD continues to have a “Buy” rating in our High Income Portfolio.
Be the first to comment