

RyanJLane/E+ via Getty Images
In this article, I walk you through my analysis of Carlisle Companies (NYSE:NYSE:CSL). We examine the fundamentals of the company and its strength with a focus on the core segment of construction materials. We look at their valuation compared to relevant peers and finally assess whether an investment in Carlisle is in the cards at this price.
Carlisle Companies is a diversified holding company focused primarily on rubber and plastic engineered products with a focus on the construction industry. They are heavily U.S.-focused (approximately half the revenue) with most of the revenue overall coming from their construction materials segment.
Carlisle is, at the heart, about construction. They derive most of their revenue from the general construction market (Figure 1).
Figure 1. Carlisle’s revenue by market (Business Quant)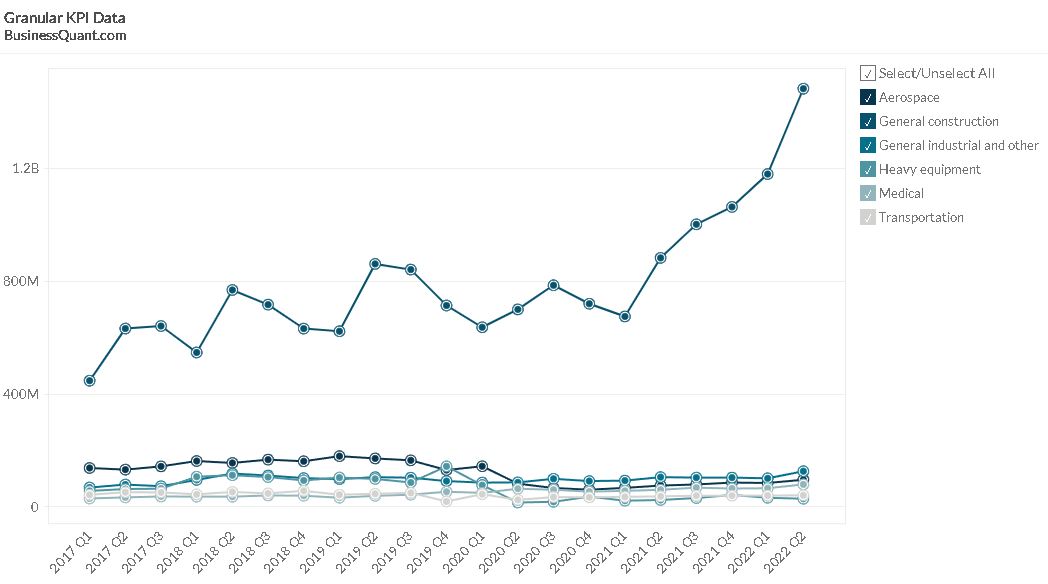
The dominance of the construction industry for Carlisle’s fortunes is hammered home by considering the revenue of their Construction Materials segment (Figure 2). It has showed strong growth since 2016, presenting a gap between this segment and the other components of Carlisle’s business.
Figure 2. Carlisle’s revenue by segment (Business Quant)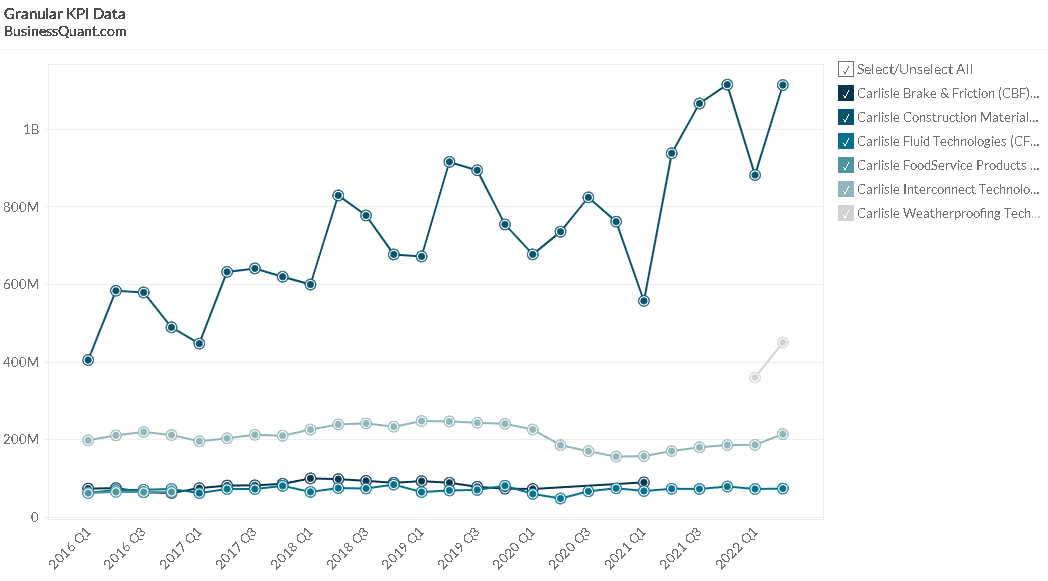
Operational and financial performance
The 2Q 2022 earnings call and presentation provide some insight into how Carlisle has been tracking – and it looks good. The 2Q revenue was up 57% y/y. This was driven both by volume and improvements in pricing, which is important in this inflationary environment. They have backlogs growing in the Interconnect Technologies and Fluid Technologies segments. Importantly, the Construction Materials segment saw continued robust strong growth with a positive outlook for 2022 and they have been able to increase prices in this segment. The increases in raw materials and labor costs have offset the successes.
CAPEX requirements continue but were reasonably balanced from 2013 to 2020, before the large jump for the construction materials segment in 2021 (Figure 3). There are no significant changes in future CAPEX expected by analysts to 2024, with the potential for slightly lower CAPEX in 2023 and 2024 (Source: Finbox.io).
Figure 3. Carlisle’s CAPEX by segment (Business Quant)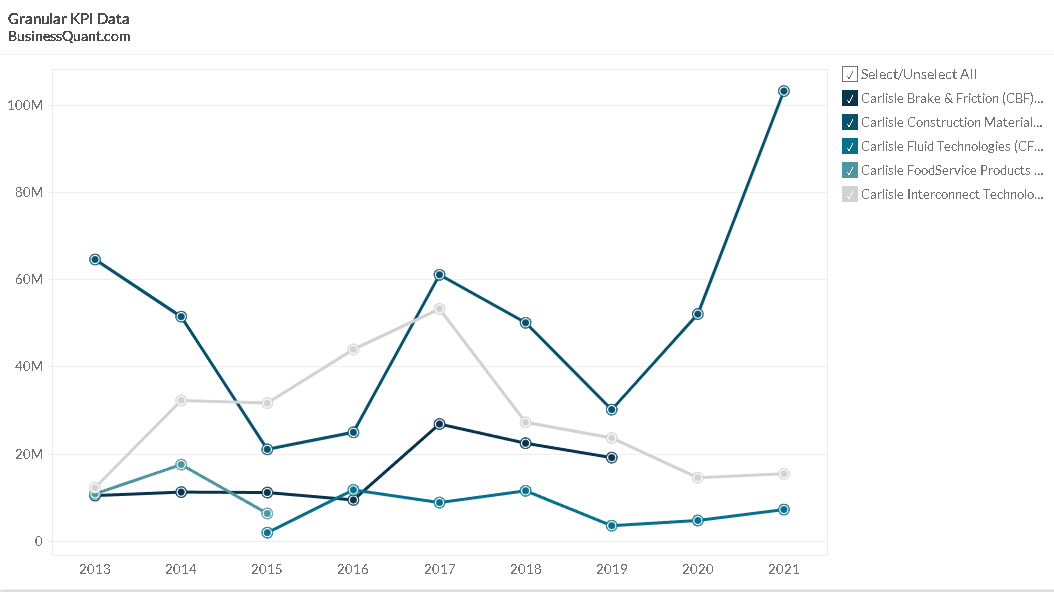
Carlisle continues to innovate and drive new revenue in their core markets. Even in the construction materials segment, this is important, as the CEO indicated on the 2Q call:
I think that’s one of the areas that we are going to look at is how can we get better insulation, more efficient insulation to increase our value, decrease labor content per square foot installed. And really, those are the kind of things we’re looking to do. We’re really looking to help the contractor get the job done more efficiently, more effectively so they could take on more work and also use their labor more effectively.
A big part of these innovations is in allowing the contractors to save time and move to the next job and increase their earning potential. Such product innovation by Carlisle should continue to provide strong margins in the future and be attractive in the target market.
Profitability
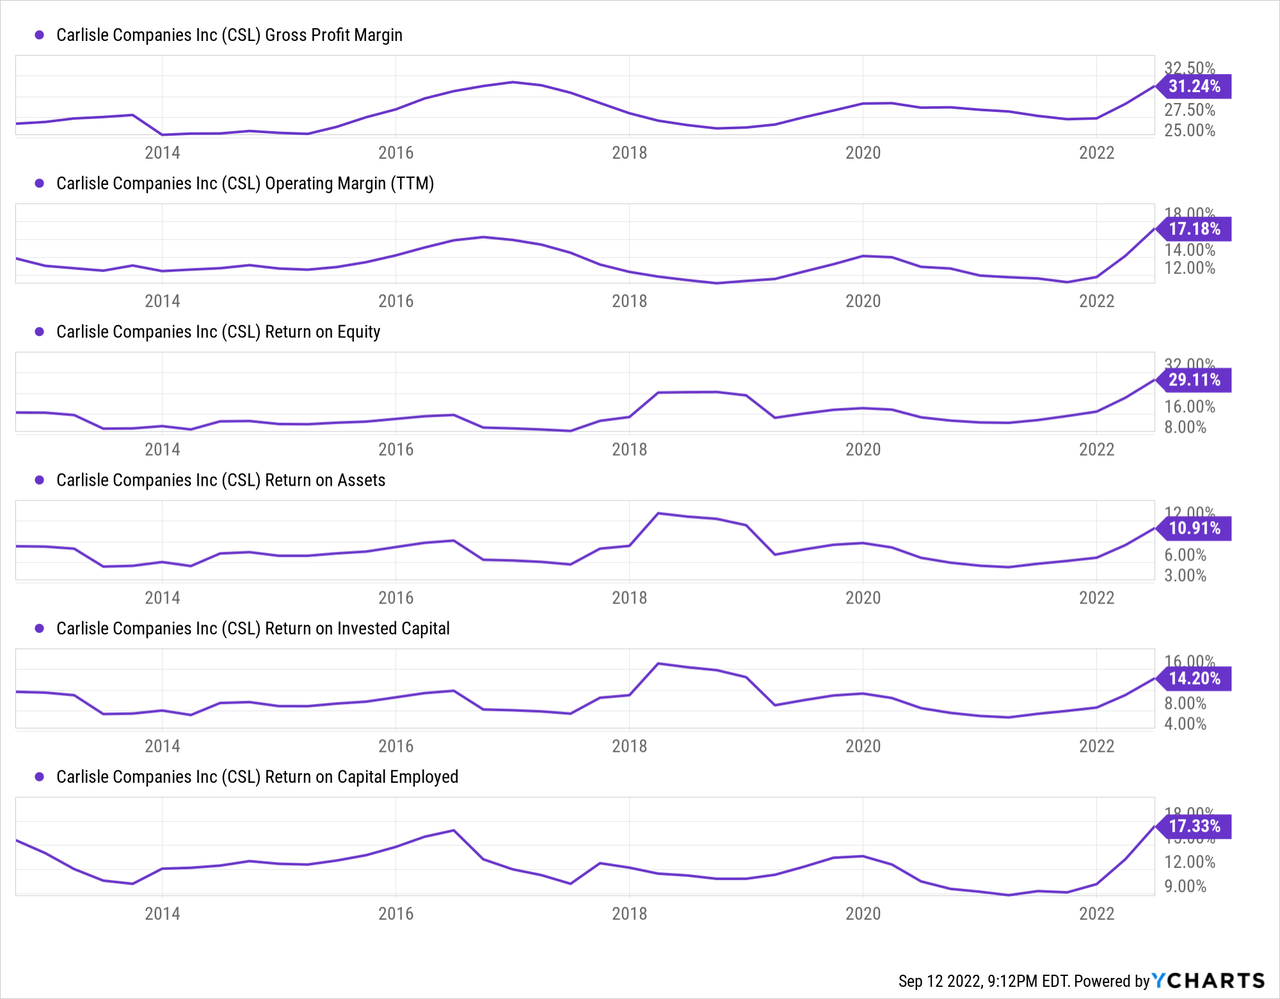
I consider Carlisle to be a strong performer with powerful operational efficiencies and an economic moat. They have good metrics for profitability and I rate them highly against their peers. I make their operating margin vs industry and net margin vs industry averages to be 5.4% and 4.5%, respectively, showing a strong out-performance against the peers’ average margins (Source: Stock Rover). Carlisle’s consistent performance in these key metrics backs this up, as shown in Figure 4.
Figure 4. CSL’s profitability metrics (Source: YCharts)
The margins in each segment differ considerably (Figure 5). As we can see, the adjusted EBITDA margin by segment (%) is relatively low for their interconnect technologies segment, moderate for the fluid technologies segment, but has remained above 20% for the main construction materials segment. This shows the core strength of Carlisle – strong margins in their leading segment.
Figure 5. Carlisle’s EBITDA margin by segment (Business Quant)
Peer comparison
Given that Carlisle has a strong general construction market and construction materials focus, I’ve compiled a list of peers with related product lines and business. Some are more focused than Carlisle, others have complementary lines and more diversification.
- Beacon Roofing Supply (BECN)
- Builders FirstSource (BLDR)
- GMS (GMS)
- JELD-WEN Holding (JELD)
- Lennox International (LII)
- Louisiana-Pacific Corporation (LPX)
- Masco Corporation (MAS)
- Owens Corning (OC)
- Trex Company (TREX)
- Advanced Drainage Systems (WMS)
When making a comparison with three valuation measures (EV/EBITDA, Price/Sales, and Price/Earnings) against its peers, Carlisle appears to be near the upper end of the pack (Table 1). I’ve put the two highest valuations in each column in bold, for the P/E comparison I have also put Carlisle in bold as it is almost the second highest valuation. In all cases, we can see that Carlisle is above the average in this peer group for these valuations, bordering on the upper end of the valuation range. As I noted earlier, the quality and management of the company suggest it is worth paying a premium for and we seem to see that there.
Table 1. Carlisle compared to peers on valuation metrics
| Ticker | EV/EBITDA | Price/Sales (LTM) | Price/Earnings |
| BECN | 8.6 | 0.5 | 9.2 |
| BLDR | 3.2 | 0.5 | 4.2 |
| CSL | 14.6 | 2.7 | 22.5 |
| GMS | 5.4 | 0.4 | 6.7 |
| JELD | 7.8 | 0.2 | 8.1 |
| LII | 16.6 | 2.2 | 20.4 |
| LPX | 2.1 | 1 | 3.6 |
| MAS | 11.1 | 1.5 | 14.8 |
| OC | 5.1 | 1 | 8 |
| TREX | 13 | 4.3 | 22.6 |
| WMS | 18 | 3.5 | 31.3 |
| Summary | 9.6 | 0.7 | 8.7 |
Source: Author, with data from Stock Rover
Risks and threats
There are some minor issues I noted when looking at Carlisle and, given the overwhelming importance of the construction materials segment to Carlisle, this also presents one of the most significant risks moving forward.
Two minor points:
- There is a relatively high level of goodwill on the balance sheet at 29%. This is higher than I like to see and I am not a fan because of the potential for future impairments.
- Sales growth can be patchy, with the obvious declines in 2020 from the pandemic effects.
The primary economic risk to Carlisle, in my mind, remains the construction sector and how the wider economic trajectory might influence Carlisle’s sales in the sector. While it is recognized that there is a backlog in residential housing, this would only support Carlisle for a short time. Over a multi-year period, the demographics may support the wider construction materials segment, where 29% of the population is from 25 to 55, who are more likely to have the affluence and need to build a house for their family.
In between these positives, the Fed is a risk to Carlisle and if there is a downturn, the impact on the construction market could affect the construction materials segment. Offsetting this, slightly, would be the strong product innovation and systems focus Carlisle has, which could buffer against some of the economic downturn.
Valuation and investment opportunity
At this point, I hope I have painted a picture of a firm that I would like to have a stake in. Carlisle has capable management, durable advantages, and careful management of capital allocation. Carlisle is a reliable dividend payer, with a Seeking Alpha Dividend Grade of A+ for safety and consistency. However, the forward dividend yield of 0.97% is low even with the 5-year DGR of 10.79%.
The question now is whether I feel Carlisle is investable at the current price. To answer this question, I will turn first to a revenue-exit DCF model and then look at valuation and opportunity based on P/E multiples using FAST Graphs.
Using a 5-year revenue-exit DCF model, I’ve used revenue forecasts and cost of capital rates of 8.3% to 9.3% with 8.8% in the final assessment, and revenue exit multiples of 2.9x to 3.2x with 3.1x as the final value. This gives me a fair value of $341.51, implying an upside of 10.6%.
Next, I turn to FAST Graphs and the calculation abilities it provides. If we assume that the analysts’ estimates for earnings are correct and prices return to a normalized P/E ratio based on the last five years, this would present a P/E of about 22x. We can then estimate what the prices will be at a future point and, therefore, what our rates of return might be.
The analysis is predicated on reasonable analysts’ expectations. FAST Graphs’ Analyst Scorecard suggests that for a two-year forward period, at the 20% margin for error, 69% of the time analysts hit the earnings accurately, beat it 8% of the time, and missed 23% of the time. This is a reasonable basis for the following calculation.
If we look at the analysts’ consensus estimate of earnings for 2024 and use a P/E ratio of 22.01x (achieved by CSL over the last five years), then we might expect prices to reach $512 at this point. This would imply a total rate of return of 65% or an annualized rate of return of about 25%. The calculation is, however, reasonably optimistic and the strong increases in analysts’ expectations of earnings lifted it. If we look at the lower panel in Figure 6, we can see a significant upward revision of earnings estimates over the last six months. Further, if prices do not return to the 22x P/E level, this forecasted return is not very reliable. While I think Carlisle is a great company and deserves a premium over 15x P/E, I think a more reasonable premium would be for it to trade at the 18x level.
Figure 6. Carlisle’s investment potential based on analyst estimates of earnings to 2024 and a normalized P/E of 22x (FAST Graphs)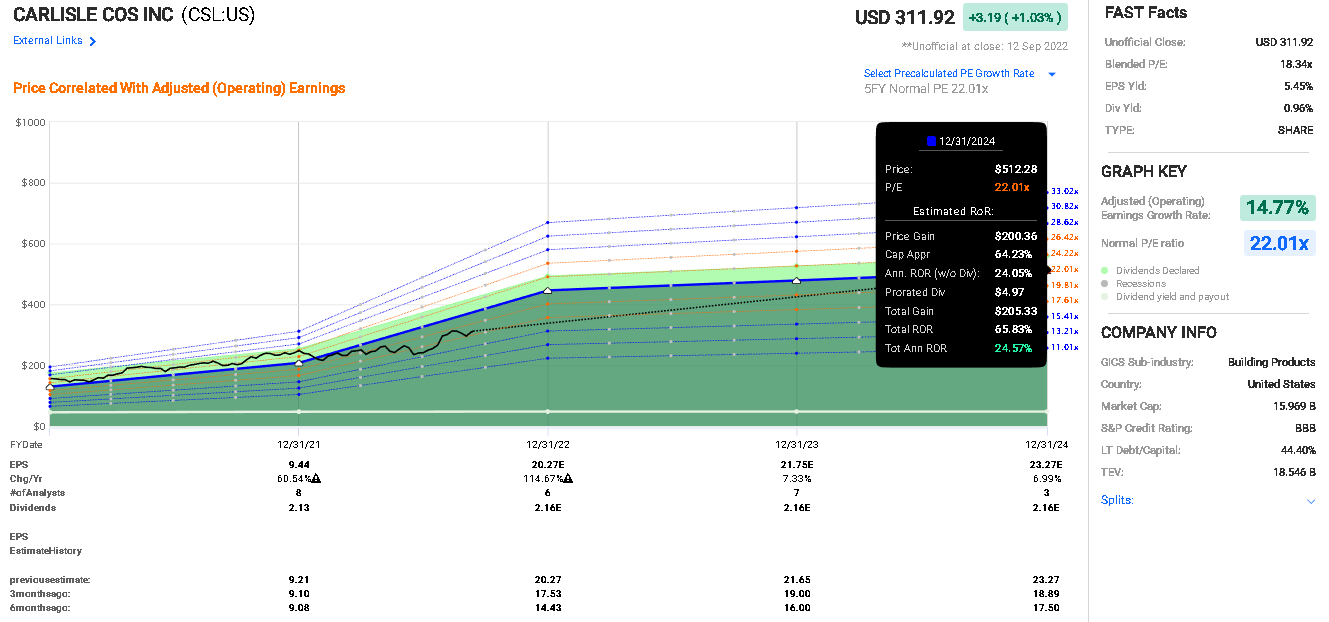
To assess a conservative outcome, I used a lower estimate for the EPS to 2024 (Source: Finbox.io) and plugged this into the FAST Graphs calculator. I’ve used a 15x P/E multiple as a very conservative figure that is below the normalized (exhibited) P/E over the last five years of 22x and also lower than what I believe Carlisle deserves. This is a conservative calculation on two counts – I’ve opted for low earnings estimates and also the assumption that prices do not maintain a strong P/E. The FAST Graphs calculator suggests that this would give a total rate of return of 8.3% and an annualized rate of return of 3.5%. This analysis does not imply any downside, but it suggests that there is a reasonable upside potential here.
It is also worth noting that analysts have an expectation of long-term growth over the next five years to be 17% per annum (Source: FAST Graphs) or 15%. This suggests strong growth.
Thesis
Carlisle is a strong company with bright prospects. They have strong margins and a powerful construction materials segment. Analysts are expecting strong earnings growth over the next several years and my DCF analysis suggests a slight upside.
Overall, my assessment is that the current price for Carlisle is higher than what I am comfortable paying at the moment. The present price gives no substantial margin of safety here and the risks of price movement to the downside or prices going not very far over the next several years are reasonable.
As I believe I can find better opportunities elsewhere, while I love the company, I consider Carlisle to be a Hold at this valuation.
Given the strength of the company, however, I am adding this to my watch list and will return to cover Carlisle again when we have the chance to see better valuations.
Thank you for taking the time to read this analysis. Let me know if you have questions or if there are any other companies you think I should look at.
Be the first to comment