

Darren415
This article was first released to Systematic Income subscribers and free trials on Oct. 18.
In this article we highlight the Business Development Company Capital Southwest (NASDAQ:CSWC). CSWC has spent most of 2021 trading at a ridiculously high valuation which has now fully deflated. Though it remains at an above-sector average valuation (103% vs. 87%) it is much closer to fair-value given its above-average performance track record.
The company has a focus on first-lien loans – at around 10% above the sector average with sector overweights in Media, Marketing & Entertainment as well as Business Services as the following chart shows. Its allocations target primarily the lower middle-market segment. CSWC has recently hiked its dividend – a regular feature – and trades at a 12.2% regular dividend yield (15.7% total dividend yield).
CSWC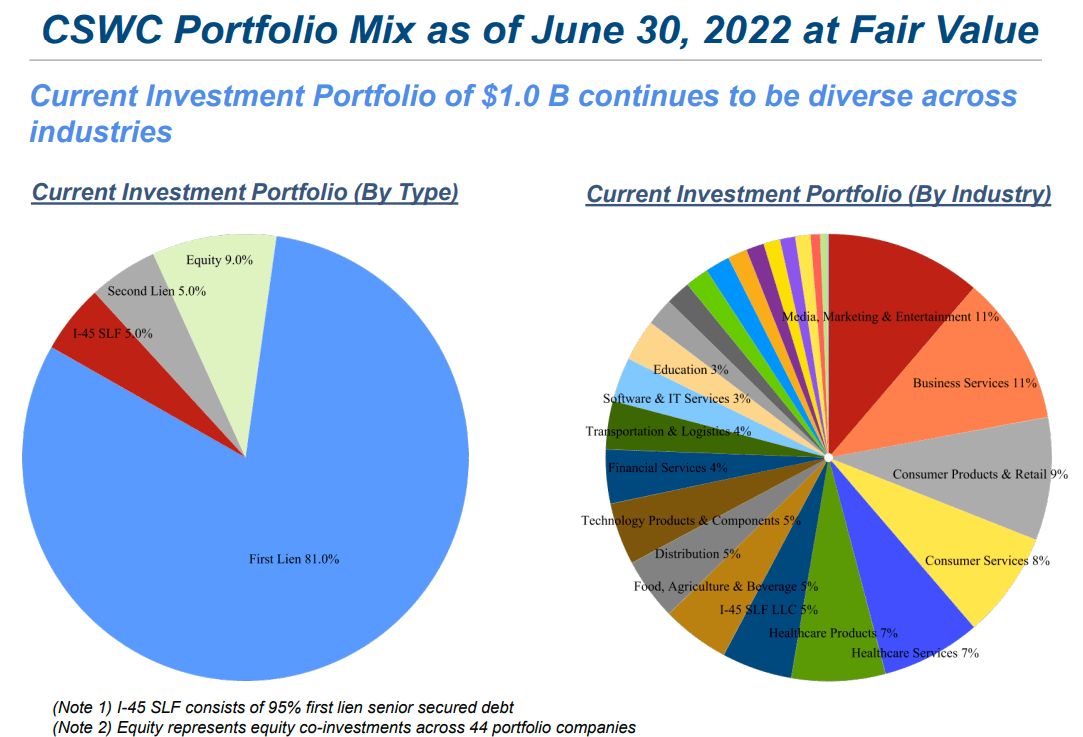
No Longer Priced Beyond Perfection
We have avoided CSWC over the past year for primarily valuation reasons. The chart below shows how the stock’s valuation has traded over the past five years (blue line) against the BDC sector average (orange line). The chart shows that first, CSWC has tended to trade at a higher valuation than the sector average over the last four years or so. And second, it blew out to a ridiculous premium in 2021 that was totally unjustified either by the company’s historical valuation pattern or by its ability to generate value for investors.
Systematic Income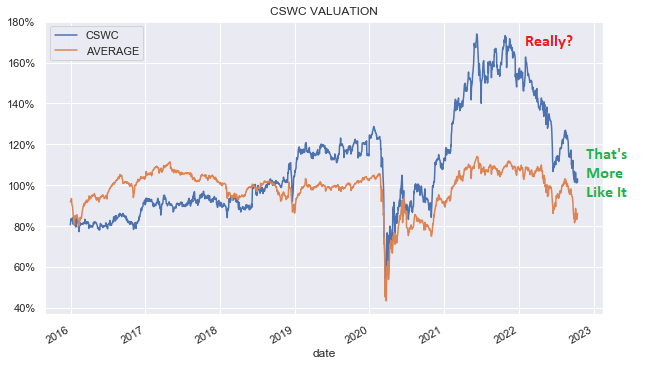
The chart below makes its 2021 valuation blow-up more clear – at its peak the company was trading at a higher than 60% premium to the average BDC. In absolute terms its valuation nearly hit 180% or an 80% premium above its book value.
Systematic Income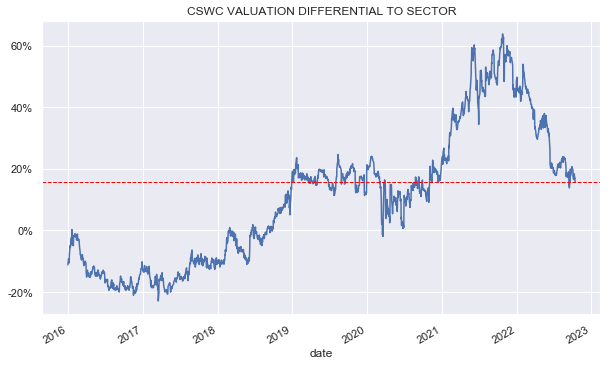
There are two main reasons why such excessive valuation levels are problematic. First, they tend to be totally divorced from performance. Let’s take a closer look at this. Investors who know enough about the BDC space understand that they should look to historic total NAV returns to gauge the value that a given BDC has delivered historically. As they say, past performance is not indicative of future returns, but it’s as good a place to start as any.
By this metric CSWC looks very good – a 5Y total NAV return of 12.1% versus a 9.1% sector average – this is shown in the first two columns in the chart below.
Systematic Income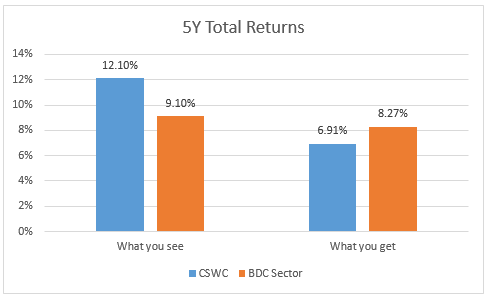
However, many investors choose to stop there and ignore the impact that valuations have on future returns. Let’s see what this means for prospective returns. At a valuation of 175% at its peak versus a level of 110% for the sector average, the return that investors would actually receive, absent changes in the valuation, would be just 6.91% versus 8.27% for the average BDC, if the total NAV performance over the last 5 years is repeated. In other words, at such a high valuation relative to the sector, investors are implicitly saying that they are happy to leave 1.36% on the table.
Or viewed in a different way, by buying CSWC at a 65% premium to the sector average (i.e. 175% vs. 110% valuation average) investors are saying, well I know CSWC has outperformed the sector by about 3% over the last 5 years in total NAV terms but I think it will outperform the sector by 5.4% over the following 5 years. The 5.4% outperformance is what is required to deliver the same return as the sector average at the 65% valuation premium.
Investors say something is priced for perfection when everything has to go right for the allocation to work out. However, in the case of CSWC at its 65% peak valuation, more things have to go right than have historically for the stock. That is why we say the CSWC was priced beyond perfection.
If we glance back at the valuation differential chart above, the obvious question is why not wait till the company reverts back to its 2017 pattern when it traded at a valuation 20% below the sector average? In our view, this is very unlikely to happen for the simple reason that CSWC has delivered consistent outperformance relative to the sector which, unlike in 2016-2018, is something that investors are now fully aware of. Unless its performance changes we expect the stock to continue to trade at a higher than average valuation.
The second reason why we stayed on the sidelines is the fact that higher valuation BDCs tend to underperform in weak market periods. In other words, BDC valuation tends to be procyclical – high valuation BDCs outperform in a strong market and underperform in a weak market.
2022 is far from unique and investors in other areas of the income market, such as CEFs, are familiar with this pattern. We can show how this played out in the BDC sector this year in the chart below. BDCs that finished 2021 at a high valuation (x-axis) delivered worse returns – the pattern goes from top left (lower-valuation BDCs outperformed) to bottom right (higher valuation BDCs underperformed). This underperformance was entirely in the valuation collapse rather than a worse total NAV return. The chart shows that CSWC has been one of the worst performers this year – consistent with its high level of starting valuation.
Systematic Income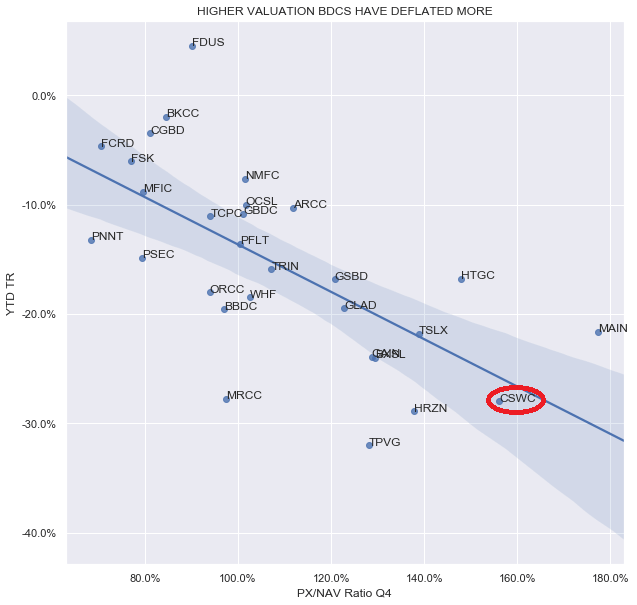
Finally, a third concern we had was the fact that CSWC underperformed in previous weak macro environments. For instance as the chart below shows CSWC underperformed coming out of the Energy crash and going into and out of the COVID shock.
Systematic Income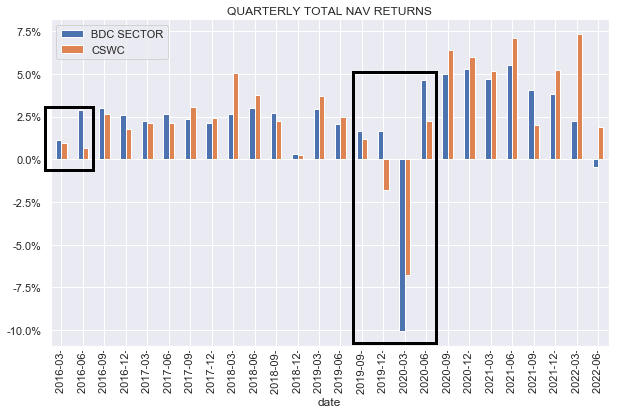
The key market risk in front of investors at the start of the year was the Fed tightening financial conditions by raising the policy rate. This increased the chance of a traditional Fed-induced recession and possible underperformance by CSWC. So far, including Q3 estimates, CSWC has performed very well so the previous two periods may very well have been flukes or a coincidence. It is also possible that the company took this on board and modified its underwriting process – we just don’t know. What we do know is that for the third quarter running into a weakening market environment CSWC has outperformed the sector which makes its previous weakness less relevant in our view.
Drivers Of Performance
A key question for investors is what is it about CSWC that allows it to drive outperformance in the BDC sector. A lot of BDC analysis comes down to management in the sense that strong BDCs are strong because they have “quality management” and poor BDCs are poor because they have “poor management”. This is one kind of “analysis” that should get the investors’ bullshit detector up because it typically provides no actual information content but is just reflective of the performance of the given BDC.
Clearly, management quality differs but if management quality were a determinant factor in performance then all BDCs would consistently outperform or underperform and that simply doesn’t happen. Most BDCs don’t consistently do either. Some outperform in one period and underperform in another.
What this suggests is that investors should look to “harder” structural factors that provide a tailwind or headwind to a given BDC. For CSWC we can identify several.
First, CSWC is internally-managed. Internally-managed BDCs tend to feature a lower level of operating expenses. This is true of CSWC as the following table shows – specifically in the metric Opex excluding debt interest as a function of total assets, is a full 30% below the average BDC. This goes straight to the bottom line of the company.
Systematic Income BDC Tool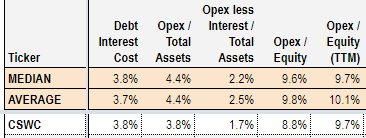
Second, the company has consistently sold shares at a premium to NAV which is accretive to the NAV. For instance, in calendar Q2 (called Q1 in CSWC results) the company sold $47m worth of new shares via its ATM program at a 23% premium to book. As the following chart shows this resulted in a 6.8% annualized gain to the company – as much as many BDCs generate via their normal business. At the current very small premium, this source of returns will essentially go to zero, however, it could easily come back once BDC valuations revert to their less depressed levels. The corollary here is that if we were to strip out the ATM sales from the company’s return profile, its “organic” underwriting business returns would look much less impressive. This is something that investors need to take on board. If valuations remain depressed we would also expect CSWC returns to move closer to the sector average from their previously high levels.
CSWC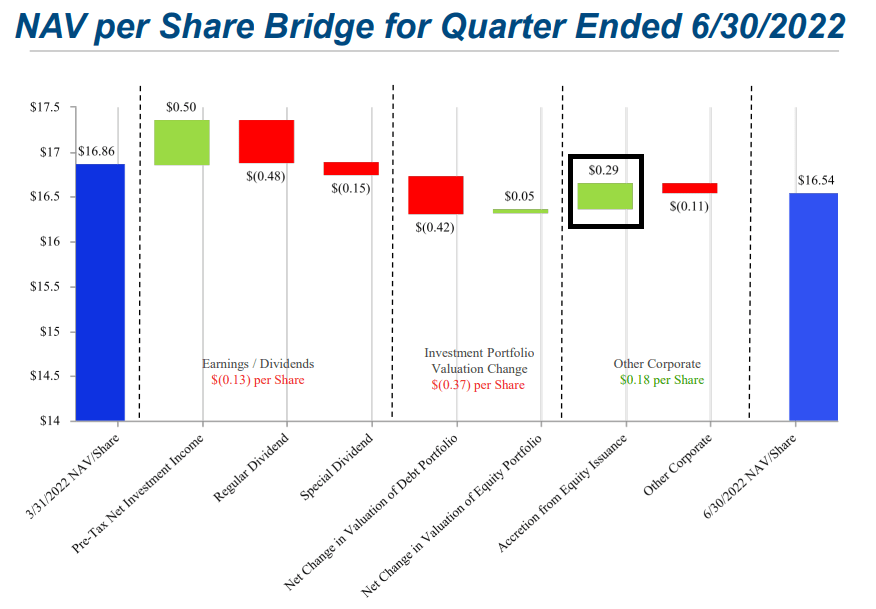
Positive Q3 Outlook
CSWC recently released its Q3 guidance. Its net investment income midpoint estimate is $0.515 which is above the $0.48 figure for the previous two quarters.
Systematic Income BDC Tool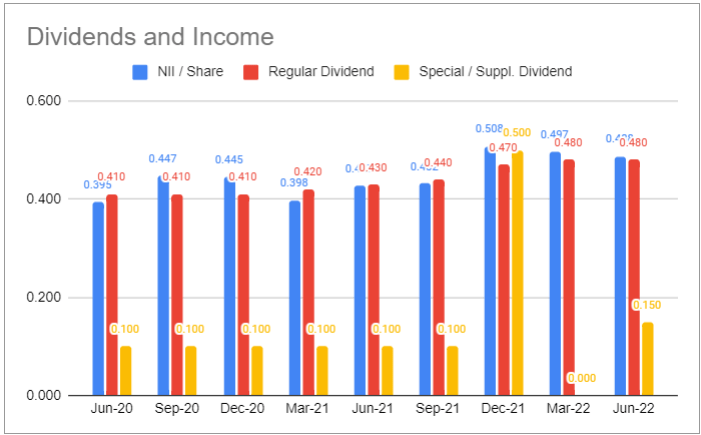
The Q3 NAV estimate is $16.53 or just marginally below its $16.54 Q2 level. A rise in net income and flat NAV is as good as it gets in the current environment. It shows that rising short-term rates are getting passed through to portfolio income while the quality of the portfolio is not deteriorating.
The company recently increased its dividend to $0.52 from $0.50 which itself was recently hiked from $0.48. CSWC has been a serial hiker of dividends as the following chart shows.
CSWC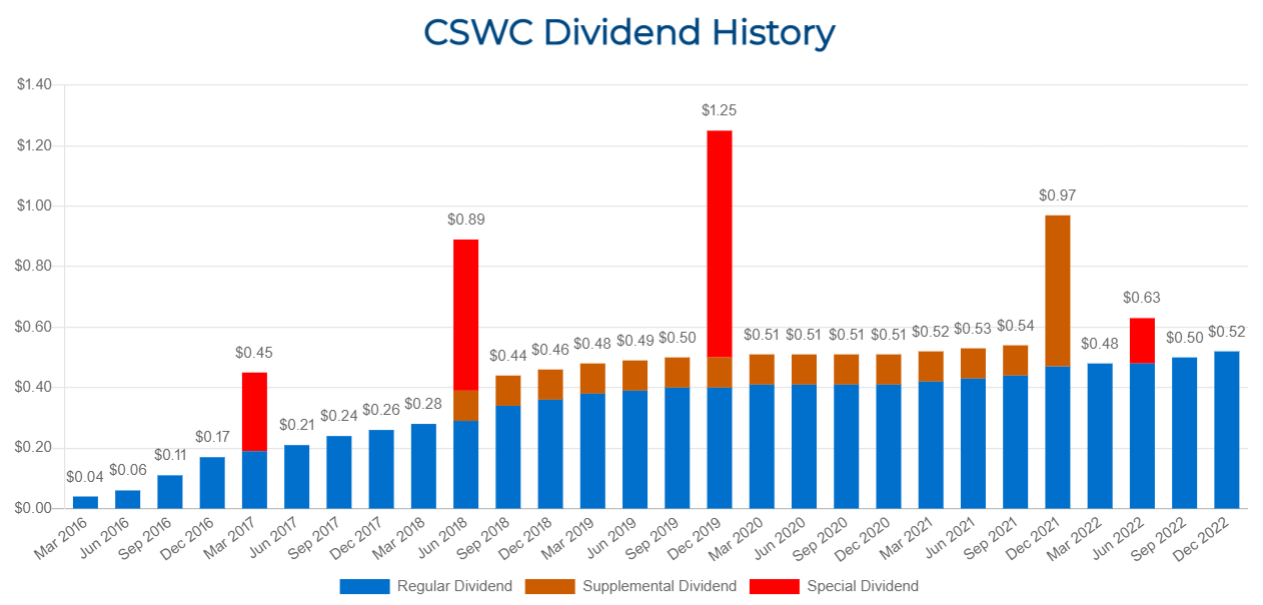
On this metric it compares very favorably against the broader BDC sector whose dividend profile has been fairly flat over the last 5 years.
Systematic Income BDC Tool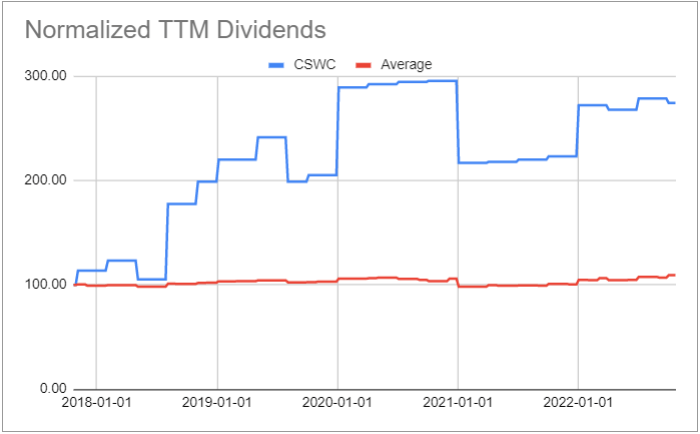
Dividend tailwinds include positive net new investments, realized gains, a drop in non-accruals, and a focus on floating-rate assets.
Takeaways
CSWC has been a consistently strong performer in the BDC sector. However, until recently it has been “too hot to touch” as it has traded at a ridiculously high valuation which was fully divorced from its ability to generate value. Now that its valuation has collapsed, it looks a much more reasonable allocation. Its Q3 guidance has been very good and we expect it to continue to outperform the sector once all results are in. The stock is now back to fair-value valuation which opens up a decent opportunity for investors who have been looking to jump in.
Be the first to comment