

Canadian Dollar Technical Price Outlook: USD/CAD Weekly Trade Levels
- USD/CAD starts the week with a support test.
- The pair held a big spot of support last week even as USD was selling-off. Can bulls hold sellers at bay?
- The analysis contained in article relies on price action and chart formations. To learn more about price action or chart patterns, check out our DailyFX Education section.
Last week was a tough one for the US Dollar as the currency was offered heavily after Jerome Powell’s speech at Jackson Hole. In USD/CAD, however, the move appeared to be somewhat abbreviated as the pair merely pushed down to another big spot of support and held.
But already this week bears took a dip below that level, producing a brief weekly low. Prices are still holding above trendline support, for now; but given the recent lower-high combined with this morning’s test of a lower-low, there may be some building bearish scope in the pair.
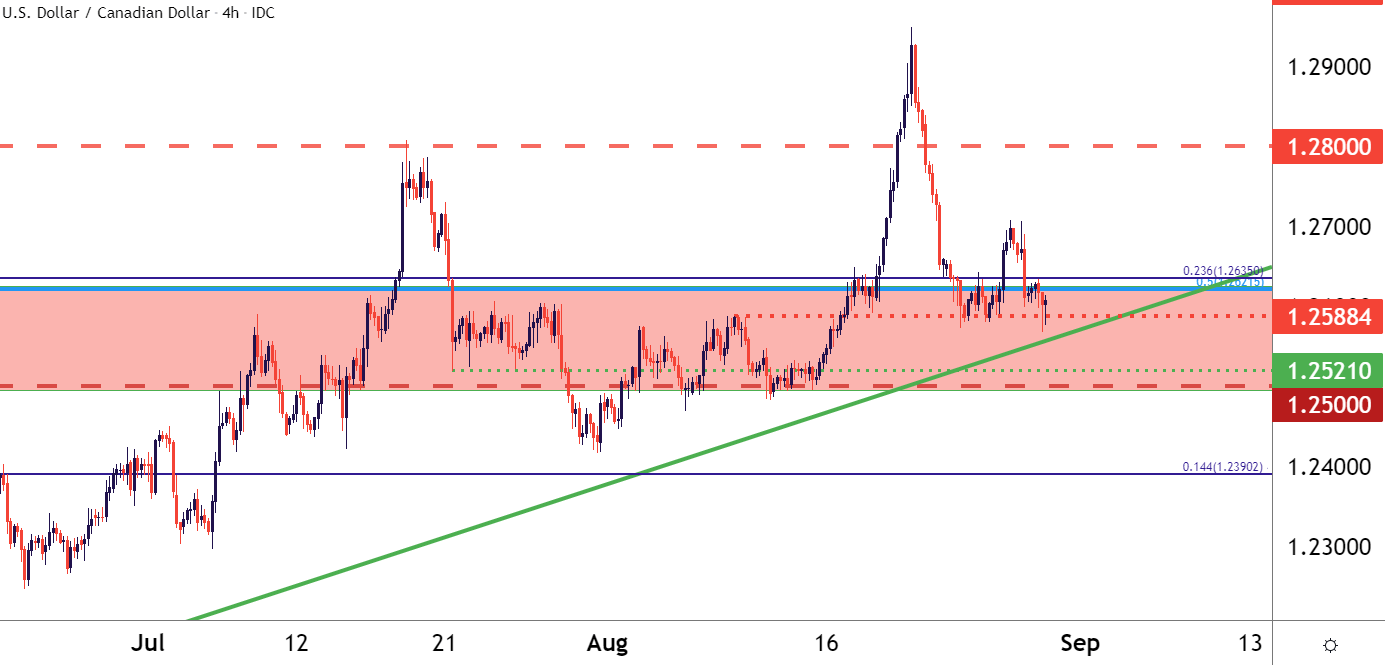
USD/CAD Four Hour Price Chart
Chart prepared by James Stanley; USDCAD on Tradingview
As I had looked at last week, USD/CAD is re-testing a big spot on the chart that’s been in-play for pretty much all of 2021 trade. This zone runs from the psychological level of 1.2500 up to a couple of confluent Fibonacci levels around 1.2620-1.2632. The latter of those levels is the 23.6% retracement of the 2020-2021 sell-off while the former of those levels is the 50% marker of the 2002-2007 major move in the pair.
This area of prices held support around the 2021 open and soon became resistance in March and April. July and August both saw breakouts beyond this level as bulls came rushing back but prices quickly returned to this zone to continue grinding support.
As long as this holds, the door can remain open for longer-term bullish strategies in the pair, looking for a deeper reversal of the prior bearish trend that ran from March of last year into June of this year.
To learn more aboutpsychological levels orFibonacci, check out DailyFX Education
USD/CAD Daily Price Chart
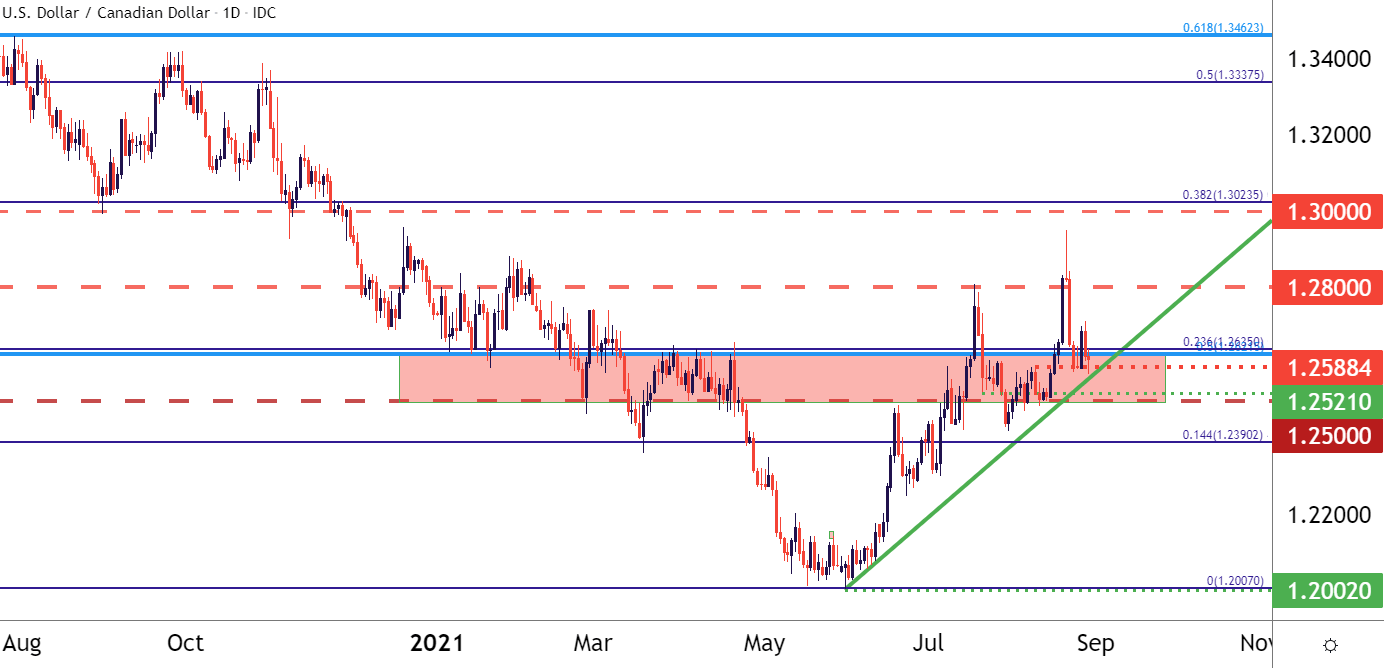
Chart prepared by James Stanley; USDCAD on Tradingview
USD/CAD Bearish Potential
Given the quick return to support combined with the inability of bulls to continue the breakout from mid-August, the question of bearish potential has popped up. The weekly low put in early trade for this week combined with last week’s lower-high can keep the door open for as such.
For this to come to fruition, we’ll likely need a combination of both continued USD weakness along with higher oil prices, which was a big factor to CAD performance of recent. The mid-August breakout in USD/CAD syncs up with the support breach in oil prices; and since oil prices have come back, the Canadian Dollar has continued to show some element of strength.
But given the technical backdrop with price action holding in a really big zone of long-term importance, traders looking for a bearish push on USD/CAD would likely want to wait for greater construction of a bearish trend; and given juxtaposition of the bullish trendline, a short break there with a re-test of 1.2500 can re-open that door for short-term strategies. For longer-term looks, traders are likely going to want to wait for a break of 1.2500 to signify greater long-term bearish potential in the pair.
USD/CAD Eight-Hour Price Chart
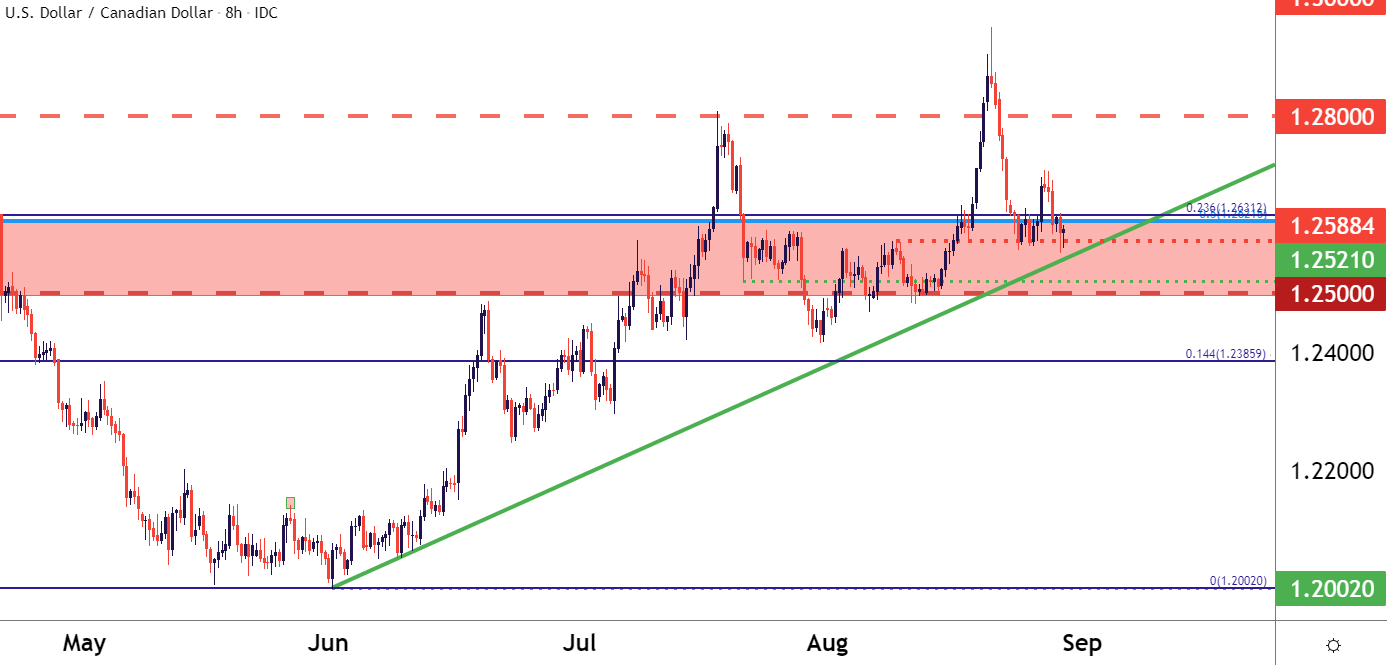
Chart prepared by James Stanley; USDCAD on Tradingview
— Written by James Stanley, SeniorStrategist for DailyFX.com
Contact and follow James on Twitter: @JStanleyFX
Be the first to comment