

Canadian Dollar, USD/CAD, Australian Dollar, China PMI – Asia Pacific Market Open
Recommended by Daniel Dubrovsky
Forex for Beginners
Asia-Pacific Market Briefing – Canadian Dollar Sinks After Local GDP Slows
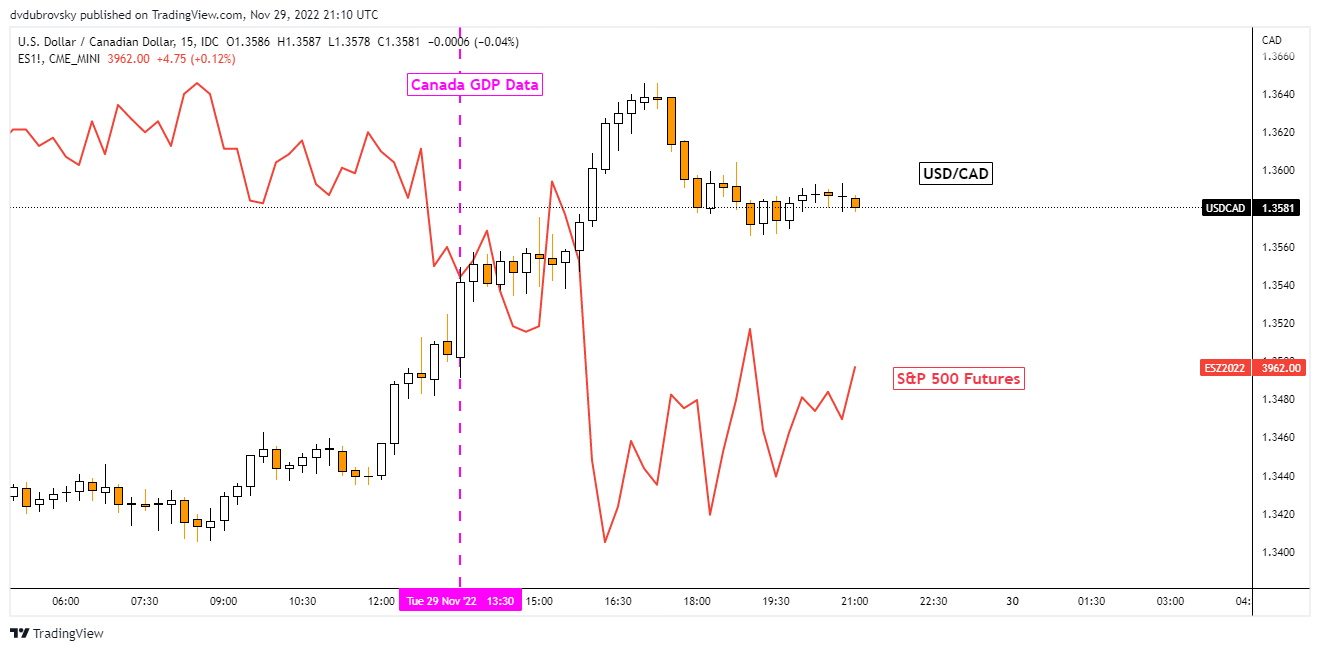
The Canadian Dollar underperformed against its major counterparts on Tuesday, also tracking a cautious deterioration in risk appetite. At one point, the S&P 500 was down about 0.6% before trimming some of its losses. On the chart below, USD/CAD can be seen very closely inversely tracking stock markets. Interestingly, the Loonie was unable to capitalize on a strong performance in crude oil prices.
At 13:30 GMT, the latest Canadian GDP figures crossed the wires. Annualized quarterly growth clocked in at 2.9%, which was far greater than the 1.5% outcome. However, GDP was 0.1% m/m in September, in-line with expectations. Meanwhile, August’s output was revised higher to 0.3% m/m from 0.1%. In effect, Canadian growth slowed, opening the door to a less aggressive Bank of Canada.
In the context of daily moves since the beginning of 2020, USD/CAD’s 0.7% rise on Tuesday was about 1.34 standard deviations from the average. Using a cumulative distribution function, the probability that CAD weakens by 0.7% or more is at least about 10%. Granted, past performance is not necessarily indicative of future output.
Canadian Dollar and S&P 500
Wednesday’s Asia Pacific Trading Session – Australian Dollar Eyeing China PMIs
The cautious mood on Wall Street could be setting up financial markets for a similar performance during Wednesday’s Asia-Pacific trading session. The Australian Dollar will be closely watching November’s Chinese PMI gauges. Non-manufacturing data is seen clocking in at 49, down from 49.2 in October. Values below 50 indicate shrinking economic activity. Considering China has been having a bumpy ride with moving past strict Covid lockdowns, a softer print risks sending AUD/USD lower. China is Australia’s largest trading partner. Softer economic output in the former often implies knock-on impacts for the latter.
Canadian Dollar Technical Analysis
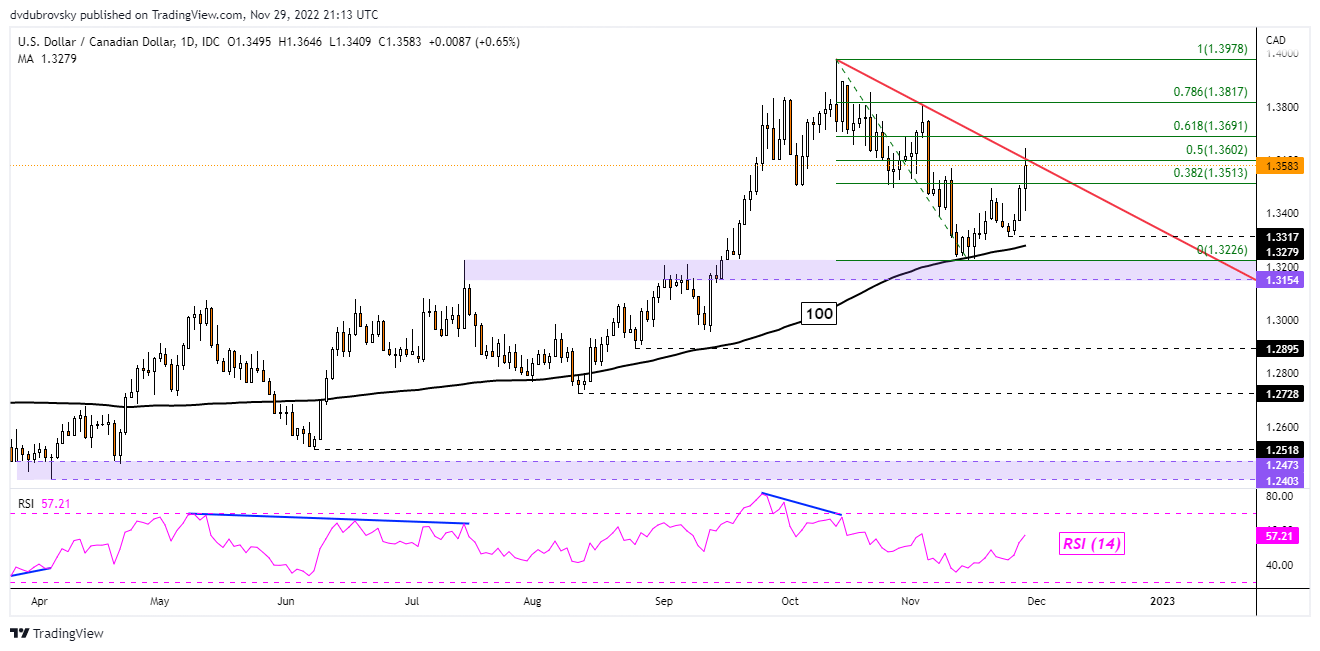
On the daily chart, USD/CAD seems to have reinforced a near-term falling trendline from October. Prices were unable to break above resistance, maintaining the downside focus that has been prevalent for a few months. A turn lower places the focus on the 38.2% Fibonacci retracement level at 1.3513. On the other hand, confirming an upside breakout opens the door to reversing the near-term downtrend.
Trade Smarter – Sign up for the DailyFX Newsletter
Receive timely and compelling market commentary from the DailyFX team
Subscribe to Newsletter
USD/CAD Daily Chart
— Written by Daniel Dubrovsky, Senior Strategist for DailyFX.com
To contact Daniel, follow him on Twitter:@ddubrovskyFX
Be the first to comment