

MCCAIG
After an 8% rally over the past month, the S&P 500 (SP500) is back to where it was in late April, nine months ago. And most investors have fully embraced stocks again after a year-long bear market.
According to AAII’s latest asset allocation survey, individual investors are 64% invested in stocks, above the 35-year average allocation of 61.6%. The NAIIM Exposure Index shows that professional portfolio managers are now 75% allocated to equities, up from only 12.6% in late September. That is a historically high level, and similar to their equity allocations during the bear market rally peaks in April 2008 and April 2022.
This is happening despite 3-Month Treasury rates having skyrocketed from 0.91% to 4.73% since April. The yield curve spread (i.e., the difference between long-term and short-term interest rates) is now at the most negative or “inverted” levels in four decades, and the money supply is now shrinking after an unprecedented 40% increase post-Covid.
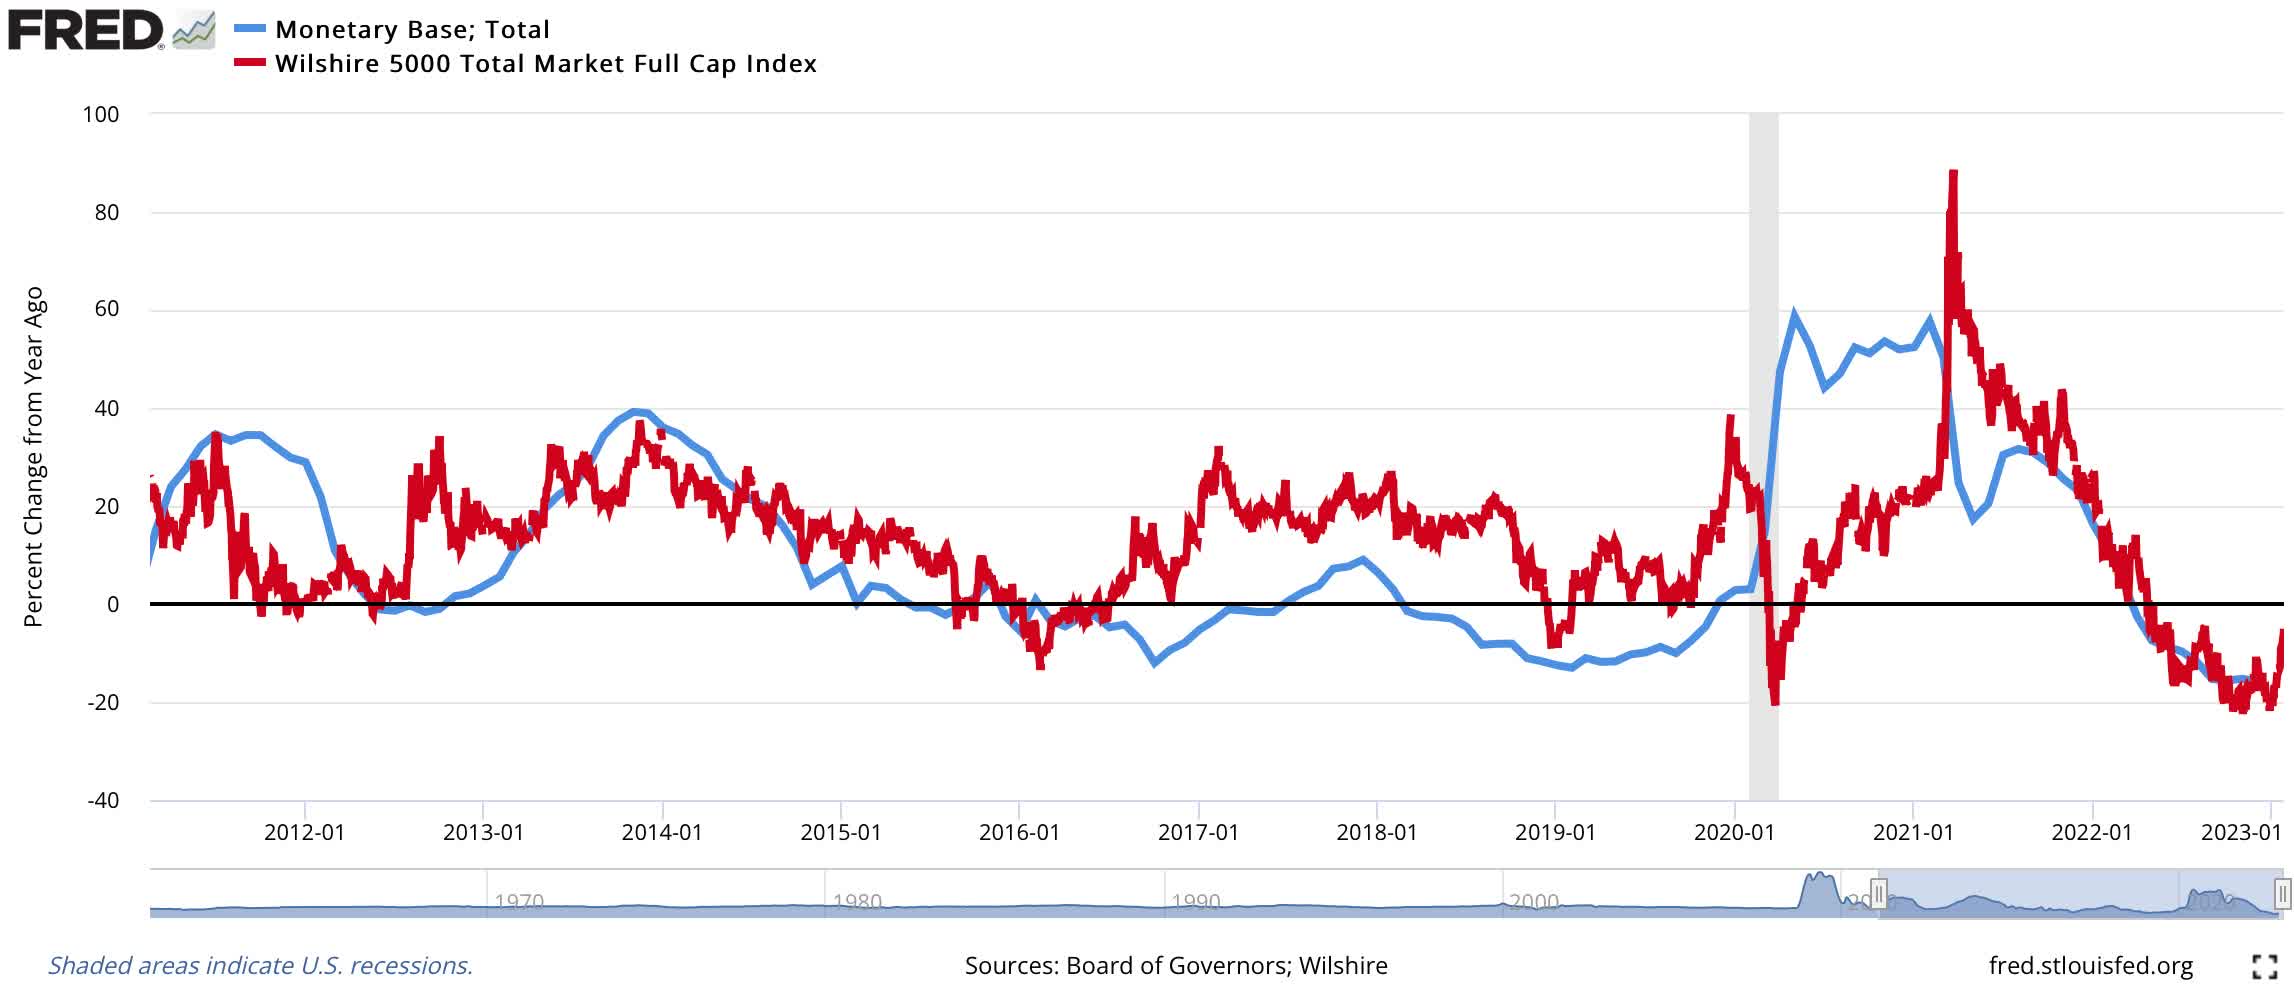
Indeed, the Fed is still raising interest rates and shrinking its monetary base (currency plus bank reserves at the Fed), which is now down 16% from last year. As shown below, stock prices (Wilshire 5000 stock index, red line) tend to track changes in the monetary base (blue line).
FRED
Anything Can Happen, But…
Since stock prices are ultimately driven by investor psychology waxing and waning between greed and fear due to herding behavior, anything can happen with stock prices. The future is always unknowable, including with regard to stock prices, but wise investors try to assess the probabilities of likely returns and invest accordingly.
Recessions Usually Matter And…
Historically informed investors know stocks usually decline in recessions, and the worst stock bear markets in the past century have occurred during recessions. This includes the 86% collapse in the S&P 500 during the early 1930s, the 54% drop in the late 1930s, the 50% fall in the mid-1970s, the 51% drop in the early 2000s, and the 58% fall during the 2008-2009 Great Recession.
Many investors do not believe we will have a recession now — or at worst it will be short and mild — since employment and GDP are still growing. They appear encouraged that last quarter’s real GDP grew +1% year-over-year. But that is below the GDP growth rates in the first half of 2008, after the Great Recession had already started.
Leading Economic Indexes Are Flashing Recession
There are several leading US economic indexes that have a strong record of predicting the boom and bust business cycle. Three of the best sources of leading indicators are the Organization for Economic Co-operation and Development (OECD), the Conference Board, and the Economic Cycle Research Institute (ECRI).
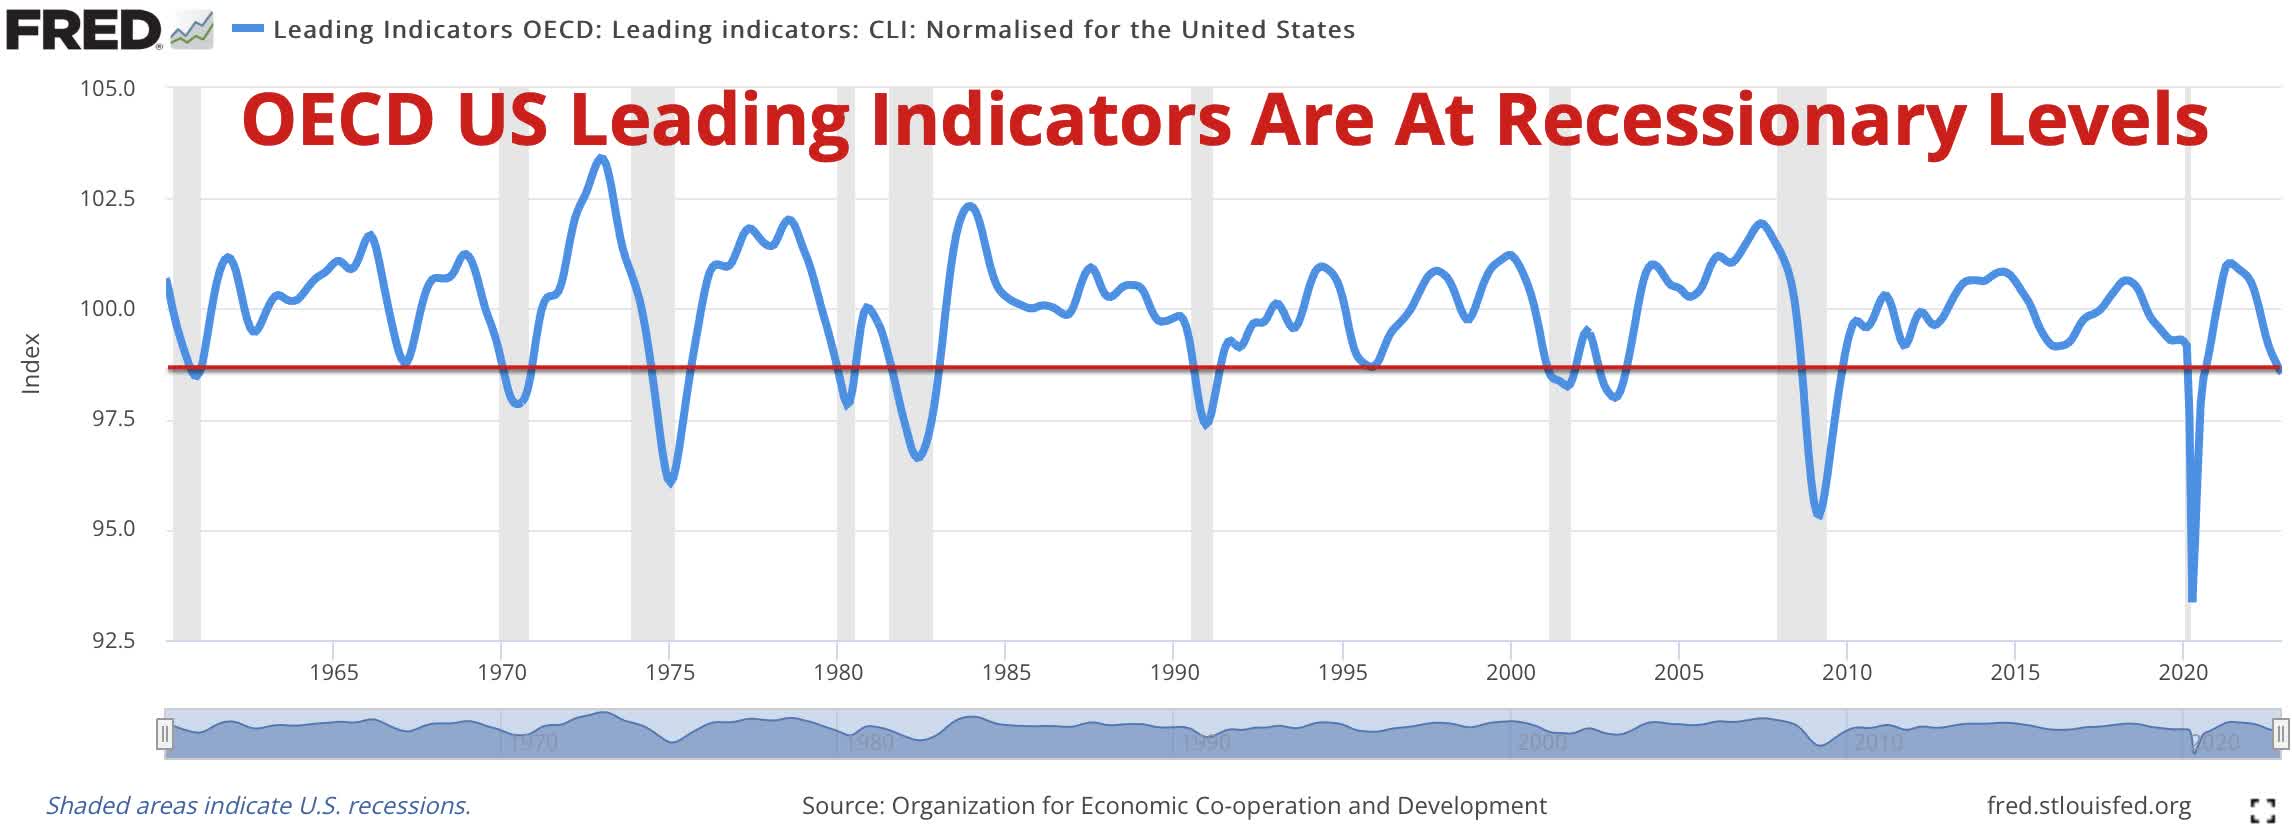
OECD Leading Indicators have a strong track record of consistently identifying turning points of the business cycle by 6 to 9 months. As shown below, the OECD U.S. leading indicators have fallen to levels typically only seen during recessions.
FRED
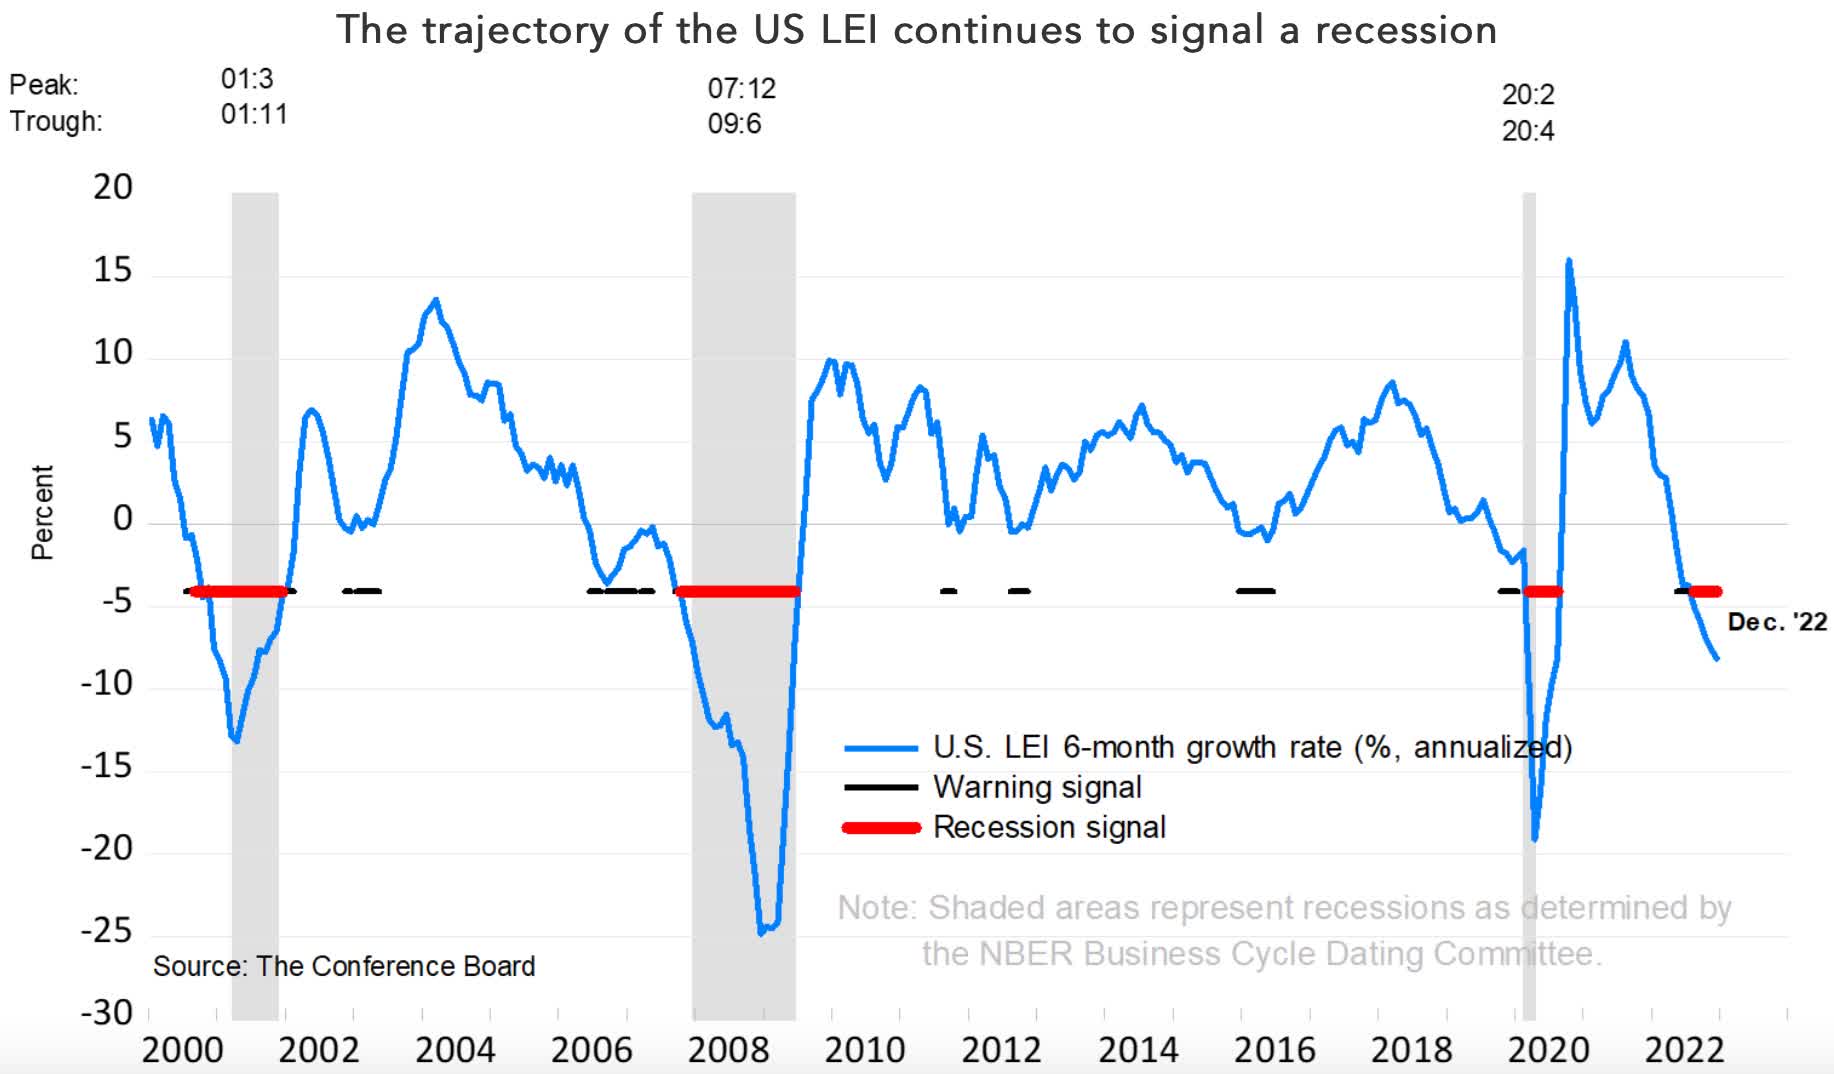
Similarly, the Conference Board’s Leading Economic Index (LEI) leads turning points in the business cycle by around 7 months. As shown below, it is also at levels usually only seen in recessions.
The Conference Board
Ataman Ozyildirim, Senior Director of Economics at The Conference Board, explained the implications of the latest report of their LEI:
“The US LEI fell sharply again in December—continuing to signal recession for the US economy in the near term. There was widespread weakness among leading indicators in December, indicating deteriorating conditions for labor markets, manufacturing, housing construction, and financial markets in the months ahead. Meanwhile, the coincident economic index (CEI) has not weakened in the same fashion as the LEI because labor market related indicators (employment and personal income) remain robust. Nonetheless, industrial production— also a component of the CEI—fell for the third straight month. Overall economic activity is likely to turn negative in the coming quarters before picking up again in the final quarter of 2023.”
The Economic Cycle Research Institute (ECRI) uses a wide variety of leading economic indicators which has enabled them to have one of the best track records in forecasting the business cycle. Last spring, they officially predicted the US would enter into a recession in the coming year and it would likely be severe.
The following chart shows ECRI’s a) U.S. Long Leading Index (LLI, top line), which leads turning points in the economy by 9 to 12 months, b) U.S. Weekly Leading Index (WLI, second line), which leads the economy by about 6 months, c) U.S. Short Leading Index (SLI), which leads by 3 to 6 months and d) U.S. Coincident Index (CI, bottom line), which shows the current state of the U.S. economy. This chart was provided by ECRI at a presentation in mid-November, so it’s a couple of months old.
As the chart shows, in mid-November, all of these indexes were at levels seen at some point in 2008, after the Great Recession had started. This suggests a recession may have already started by mid-November.
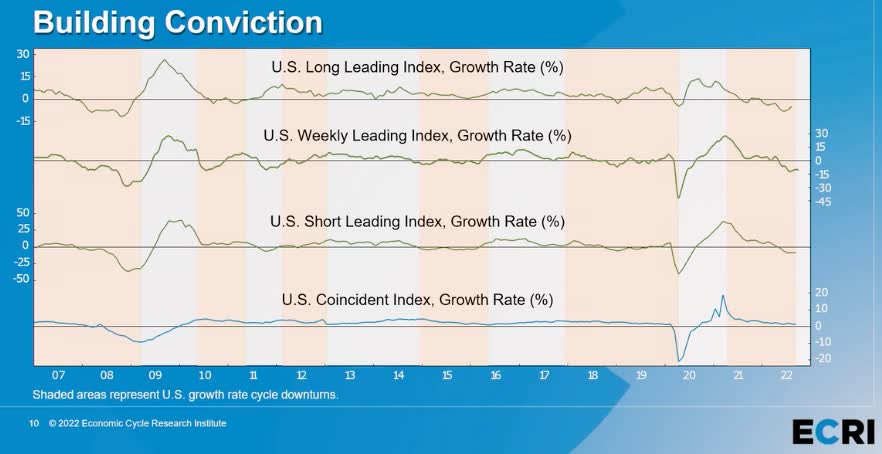
Economic Cycle Research Institute
ECRI has not provided an updated chart on these indexes since then, but they did write an op-ed for CNN on January 13, where they reiterated their official recession call. Here are key excerpts from that op-ed:
“Recession concerns in the US are widespread these days. Yet, some economists argue that the strength of the labor market — as well as household balance sheets — will keep the economy strong enough to avoid a recession.
We disagree. Despite the relatively robust job growth we’ve been seeing, the Economic Cycle Research Institute (ECRI), which we co-founded, has been predicting recession since last spring, and it remains our expectation that the US economy will enter a recession this year.
The goods sector is especially vulnerable, in part because it’s sensitive to higher interest rates. Symptoms of that vulnerability are already visible in falling factory orders. And, already under assault from rising mortgage rates, residential construction spending has been falling since last spring, and housing starts and new building permits have been tumbling.
Meanwhile, the purchasing managers’ index for manufacturing, which measures the month-over-month change in manufacturing activity, fell below 50 in the last two months, implying that a manufacturing contraction is underway. Moreover, its service sector equivalent has also slipped under the 50 mark, suggesting that services activity has started to decline.
Recessions always entail noticeable declines in both GDP and jobs, but such pullbacks are not necessarily obvious at the recession’s outset. While GDP and jobs do move in step with the economy, by the time they are released, they only tell us where the economy had been in the recent past.
Our recession forecast hasn’t wavered. We should all be prepared.”
Implications For Investors
Since anything is possible with financial market prices driven by herding behavior, it is possible that the current rally is the beginning of a new bull market. But with the Fed continuing to tighten monetary policy to bring inflation down from 40-year highs, along with proven leading economic indexes all pointing toward a recession this year, the probabilities do not favor a lasting bull market at this point.
Be the first to comment