

Dow, S&P 500 Price Analysis
- It’s been a brutal week for stocks with massive sell-offs showing this week.
- Friday trade has thus far seen a vigorous bounce in US equity futures, indicating a gap-up to being this morning’s trade.
- Both the Dow and S&P 500 ran into key levels of longer-term support; begging the question as to whether we’re seeing a short-cover rally ahead of a weekend where traders fear stimulus announcements or, whether this is a long-term value scenario from investors and traders.
Dow, S&P 500 Run into Key Support Areas – but Can They Hold?
Ahead of the US open S&P 500 futures are showing a strong gain, clawing back a portion of this week’s losses after what’s been a brutal outlay for global markets.
Yesterday saw the Fed spring to action, and this morning brought hints of similar drives from global governments; making clear that financial markets are taking more seriously the threat of slowdown emanating from the coronavirus.
The overnight rally at this point has been rather large, hitting the limit-up band ahead of the US open after a level of support came into play last night. This is taken from the 61.8% retracement of the 2016-2020 major move; and already prices are pushing up towards the 50% marker of that same study that had previously helped to set support earlier this week. Also of note, a bullish trend-line projection exists around this current low, drawn from the 2009 and 2012 swing lows.
S&P 500 Monthly Price Chart
Dow Jones Bounce from Confluent Support
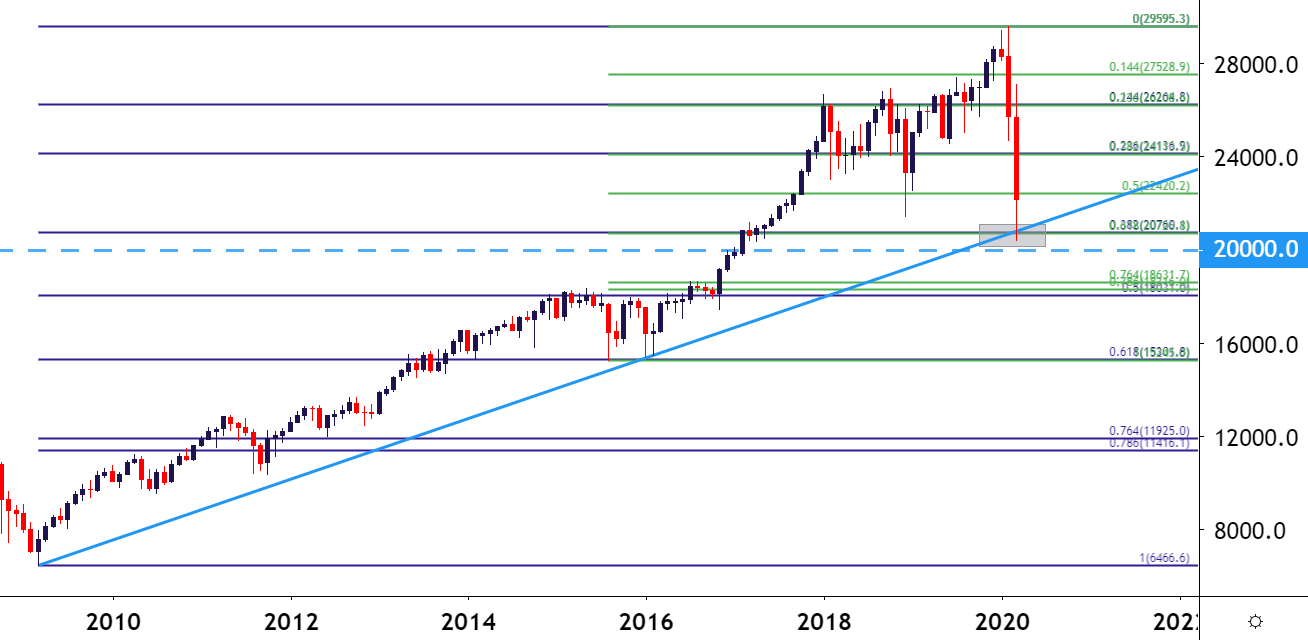
In the Dow, the support zone that came into play last night was confluent as there were two Fibonacci levels of note in close proximity, showing around the 20,700 area. This area is highlighted by the 61.8% retracement of the 2015-2020 major move along with the 38.2% retracement of the post Financial Collapse move. Also in this area is a trendline projection as taken from the 2009 and 2015 swing lows. And, of course, just below that is the 20k psychological level which just helps to put into scope the severity of the recent move; as it was just weeks ago that market participants were bantering about when the index might hit the 30k level.
Starts in:
Live now:
Mar 17
( 17:03 GMT )

James Stanley’s Tuesday Webinar
Trading Price Action
That 30k print didn’t happen; at least not yet, and it may have to wait for a little while as the 20k level is closer to being in-play than 30k. But, for now, buyers are pushing the bid as US markets near the Friday open after what’s been one of the most brutal weeks in global equities in the history of financial markets.
Dow Jones Monthly Price Chart
The Big Question for the Dow and S&P: Can Buyers Hold the Bid?
The big question is whether or not the worst is over and given the extreme nature of this week’s events, that’s going to be a difficult factor to project. Extreme market moves often bring extreme swings in both directions, and that’s what we’re witnessing this morning. And to be sure, there are cases on both sides: Perhaps the rallies this morning are produced by short-cover ahead of the weekend and after Central Banks started to hint towards oncoming stimulus? Given the fact that markets will be closed over the weekend and that global governments have started to spring into action, it would make sense for traders to look to manage off exposure for fear of gap-risk when trading opens next week.
The big test today will be just how aggressively buyers may be able to continue pushing; and this can highlight whether long-term investors are coming in to support the bid or whether this is a quick move of short-cover ahead of the weekend.

Recommended by James Stanley
Download our Q1 Equities Forecast
Sitting just ahead on the S&P 500 is the 2600 level; and this is very near the 50% marker of the 2016-2020 major move. This area had offered a brief pause during the aggressive sell-off on Wednesday but was soon taken out after equity markets closed in the US. Above that are prior price action swings at 2660 and around 2700; followed by another confluent area of longer-term Fibonacci levels around 2730-2750.
S&P 500 Four-Hour Price Chart

SPX500 on Tradingview
In the Dow, the 50% marker of the 2015-2020 move sits just ahead at 22,420; and after this potential resistance levels exists at prior price action swings around 22,842 and 23, 572. Beyond this is another confluent zone of Fibonacci levels around the 24,150 area; and the 25,000 level looms large just a bit-higher after this psychological price had helped to set support earlier this week.
Dow Jones Two-Hour Price Chart

Dow Jones on Tradingview
— Written by James Stanley, Strategist for DailyFX.com
Contact and follow James on Twitter: @JStanleyFX
Be the first to comment