


APCortizasJr/iStock Unreleased via Getty Images
Earnings of Cambridge Bancorp (NASDAQ:CATC) will most probably surge next year on the back of the acquisition of Northmark Bank in the last quarter of 2022. Organic loan growth will further support earnings. Moreover, the lagged effect of interest rate hikes on the net interest margin will lift earnings this year. Overall, I’m expecting Cambridge Bancorp to report earnings of $8.49 per share for 2023, up 16% from my estimated earnings of $7.34 per share for 2022. The December 2023 target price suggests a high upside from the current market price. Therefore, I’m adopting a buy rating on Cambridge Bancorp.
Organic Commercial Loan Growth to Add to the Acquisition Benefits
Cambridge Bancorp completed the acquisition of Northmark Bank in October 2022, as per a recent announcement. According to the details given in a previous press release, the target had $314 million worth of gross loans at the end of March 2022; therefore, the acquisition would have increased Cambridge Bancorp’s loan portfolio by around 9%. Additionally, the acquisition would have added $381 million of deposits to Cambridge’s Balance Sheet, representing a growth of 8.9%.
In contrast to the acquired growth, the outlook for organic growth isn’t too bright. High-interest rates will hurt organic loan growth in upcoming quarters, especially in the residential loan segment. Residential mortgages and home equity lines of credit loans make up around 44% of total loans; therefore, a slowdown in this segment will have a significant impact on total loan growth.
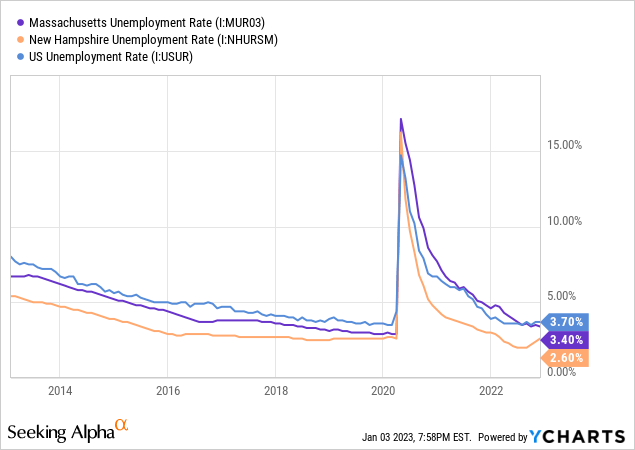
The outlook for commercial loans is a bit brighter because of strong job markets, which indicate robust economic activity. Cambridge Bancorp operates in Massachusetts and New Hampshire, both of which currently have unemployment rates that are better than the majority of other states.
Considering these factors, I’m expecting the loan portfolio to have grown by 9% in the last quarter of 2022, taking full-year loan growth to 19%. For 2023, I’m expecting the loan portfolio to grow by 4%. Meanwhile, I’m expecting deposits to grow more or less in line with loans. The following table shows my balance sheet estimates.
| Financial Position | FY18 | FY19 | FY20 | FY21 | FY22E | FY23E |
| Net Loans | 1,543 | 2,209 | 3,118 | 3,285 | 3,917 | 4,076 |
| Growth of Net Loans | 15.5% | 43.1% | 41.2% | 5.4% | 19.3% | 4.1% |
| Other Earning Assets | 451 | 400 | 492 | 1,176 | 1,343 | 1,384 |
| Deposits | 1,811 | 2,359 | 3,403 | 4,331 | 4,667 | 4,856 |
| Borrowings and Sub-Debt | 93 | 136 | 33 | 17 | 321 | 331 |
| Common equity | 167 | 287 | 402 | 438 | 515 | 561 |
| Book Value Per Share ($) | 40.8 | 61.5 | 63.3 | 62.6 | 66.0 | 71.8 |
| Tangible BVPS ($) | 40.7 | 54.1 | 54.7 | 54.8 | 59.1 | 64.9 |
| Source: SEC Filings, Author’s Estimates (In USD million unless otherwise specified) | ||||||
Lagged Effect of Rate Hikes to Benefit the Margin this Year
Cambridge Bancorp’s net interest margin increased by only nine basis points in the third quarter, following the 12-basis points growth in the second quarter of the year. Due to the large balance of residential mortgages, Cambridge Bancorp’s loan portfolio is quite slow to reprice. At the same time, the deposits are quick to reprice because of the large balance of adjustable-rate deposits. These deposits, including interest-bearing checking, savings, and money market accounts, made up 61% of total deposits at the end of September 2022. As a result, most of the benefits of last year’s fed funds rate hikes will be felt this year and beyond.
According to the results of the management’s simulation model given in the 10-Q filing, a 200-basis points hike in interest rates could boost the net interest income by 1.6% in the first year and 15.1% in the second year of the rate hike.
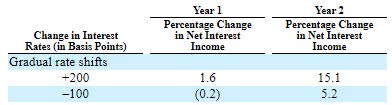
3Q 2022 10-Q Filing
Considering these factors, I’m expecting the margin to have grown by five basis points in the last quarter of 2022. Further, I’m expecting the margin to increase by 40 basis points in 2023.
Expecting Earnings to Surge by 16%
The acquired and organic loan growth will drive earnings this year. Further, the bottom line will receive support from margin expansion. On the other hand, merger-related expenses in the fourth quarter of 2022 will restrict earnings. Further, the high inflation will drive up operating expenses. Meanwhile, I’m expecting the provisioning for expected loan losses to remain at a normal level. I’m expecting the net provision expense to make up around 0.1% of total loans in 2023, which is close to the average from 2017 to 2019.
Overall, I’m expecting Cambridge Bancorp to report earnings of $7.34 per share for 2022, down 5% year-over-year. For 2023, I’m expecting earnings to grow by 16% to $8.49 per share. The following table shows my income statement estimates.
| Income Statement | FY18 | FY19 | FY20 | FY21 | FY22E | FY23E |
| Net interest income | 64 | 79 | 120 | 128 | 141 | 178 |
| Provision for loan losses | 2 | 3 | 18 | (1) | 1 | 4 |
| Non-interest income | 33 | 36 | 40 | 44 | 43 | 43 |
| Non-interest expense | 64 | 78 | 98 | 100 | 111 | 126 |
| Net income – Common Sh. | 24 | 25 | 32 | 54 | 53 | 66 |
| EPS – Diluted ($) | 5.77 | 5.37 | 5.03 | 7.69 | 7.34 | 8.49 |
| Source: SEC Filings, Earnings Releases, Author’s Estimates (In USD million unless otherwise specified) | ||||||
My estimates are based on certain macroeconomic assumptions that may not come to fruition. Therefore, actual earnings can differ materially from my estimates.
High Price Upside Justifies a Buy Rating
Cambridge Bancorp’s annual dividend has increased every year since 2004. Given the earnings outlook, it’s likely that the company will maintain the dividend trend this year. Therefore, I’m expecting the company to increase its dividend by $0.02 per share to $0.66 per share in the first quarter of 2023. The earnings and dividend estimates suggest a payout ratio of 31% for 2023, which is close to the five-year average of 39%. Based on my dividend estimate, Cambridge Bancorp is offering a forward dividend yield of 3.2%.
I’m using the historical price-to-tangible book (“P/TB”) and price-to-earnings (“P/E”) multiples to value Cambridge Bancorp. The stock has traded at an average P/TB ratio of 1.37 in the past, as shown below.
| FY19 | FY20 | FY21 | Average | |||
| T. Book Value per Share ($) | 54.1 | 54.7 | 54.8 | |||
| Average Market Price ($) | 79.3 | 60.3 | 84.8 | |||
| Historical P/TB | 1.47x | 1.10x | 1.55x | 1.37x | ||
| Source: Company Financials, Yahoo Finance, Author’s Estimates | ||||||
Multiplying the average P/TB multiple with the forecast tangible book value per share of $64.9 gives a target price of $89.1 for the end of 2023. This price target implies a 7.4% upside from the January 3 closing price. The following table shows the sensitivity of the target price to the P/TB ratio.
| P/TB Multiple | 1.17x | 1.27x | 1.37x | 1.47x | 1.57x |
| TBVPS – Dec 2023 ($) | 64.9 | 64.9 | 64.9 | 64.9 | 64.9 |
| Target Price ($) | 76.1 | 82.6 | 89.1 | 95.6 | 102.1 |
| Market Price ($) | 83.0 | 83.0 | 83.0 | 83.0 | 83.0 |
| Upside/(Downside) | (8.3)% | (0.5)% | 7.4% | 15.2% | 23.0% |
| Source: Author’s Estimates |
The stock has traded at an average P/E ratio of around 12.6x in the past, as shown below.
| FY19 | FY20 | FY21 | Average | |||
| Earnings per Share ($) | 5.37 | 5.03 | 7.69 | |||
| Average Market Price ($) | 79.3 | 60.3 | 84.8 | |||
| Historical P/E | 14.8x | 12.0x | 11.0x | 12.6x | ||
| Source: Company Financials, Yahoo Finance, Author’s Estimates | ||||||
Multiplying the average P/E multiple with the forecast earnings per share of $8.49 gives a target price of $106.9 for the end of 2023. This price target implies a 28.8% upside from the January 3 closing price. The following table shows the sensitivity of the target price to the P/E ratio.
| P/E Multiple | 10.6x | 11.6x | 12.6x | 13.6x | 14.6x |
| EPS 2023 ($) | 8.49 | 8.49 | 8.49 | 8.49 | 8.49 |
| Target Price ($) | 89.9 | 98.4 | 106.9 | 115.4 | 123.9 |
| Market Price ($) | 83.0 | 83.0 | 83.0 | 83.0 | 83.0 |
| Upside/(Downside) | 8.4% | 18.6% | 28.8% | 39.1% | 49.3% |
| Source: Author’s Estimates |
Equally weighting the target prices from the two valuation methods gives a combined target price of $98.0, which implies an 18.1% upside from the current market price. Adding the forward dividend yield gives a total expected return of 21.3%. Hence, I’m adopting a buy rating on Cambridge Bancorp.
Be the first to comment