

malerapaso
The Cambria Shareholder Yield ETF (BATS:SYLD) is an actively-managed mid-caps-heavy fund targeting 100 quality U.S. companies capable of rewarding shareholders via dividends and buybacks, as well as paying down debt.
The main advantage of this investment vehicle is its remarkable exposure to the value factor, which is no coincidence given the fund’s tilt towards the mid-cap echelon. Meanwhile, the mid/small-size tilt exposed the current version of the portfolio to quality issues, though in fairness, its allocation to highly profitable names is still material thanks to its carefully calibrated methodology.
On the negative side, the performance of SYLD was mixed in the past, with the solid bright spot being 2021. During most of the previous decade, SYLD delivered annual returns either in line or marginally weaker compared to the iShares Core S&P 500 ETF (IVV); it finished ahead of the bellwether fund only twice, in 2016 and 2021, which raises concerns about whether its focus on the dividend & buyback factors is capable of delivering alpha consistently. Another downside is its rather burdensome expense ratio of 59 bps, which certainly contributed to its underperformance. I will additionally address whether it was more successful compared to counterparts with akin strategies below in the note.
In sum, though appreciating the relative inexpensiveness of the SYLD portfolio, I assign it a Hold rating. Now let us discuss all of the above in greater depth.
Investment strategy
SYLD’s active investment strategy revolves around the concept of the shareholder yield, which aggregates share repurchases, dividends, and debt paydowns.
In short, it attempts to whittle the list of eligible U.S. equities down to around 100 names selecting those with the highest shareholder yields, also applying the value factor which relies on a composite of a few multiples including P/E, EV/EBITDA, Price/FCF, etc. The summary prospectus provides more details on this multi-step process.
The product of this cash flow-centered value strategy is a 101-strong portfolio, with Dillard’s, Inc. (DDS), an around $3.7 billion retail department store player, being the key holding with a ~2.4% weight. Though it has a measly yield of just a few basis points, DDS is fairly active with buybacks. Its most recent Form 10-Q shows it bought 735 thousand shares, with the cost being close to $187 million, while it still had “$425.5 million of authorization remained under the February 2022 Stock Plan.”
Speaking of sectors, SYLD is enamored of consumer discretionary, the sector DDS represents, with around 25.7% of the net assets invested in it. Financials are in second place, accounting for around a quarter of the portfolio. Materials are the last in the top trio, sporting a 17.2% weight. SYLD sees little value in communication services (less than 2%) and consumer staples (around 1%).
Calibrating the portfolio, SYLD allocated a large share of the net assets to mid-and small-cap companies, almost 60%. We see just two names from the mega-cap echelon, namely Exxon Mobil (XOM), an energy supermajor, and JPMorgan & Chase (JPM), a heavyweight bank, together accounting for just 1.7%. In my view, this has contributed to almost 55% of the holdings having a B- Quant Valuation grade, as smaller companies in most cases trade at a discount to the respective sector medians. To corroborate, just 12 stocks (precisely 12% weight) in this 57-strong group with value characteristics have market values above $10 billion. Below I compiled the cheapest stocks in the SYLD basket as of July 5.
Created by the author using data from Seeking Alpha and the fund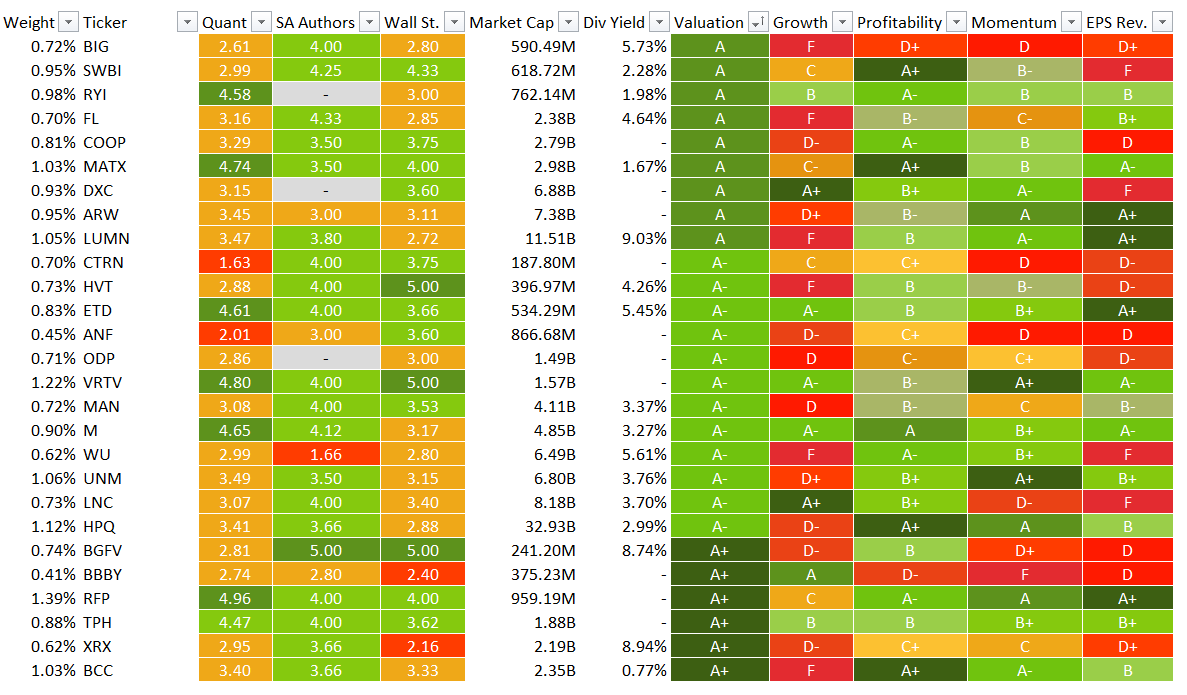
As you can notice, stocks that do not pay a dividend can be found aplenty in this set. Generally speaking, close to 16% of the SYLD net assets are parked in equities that do not pay a dividend, though share repurchase programs nevertheless allowed them to qualify for inclusion.
That said, this ETF is not a high-yield dividend mix. Rather, I am of the opinion its strategy is more about delivering capital gains undergirded by the quality (measured using buybacks, dividends & debt reduction) and value factors.
Turning to multiples, excluding financials, the median EV/EBITDA is around 5.9x; the share of those with double-digit multiples is just below 10%. In fairness, this is exceedingly cheap, once again illustrating that SYLD has decent value characteristics. Regarding Forward P/Es, excluding stocks without analyst estimates and with negative Forward EPS, the median is a phenomenal 7.4x. Moreover, the median FCFE yield for companies outside financials and excluding those FCF-negative stands at ~12.6%. Again, this points to deep undervaluation.
Turning to quality, though most SYLD holdings have overall robust profitability illustrated by almost 80% sporting a Quant Profitability rating of no less than B-, I believe there are a few minor disappointments investors should know about:
- There is a handful of loss-making companies, like CNX Resources (CNX). Their weight is around 4.3%. Remember, losses are not necessarily indicative of the inability to cover shareholder rewards organically. Cash flows are of greater importance.
- SYLD does hold net CFFO-negative companies. Thankfully, I spotted just four, like Big Lots (BIG). In sum, they account for a modest 2.5%, not posing a meaningful risk for returns.
- There is also something to dislike on the EBITDA side. This metric is negative for CNX and Bed Bath & Beyond (BBBY).
- Almost 7% failed to fully cover LTM capital expenditures. In this cohort, we again see BBBY, together with DuPont de Nemours (DD), Helmerich & Payne (HP), etc.
Performance: did this value/quality strategy deliver alpha?
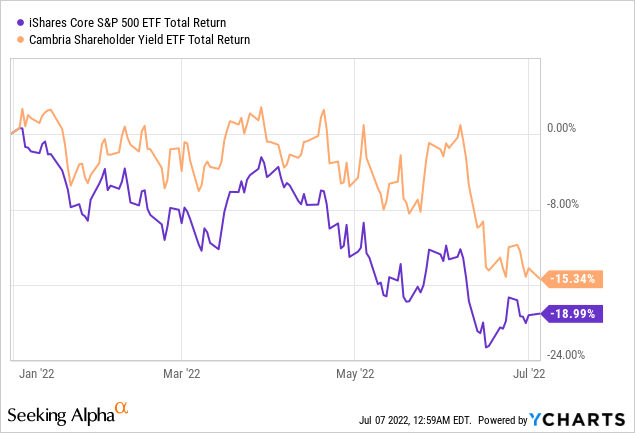
The answer is “at times.” SYLD had a blockbuster 2021, delivering around 48.3% total return. Still, it gave up a good chunk of its last year’s gains in tumultuous 2022 despite performing marginally better compared to IVV.
To date, the strongest period for SYLD was the one between May 2013 (SYLD was incepted on 13 May 2013) and June 2021, when it managed to deliver a CAGR of almost 16% vs. IVV’s 14.8%. However, the downside is weaker risk-adjusted returns as illustrated by the Sharpe and Sortino ratios.
Created by the author using data from Portfolio Visualizer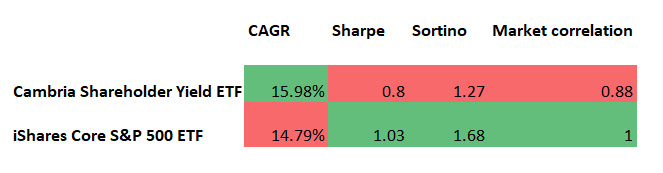
With the rest of 2021 and 2022 included, the results are only marginally in favor of SYLD; risk-adjusted returns are weaker again.
Prepared by the author using the data from Portfolio Visualizer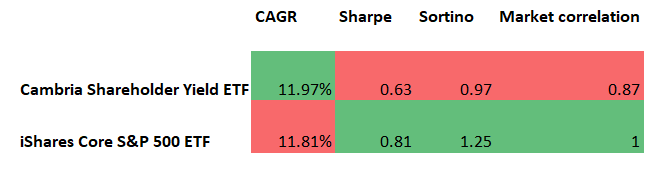
However, the fund did outperform its peers iShares U.S. Dividend and Buyback ETF (DIVB) and Invesco BuyBack Achievers ETF (PKW) during the December 2017 – June 2022 period (DIVB was incepted on 7 November 2017), mostly owing to stellar 2021 despite soft 2018 and 2019.
Created by the author using data from Portfolio Visualizer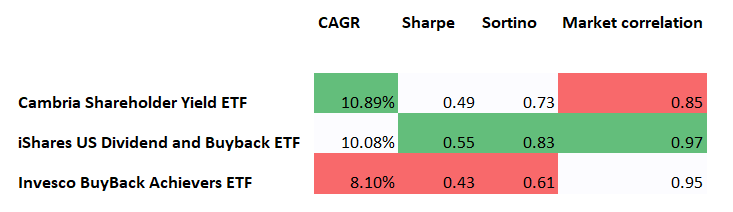
Final thoughts
SYLD is a Hold, despite a few advantages detailed above. Unfortunately, its strategy did not deliver consistent alpha in the past, despite anecdotal evidence suggesting companies that are either buying back stock (boosting per-share metrics) or returning cash to shareholders should see their prices appreciating quicker compared to the broad market, with fees being amongst detractors. I am not impressed by the 2.7% yield SYLD is offering now either.
I acknowledge that the historical CAGRs are likely skewed owing to the S&P 500 being propelled by the mega-cap tech rally, which was not the case for SYLD. Investors may also riposte here that the ultra-accommodative monetary policy is now something of the past, and the shareholder yield & value strategy looks promising for the hawkish early 2020s.
I concur. Value stocks should fare better compared to their pricier counterparts. What concerns me is the size factor. I am uncertain whether small-size value stocks can outperform should a recession strike. I am more of the opinion they will suffer losses despite relative inexpensiveness; their sensitivity to the economic cycles and inherently lower quality are among the risks to consider.
Summing up, SYLD is not delivering excess returns systematically and is not providing market-leading income; its fees will be consistently eating into standardized yield for long-term investors.
Be the first to comment