

Epiximages
Thesis
In my opinion, Cambria Shareholder Yield ETF (BATS:SYLD) is better for long-term investing than everyone’s favorite SPDR S&P 500 Trust ETF (NYSEARCA:SPY), the most liquid and popular passive exchange-traded fund (“ETF”) among retail investors. It is about the fund’s structure that should theoretically continue to show abnormal returns in the future thanks to current macro trends. That’s the thesis I’m going to walk you through in today’s article.
Why Do I Think So?
Let’s take a look at the key comparison metrics of SYLD and SPY:
| Metric / Fund Name | SYLD | SPY |
| ETF description | The Cambria Shareholder Yield ETF utilizes a quantitative approach to invest in US equities with high cash distribution characteristics. The initial screening universe includes stocks in the United States with marketing capitalizations over $200 million. The ETF is comprised of 100 companies with the best-combined rank of dividend payments and net stock buybacks, which are the key components of shareholder yield. The ETF also screens for value and quality factors, including low financial leverage. | SPY is one of the largest and most heavily-traded ETFs in the world, offering exposure to one of the most well-known equity benchmarks. While SPY certainly may have appeal to investors seeking to build a long-term portfolio and include large-cap U.S. stocks, this fund has become extremely popular with more active traders as a way to toggle between risky and safe assets. A look at SPY’s daily turnover reveals the short average holding period and the popularity with active traders. |
| Daily Volume | $8.5M | $31.1B |
| Net Assets | $568.4M | $340.1B |
| Expense Ratio | 0.59% | 0.09% |
| Investment Objective | Equity Income | Equity: U.S. – Large Cap |
| Fund Type | Actively Managed ETF | Passively Managed ETF |
| Inception date | May 14, 2013 | Jan 22, 1993 |
Source: Author’s compilation based on cambriafunds.com, etfdb.com, and Investing.com
At first glance, it may seem like I am comparing apples to oranges, but that is not the case. A passive long-term investor primarily wants a good return many years forward, and all that matters to him except for return is the amount of risk he takes on his position (volatility, maximum drawdown, etc.). If we have 2 ETFs that are managed with different frequencies (passively/actively), but have similar risks and do not differ significantly in terms of content complexity, I think it is reasonable to put them in a row and perform comparative analytical manipulations. Why not, if they cover roughly the same zone of the efficient frontier in terms of risk?
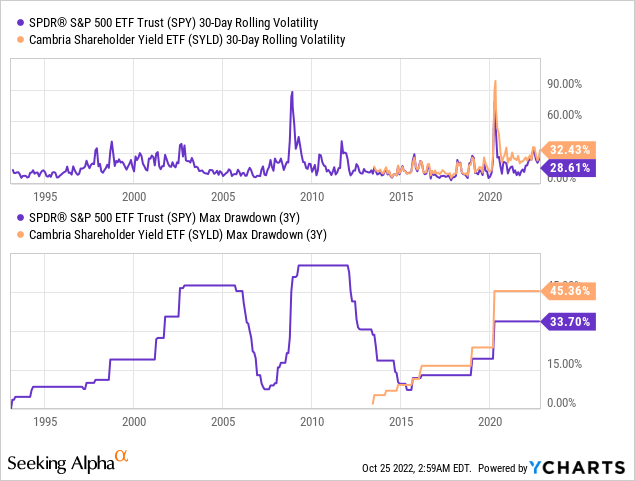
SYLD had a deeper drawdown in 2020, outpacing SPY’s one by 11.6%. This was explained by the fact that SYLD aims to achieve high total shareholder returns, and the main goal of SPY is to replicate (SPX), which simply takes the largest companies in the market indiscriminately (this also obviously affects the divergence in expense ratios of the funds). Since broad market stocks tend to fall during hard selloffs with a certain multiplier to SPX (most stocks have a beta above 1), the maximum drawdown is in any case higher than what we see with SPY. This is not unique to SYLD – for example, the Russell 2000 Value ETF (IWN) also has a similar excess of the maximum drawdown (12.37%) with a similar excess in terms of volatility:
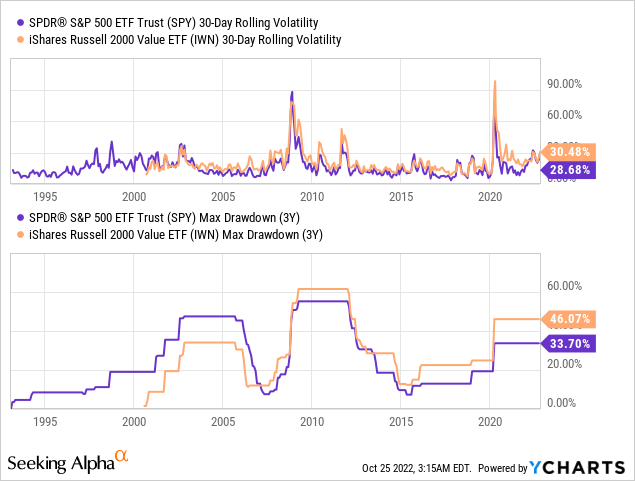
To stay with the risk/reward ratio: the only difference between the 3 funds mentioned above is the denominator of the coefficient in question, i.e., the rate of return. More precisely, the speed with which the maximum drawdown of Covid time was made up by each of the ETFs:
YCharts, author’s calculations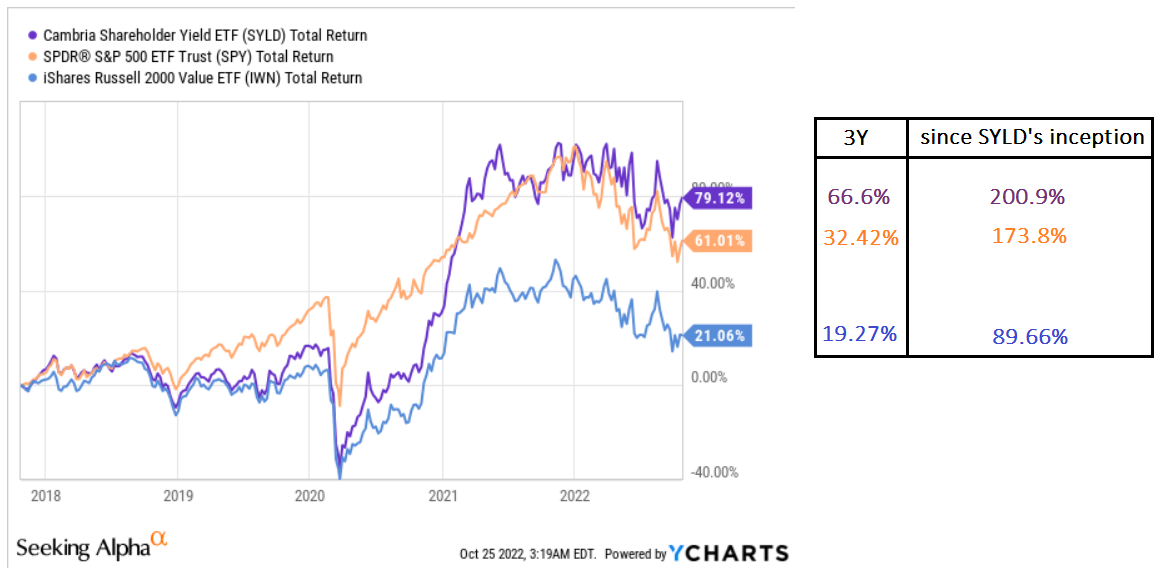
Despite a steeper decline than SPY during the Covid recession, SYLD recovered much faster thanks to a more conservative approach – focusing on the most stable companies seeking to increase total returns (buybacks + dividends). At the same time, the dominance over SPY can be observed in different time frames – for the last year, 3 years, or since the launch of the youngest of the analyzed instruments – SYLD.
But how does Cambria manage to outperform the market while having volatility that is not significantly different from it?
According to SYLD’s prospectus, Cambria selects the top 20% of stocks in the initial universe of U.S. companies based on their total return prospects and then sorts them based on the price-to-book ratio (P/B), price-to-sales ratio (P/S), the price-to-earnings ratio (P/E), price-to-free cash flow ratio (P/FCF or P/ CF), and enterprise multiple (EV/EBITDA). The top 100 stocks are then included in SYLD’s portfolio which has a turnover rate of 51% of the average portfolio value (as of April 30, 2022).
Among the 102 companies that make up the fund’s portfolio (as of September 30, 2022), there is a strong overweight in value-related sectors like Consumer Cyclicals, Financials, Materials, Energy, and Industrials:
Seeking Alpha, SYLD’s Holdings, author’s notes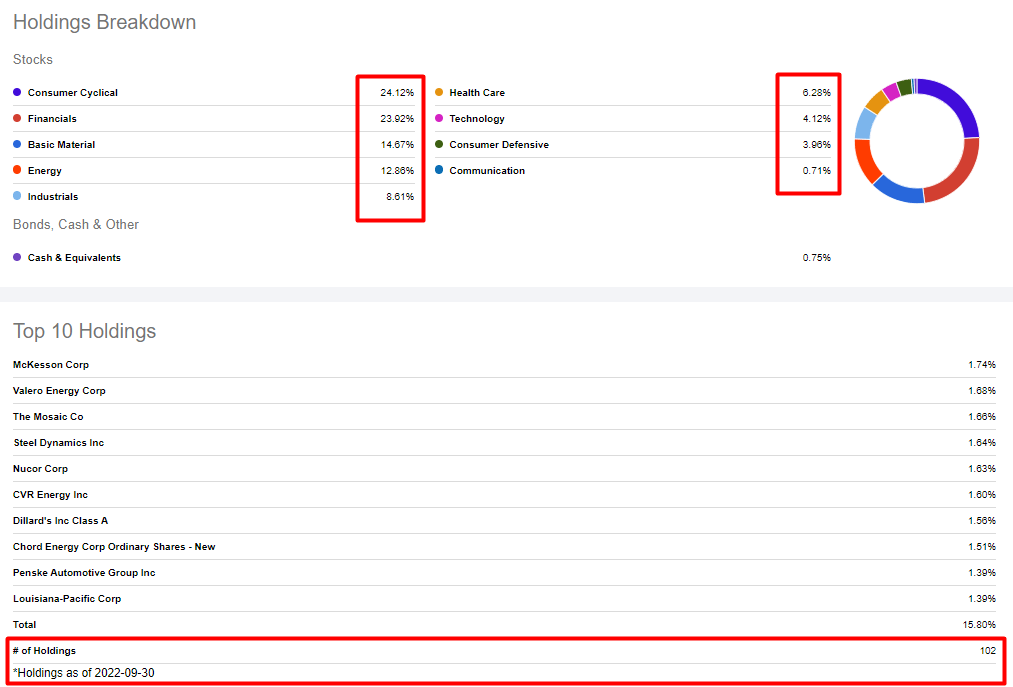
It may seem that this is not diversified enough. But at the same time, the top 3 and top 5 sectors of SPY account for 51.81% and 71.47% of its total portfolio, respectively. And most of the portfolio value is allocated to large technology companies that I believe had a business cycle peak in 2021-2022.
Seeking Alpha, SPY, author’s calculations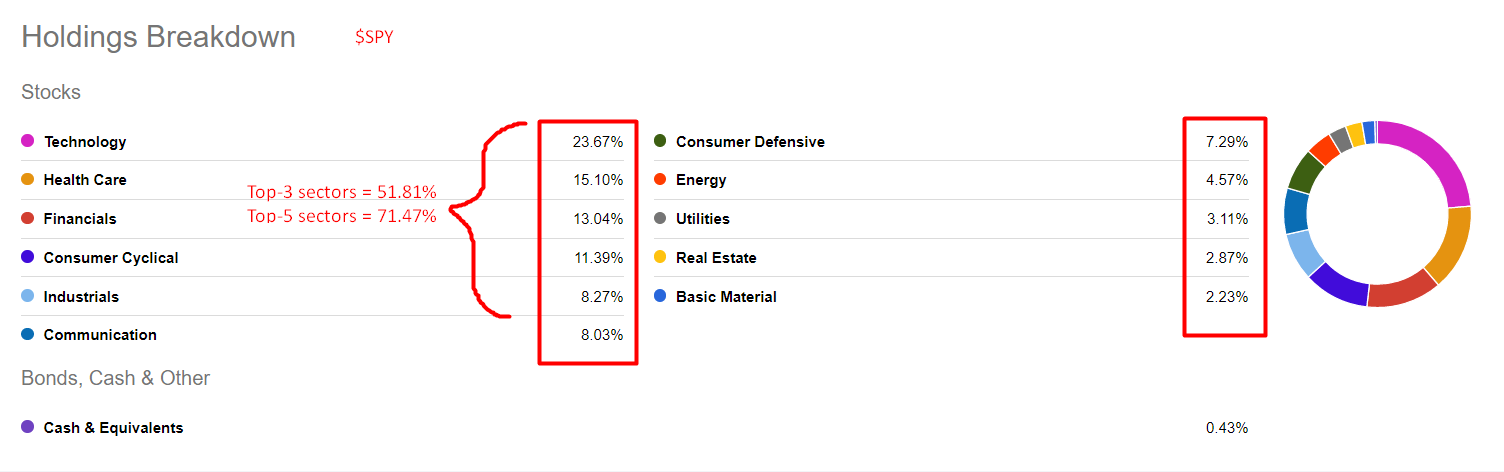
Looking ahead over the next few years, SYLD will likely continue to outperform the broader market and SPY in particular, as the current level of underinvestment in the Materials and Energy sectors predicts abnormal returns and a new bullish cycle of high-quality value companies producing and selling commodities. This argument is not new – in the professional community of hedge fund managers, the thesis in favor of commodity-based companies has been actively propagated for a few months. For example, below you can see a chart from Crescat Capital, which was one of the first to promote this topic.
Crescat Capital, newsletter [May 1, 2022]![Crescat Capital, newsletter [May 1, 2022]](https://static.seekingalpha.com/uploads/2022/10/25/49513514-16666879559664457_origin.png)
Energy companies are far from the only beneficiaries of the capital exodus from technology stocks – the case for owning mining companies has never been more compelling, according to the latest [Oct. 19, 2022] newsletter from Crescat Capital. Analysts say that while we have seen general fundamental improvements across the industry, profitable mining companies today are also trading at their lowest P/E ratios ever – this ratio currently matches the 2008 low:
Crescat Capital, newsletter [October 19, 2022]![Crescat Capital, newsletter [October 19, 2022]](https://static.seekingalpha.com/uploads/2022/10/25/49513514-16666889255961714_origin.png)
In my opinion, U.S.-based consumer cyclical companies will also be among the beneficiaries of the deglobalization processes currently taking place in the world (and most likely to take place in the future) due to the current geopolitical tensions. This is the opposite of what happened in the mid-1940s, when World War II ended and marked the beginning of an increasingly globalized trade environment.
The relationship between the G7 countries, which have sophisticated economies and democratic governments, and the two largest authoritarian, centrally planned Eastern Bloc nations – China and Russia – has deteriorated quickly. It indicates that commerce with the autocratic East will continue to fall apart. It will need significant additional infrastructure expenditure in the coming years to achieve this transformation, which will strategically assist Western nations in lowering their economic dependency on China, Russia, and other foreign dictatorial empires.
Based on SYLD’s portfolio structure, we can see that this ETF is well positioned to get the most out of the process described above because: a) it is only invested in the U.S.; and b) 9 of the 10 largest holdings will benefit directly from domestic infrastructure development (if the same proportion is true for the remaining 90 stocks in the portfolio, the odds of abnormal returns are even higher):
etf.com, SYLD, author’s notes
It is impossible not to mention the financial sector – the largest in the SYLD structure. If you take out all the companies within the ETF, you will find that the financial sector is mostly regional banks and insurance companies:
Author’s selection based on etf.com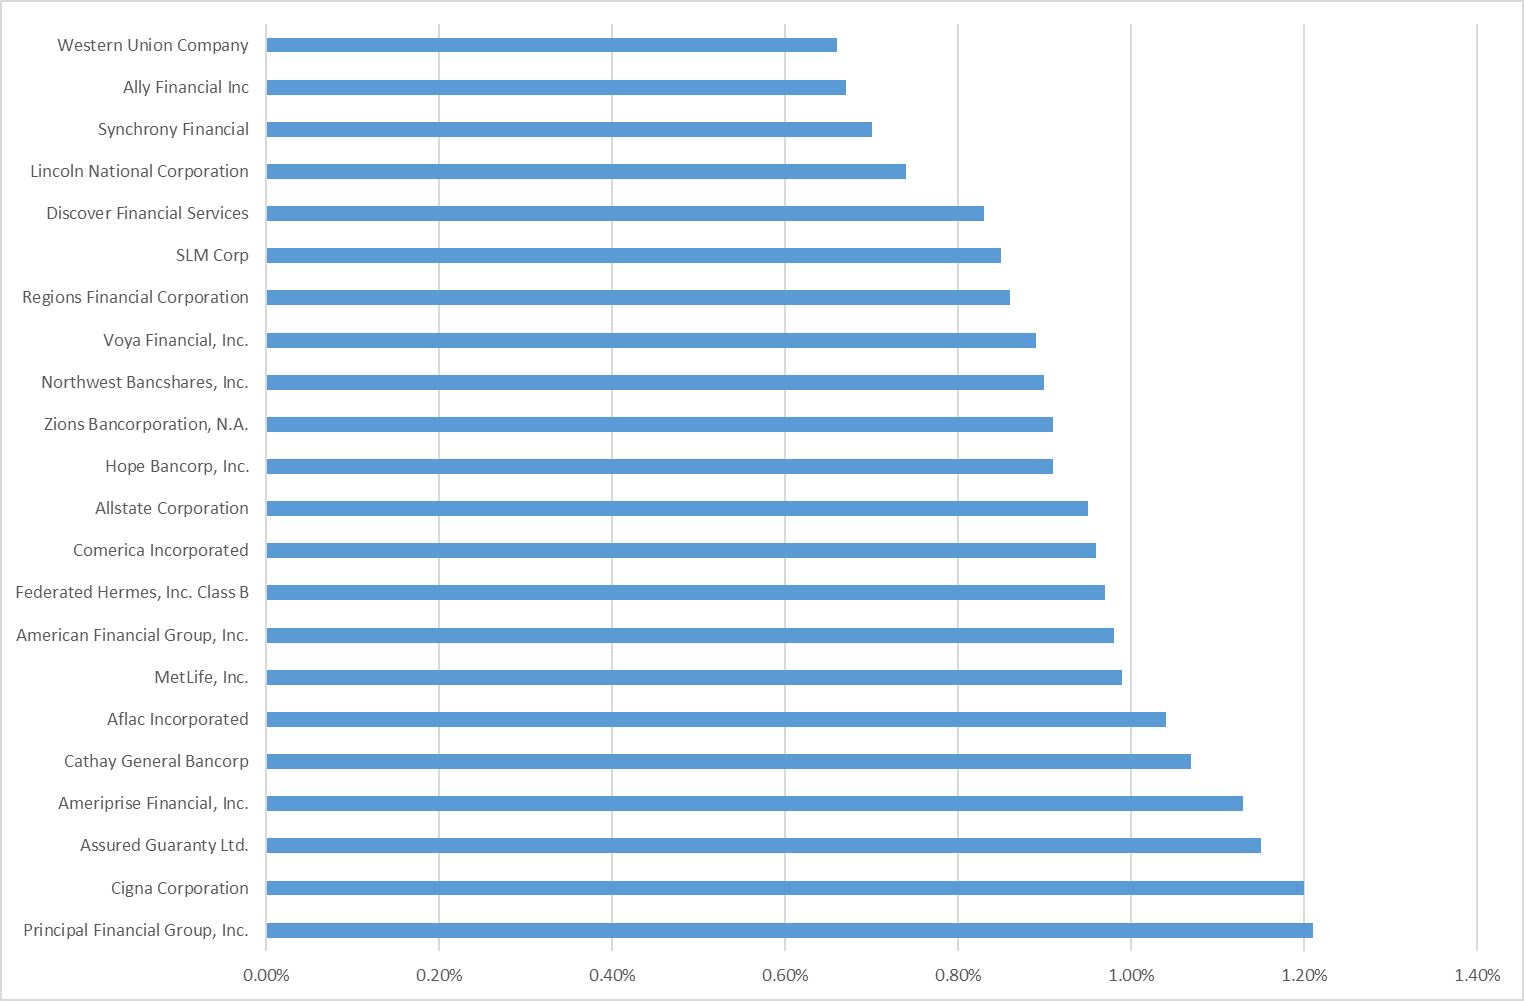
In a recent Bear Traps report, Larry McDonald quotes a banking industry veteran (he does not give the gentleman’s name) who writes the following about regional banks:
Not to discuss any specific bank, but having been in the industry for 35 years, I must say that regional banks are as undervalued as I’ve seen. The market simply hasn’t priced in an interest rate structure of higher for longer that will significantly raise ROAs to 1980 & 1990s levels.
Source: Bear Traps Reports, [October 24, 2022], emphasis added by the author
My guess is that the decline in inflation that the market has now priced in will again prove to be false – many experts agree that we are in for a protracted period of “inflation well above the 2% target” that will force the Fed to deviate from its usual model of permanently stimulating economic growth with its too soft low-interest rate policy. As long as interest rates remain above the target, the banks’ current market multiples against a backdrop of widening spreads will provide excellent opportunities for long-term investors to gain alpha through both operational growth (higher net interest income and margins) and a combination of buybacks and dividends, as pursued by SYLD.
Bottom Line
I believe that a constant dollar-averaging investing in Cambria Shareholder Yield ETF offers patient investors (I would use a minimum horizon of 5-6 years) the opportunity to achieve alpha above the SPX at about the same level of risk – the world is going through a global rotation of assets from one sector to another, and SYLD is the host in this case.
The obvious risk, of course, is the lack of diversification – SYLD is not really sufficiently engaged in some individual sectors. However, this has an advantage – the (under)outperformance of our investments depends on underweighting and overweighting.
So I would recommend considering SYLD for the long term.
Be the first to comment