adventtr/E+ via Getty Images
During the later part of the third quarter, analysts and investors pondered the direction of crack spreads, crude oil, and other important issues with fossil fuel products, trying to ascertain future values. With a recession looming many believed that crude and crack spreads were headed deeply south. But thus far this hasn’t been the case. For refineries and specialty businesses, such as Calumet Specialty Products, (NASDAQ:CLMT) the opposite is playing out. Both of CLMT’s main businesses will likely see significant positive results for the third and fourth quarters.
In Outer Space
Calumet went galactic in September with its Greats Fall Refinery shutdown/turnaround for major repairs and implementation of the Phase I Renewable Diesel project. Our best sources state that the plant is back in operation after an undetermined shutdown length.
We begin our outer space journey with a qualitative analysis of where things stand. Key parameters, which help define the performance of the company’s financial results, are crack spreads such as Gulf Coast 2-1-1, and WCS/WTI and crude oil pricing itself. Refining reflects itself within the values of the first two, while specialty results are highly dependent upon crude oil in an inverse manner. Included next are a couple of tables showing the value of each key parameter for the past several months generated using our own personal data from Today in Energy and Oilprice.
| Spread | Apr. | May | June | July | Aug. | Sept. | Oct.TD |
| GC 2-1-1 | $39 | $52 | $59 | $44 | $38 | $37 | $50+ |
| WCS/WTI | $16 | $14 | $16 | $14 | $13 | $21 | $23 |
| Total | $55 | $66 | $75 | $58 | $51 | $58 | $75 |
The next table shows the average price of West Texas for the same months.
| Crude | Apr. | May | June | July | Aug. | Sept. | Oct.TD |
| WTI | $102 | $109 | $115 | $102 | $94 | $85 | $87 |
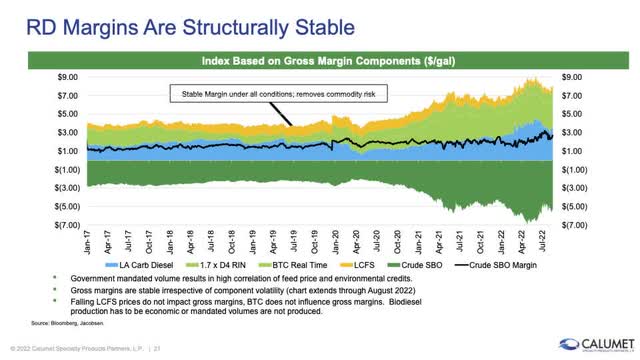
With the Renewable Diesel operation at MRL starting at Great Falls, it is helpful for investors to review the following slide from Calumet MRL Investor Day.
MRL Investor Day
A nominal margin for Renewable Diesel equals about $1.75 (the black line above) or about $75 dollars a barrel.
Predicting Calumet’s September And December Performance
Next, a review of possible financial results for September and December follows. Again, in our previous article, It’s the Final Countdown for Calumet Specialty Products, we noted that every $10 increase in GC 2-1-1 spreads adds approximately $30 million of EBITDA per quarter.
This next table summarizes the pluses and minuses between the June and September quarters.
| EBITDA (Millions Rounded) | 2nd Q | 3rd Q | 4th Q |
| Speciality plus Fuels | $125 | $95 * | $125 |
| Speciality Part Portion | Unk | Positive QoQ | Positive over June |
| Great Falls/MRL | $70 | $30-$60 ** | $70 + *** |
* Adjusted by $30 million lower with GC 2-1-1 spread $10 dollars lower.
** Length of outage unknown, but for each month outage, the dollar amount is approximately $23 million.
*** MRL will be operating at some rate with margins at $75 per barrel or higher, perhaps significantly higher.
A few notes concerning 4th quarter performance for specialty with fuels and MRL/Great Falls seem in order. The crack spread data for October supports similar performance versus June. It is true that this is only one month, but other positive factors are ramping in including significantly higher quarterly EBITDA with Performance Brands, a division which has performed abysmally in recent quarters. Increasing crude prices have also been a headwind for the true specialty portion. It isn’t clear what positive effect might be in store between third and fourth quarters, but it will be additive and from past experience, significant, perhaps enough to cover most of the EBIDTA drop in slightly lower crack spreads.
When comparing the second quarter to the third quarter, an estimate of something north of $130 million is likely, maybe closer to $150 million. A more forward view into the fourth quarter places EBITDA back at second quarter numbers near $180 million. With something near $75 total spreads at Great Falls, the cash performance with either Renewable Diesel or fossil fuel isn’t dynamically different going forward. Great Falls mints cash at least for now.
Back To The Charts
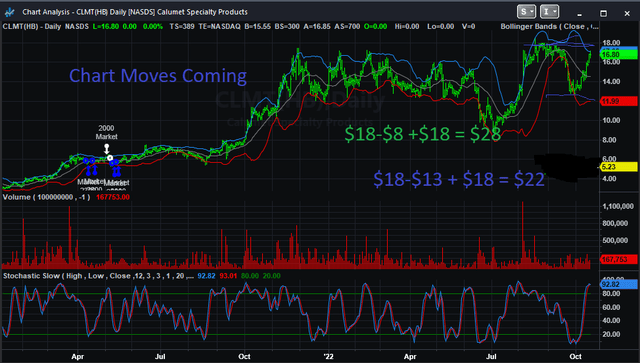
Let’s head back to the chart created using TradeStation Security software.
The day bar chart shows a short-term and a long-term trend. A breakout of $18 opens a trend to $22 ($20-$25) followed in time by a move to near $30. The above results do support this kind of price move. Our belief is that the market is simply waiting for more proof. We cannot over state the importance of the higher low during the past two corrections.
Risk & Investment
From a risk standpoint, a very deep recession will have some negative effects. The production from MRL is fairly insulated through state laws in Washington, Oregon, and California. The other older businesses will likely be significantly deleveraged, reducing their risk. The stock price would suffer, but the viability of the company seems firmly in place.
For us, the question remains, how long will the crack spreads remain galactic? In our view, with limited refining capacity in the US, tight spreads will naturally remain higher than past history. Time will tell its tale, but we believe that Calumet has gone galactic and is likely to remain elevated for years to come.


Be the first to comment