

tacojim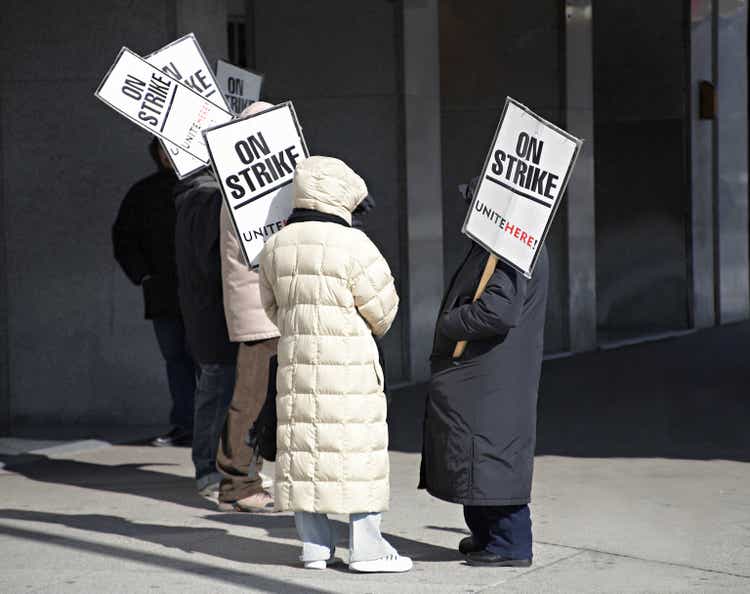
On Wednesday, I joined Seana Smith and Dave Briggs on Yahoo! Finance to discuss the low volume (plus tax-loss selling) buyers’ strike taking place in the market this week. Thanks to Taylor Clothier, Sydnee Fried, Seana and Dave for having me on. How does the strike get resolved? Watch here.
Here were my show notes ahead of the segment plus some additional market thoughts:
Seasonal strength:
Market rallies ~18% in 12 months following midterm election. (Nov-May best months of year)
Dow Jones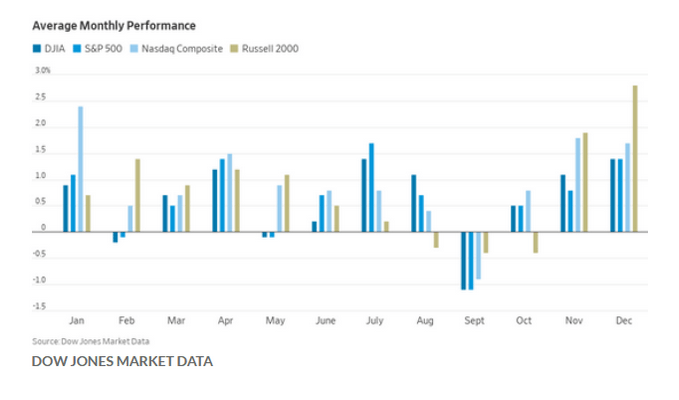
GDP:
Atlanta Fed GDPNow tracking at 3.4% for Q4.
Atlanta Fed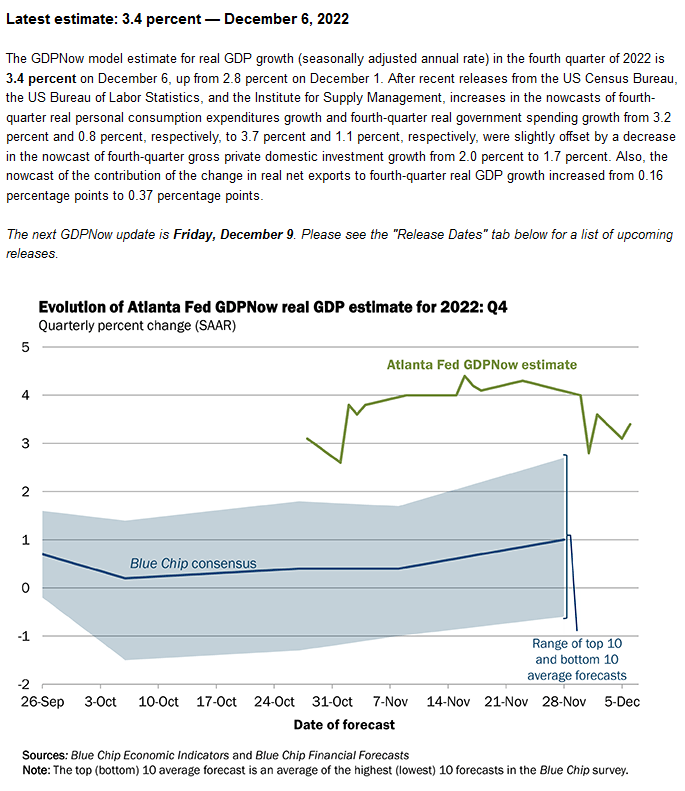
Fed slowdown:
(50bps in Dec) followed by 25-50bps 2023 – then pause:
Marketwatch
Trust Leuthold Group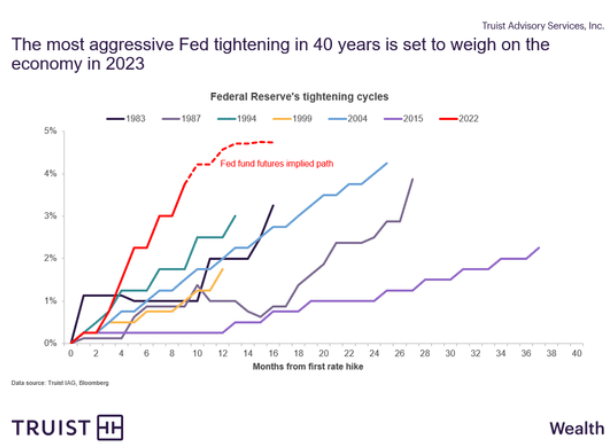
What happens after a Fed Pause?
Bloomberg Twitter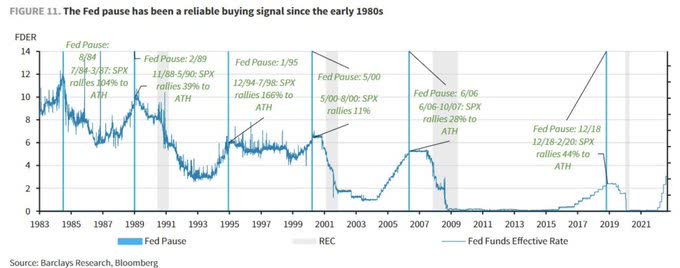
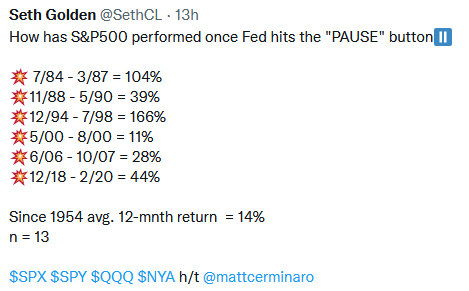
h/t Seth Golden
Bloomberg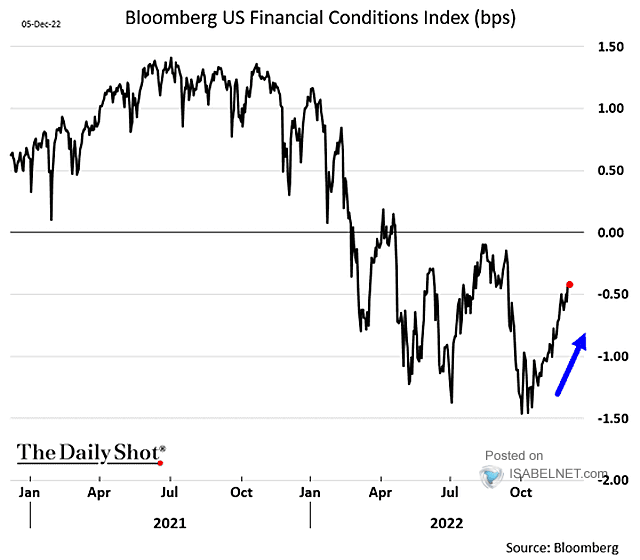
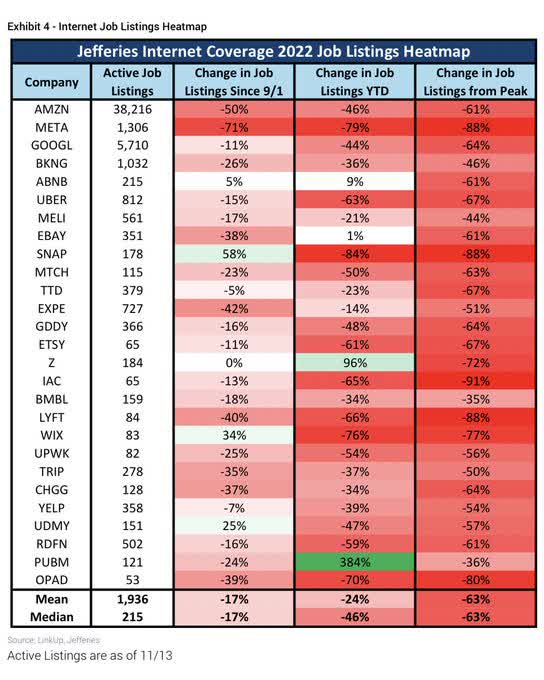
The Jobs Report was stronger than expected (more jobs & higher wage growth but lower hours). ISM Services PMI also hotter than expected:
Labour Department Jefferies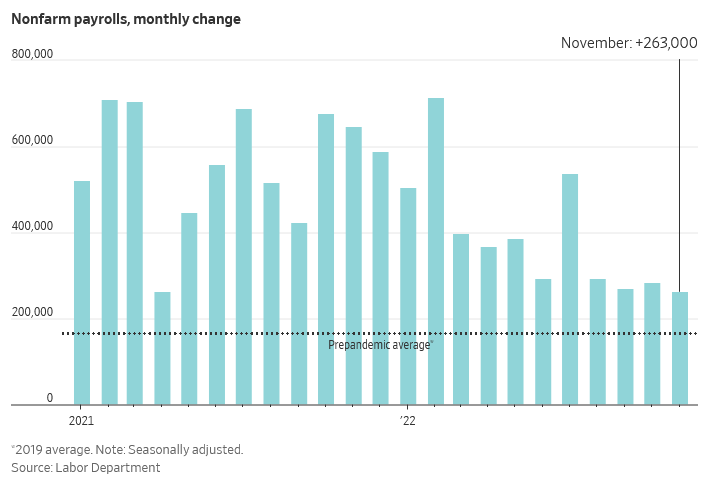
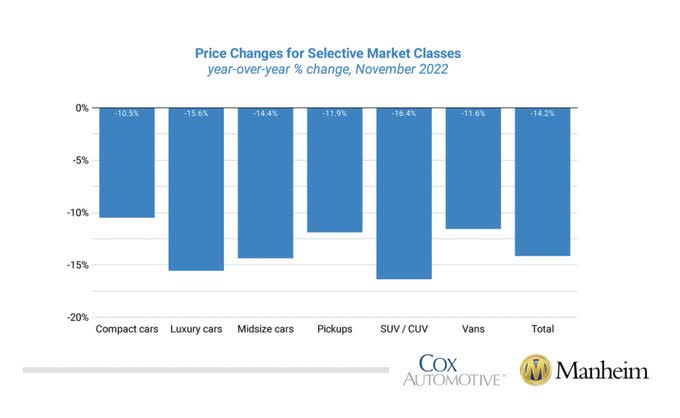
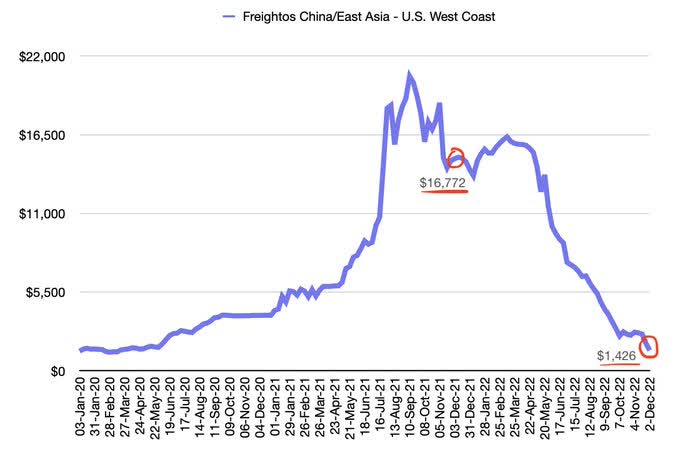
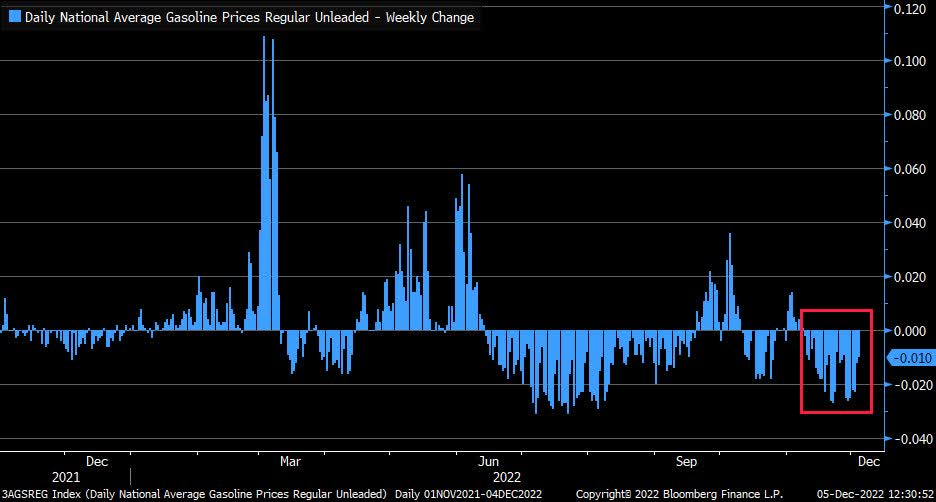
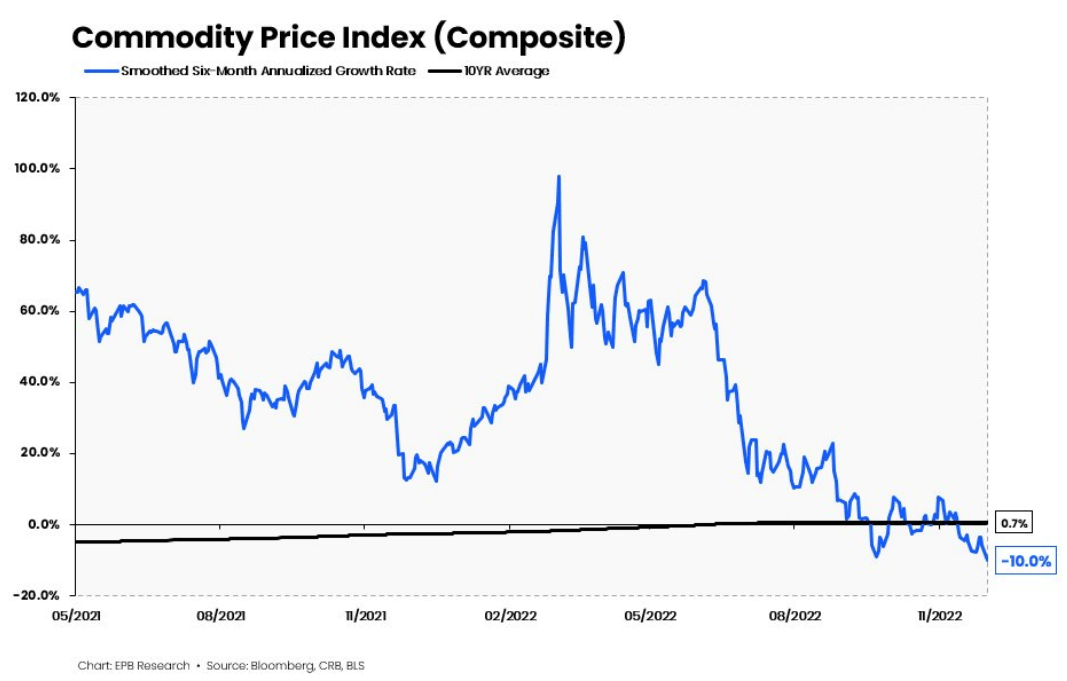
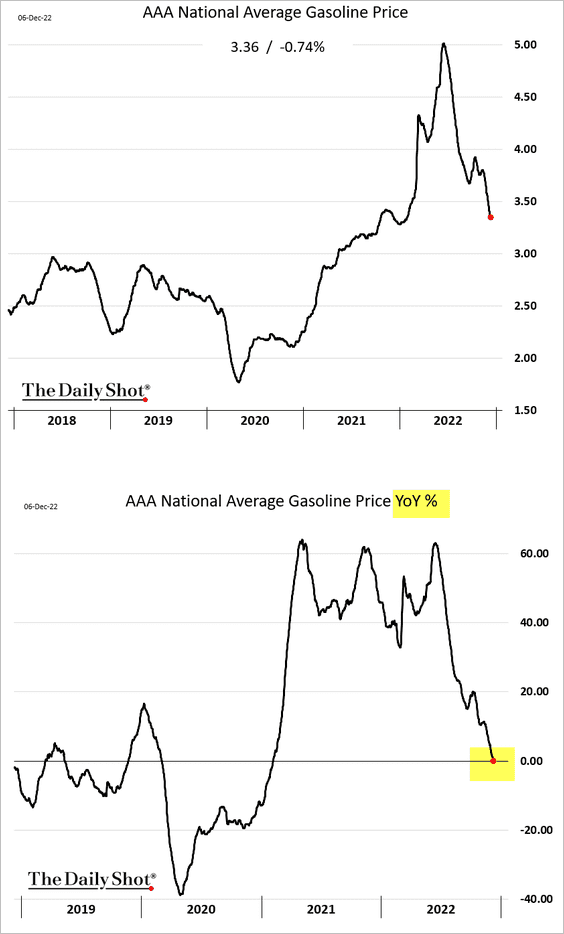
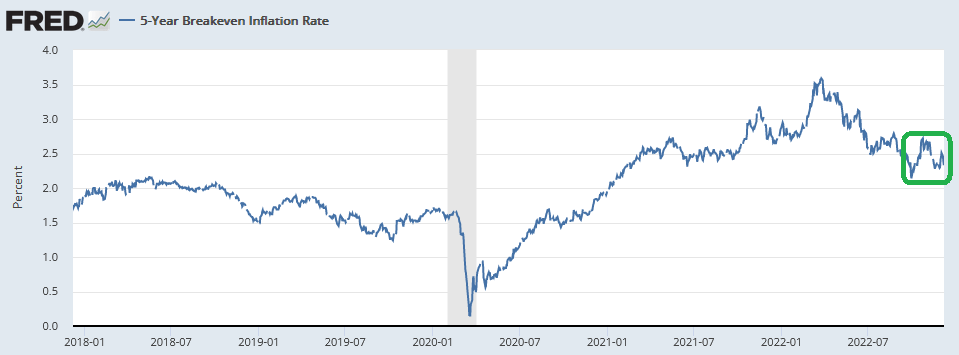
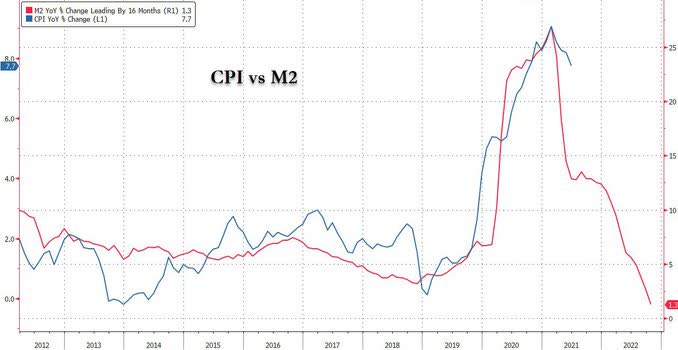
PPI (Friday +7.2% est) and CPI (next Tuesday) are key to give Fed Cover to slow:
The Daily Shot Manheim Freight Data Bloomberg Bloomberg Twitter Fred Fred The Daily Shot The Daily Shot Fred Zerohedge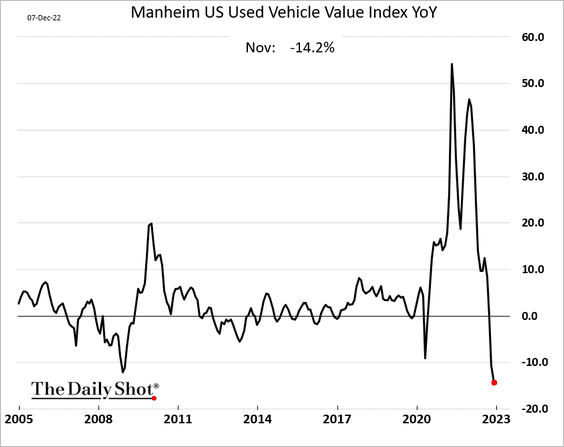
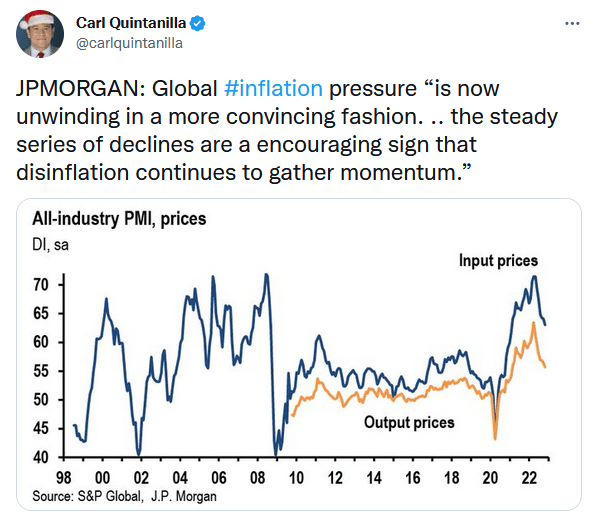
h/t zerohedge
Stocks have now fully retraced the rise that was attributed to Jerome Powell’s (relatively) dovish statements last Wed.
- 10-year Treasury closed at 3.43% today (35bps lower than it was trading when Jerome Powell spoke last Wednesday and down from 4.33% peak). This is sending a dis-inflationary signal that the Fed has already been too restrictive and will result in falling prices (deflation) in coming months (if not as early as next week’s report).
Stockcharts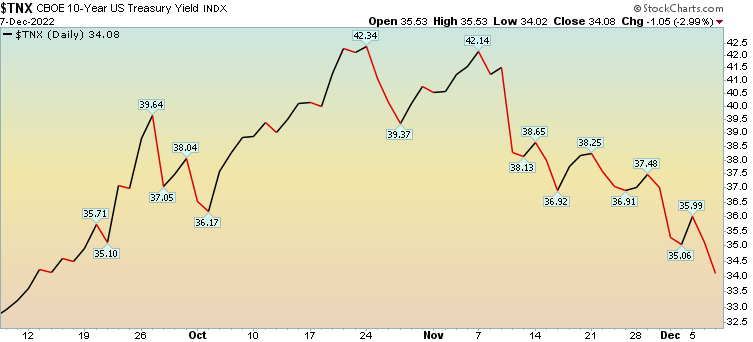
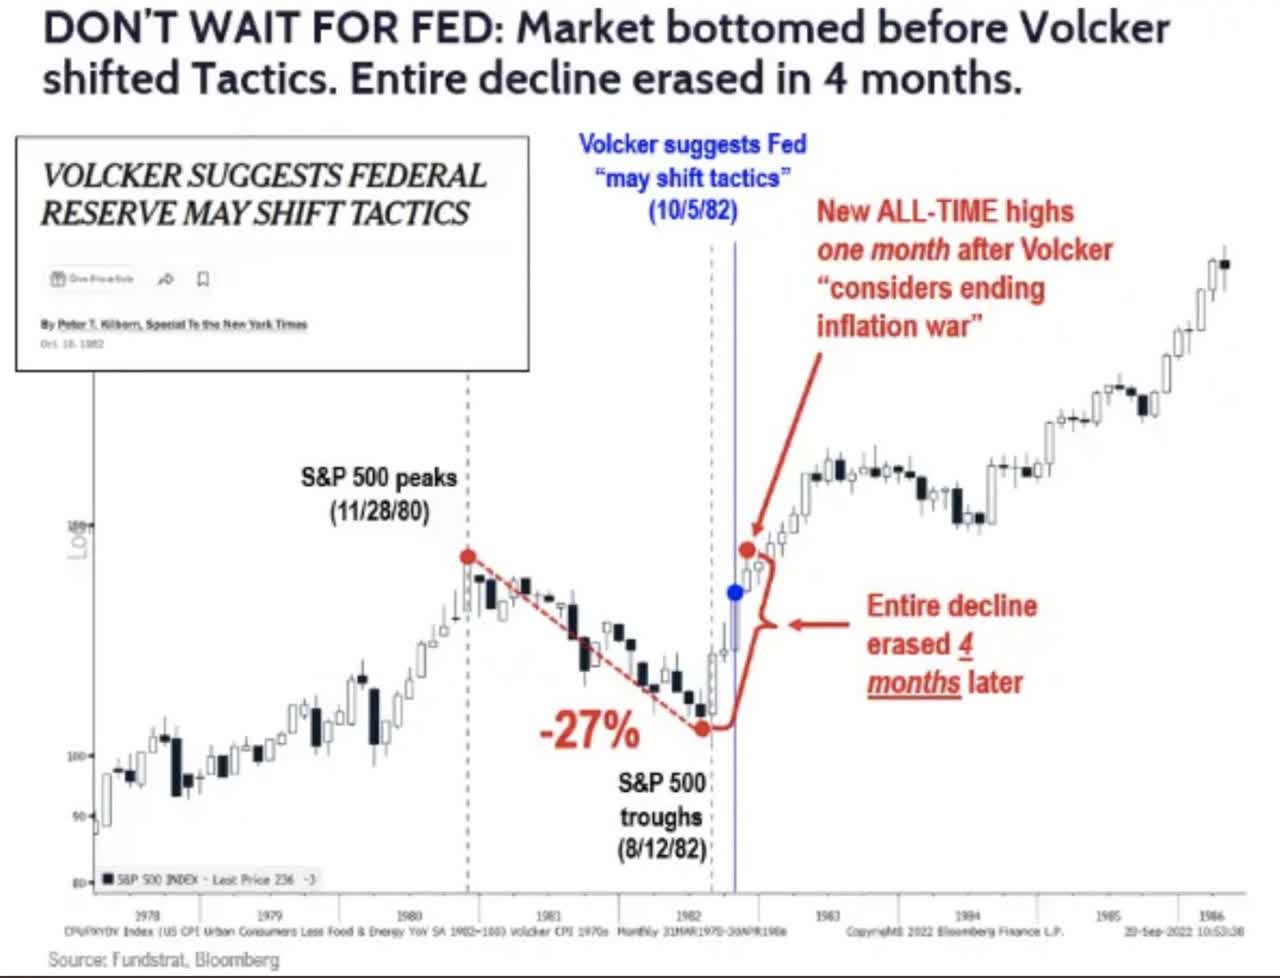
1982:
The S&P dropped 27% when Volker was tightening in 1981-1982. The market bottomed in August 1982 when inflation was still at 6.93%. On October 5, 1982 (while inflation was still 6.55%), Volker said he “may shift tactics.” The stock market recovered 100% of the losses within 4 months and went on to make new all-time highs the next year.
Stockcharts Fundstrate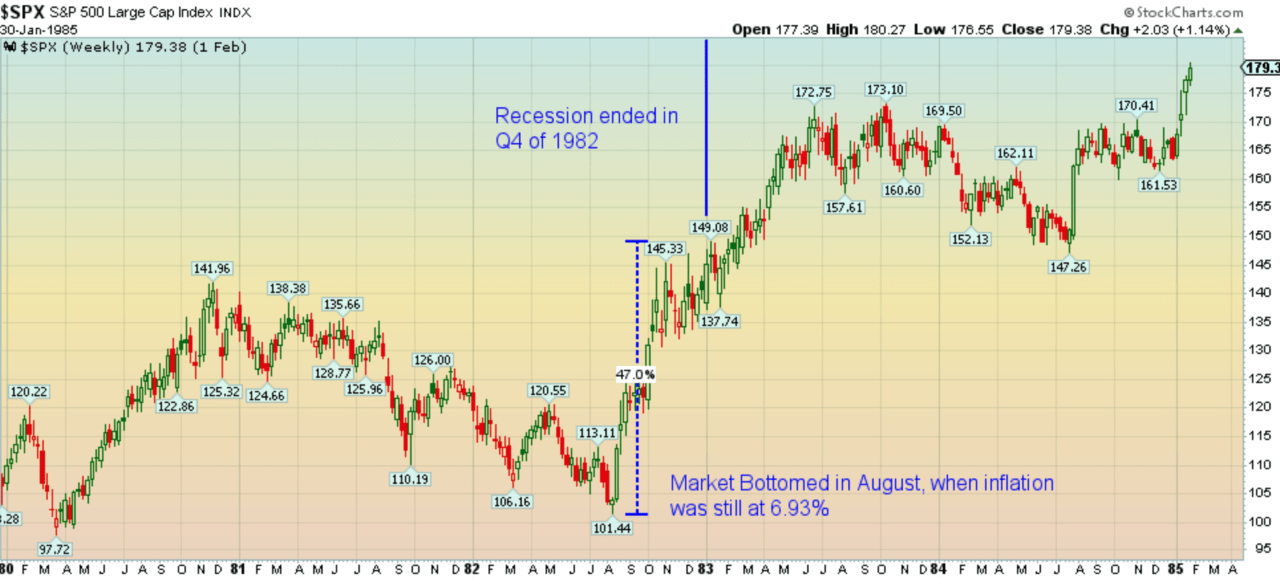
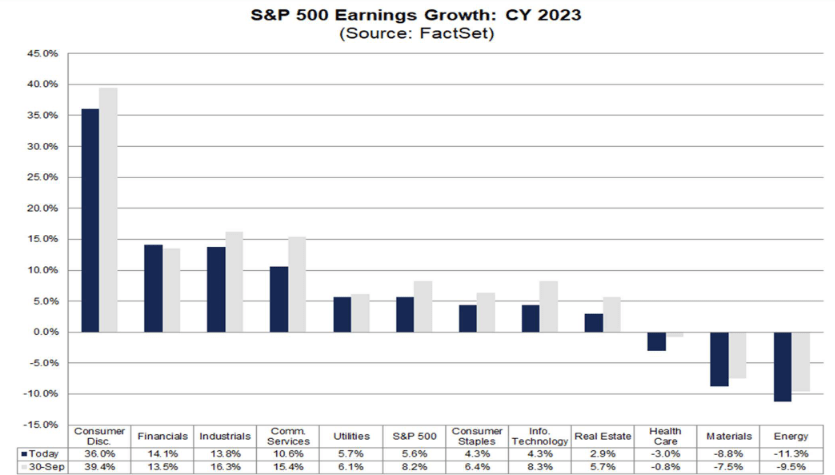
Earnings:
Grew 2.5% in Q3 v. 2.8% estimated. 2023 estimates have come down ~8% over the last 6 months (from $252 to $232).
Most analysts are calling for earnings to come down another 20% and are therefore bearish on the market. History shows the stock market bottoms well before earnings. In most cases the S&P 500 had recovered to new highs by the time earnings bottomed 6-12 months later: 1957, 1974, 1982, 1990, 2009, 2020.
Bloomberg Factset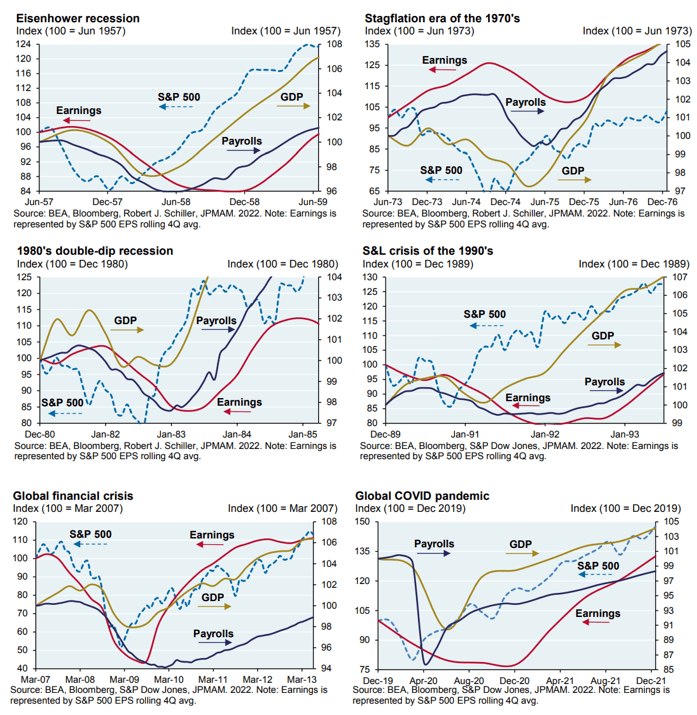
Recession Fears:
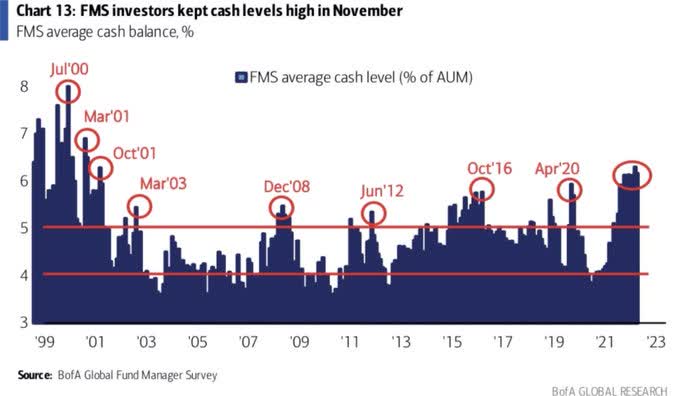
Managers are as scared of a recession today as they were in April 2020 and March 2009. While they were right to be scared, they were wrong to be in record cash as the stock market bottomed before the recession was declared (March 2009 bottom, March 2020 bottom):
BofA Stockcharts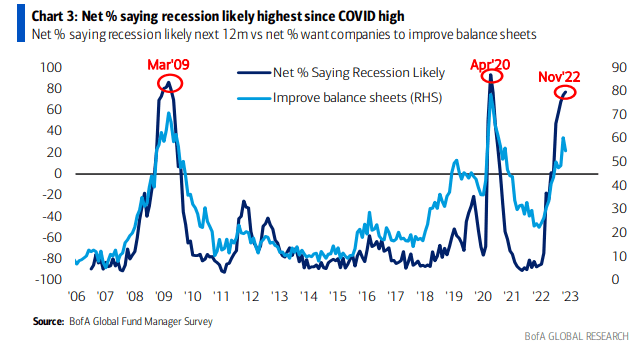
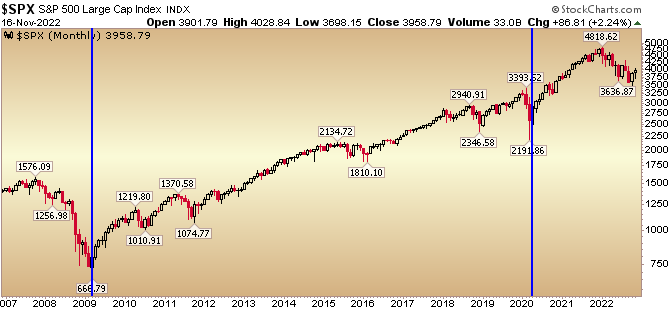
Those calling for a recession may be right, but with a 25% peak to trough move in the S&P much of the pain (to equity prices) may be priced in already. The market is a discounting mechanism and just as it crashed before the economic pain (earnings deterioration), it will rise well ahead of the economic recovery. In other words, the stock market can go up even as the Fed achieves its goal of putting people out of work.
Get ahead of it:
As Warren Buffett says, “if you wait for the robins to sing, it’s already Spring (and you missed it).” So while managers are still sucking their thumbs sitting in cash, know that the “Pain Trade” is up, not down (despite any short term noise).
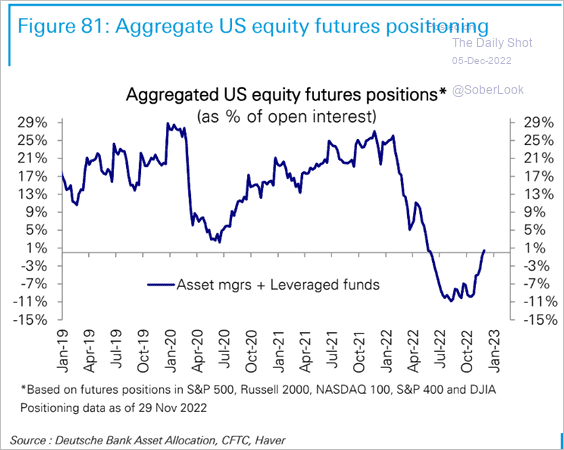
No one is positioned for any possible good news and the bad news is already known
BofA BofA Deutsche Bank Daily Shot
Tech:
Managers are the most underweight Tech since 2008:
BofA Sentiment Trader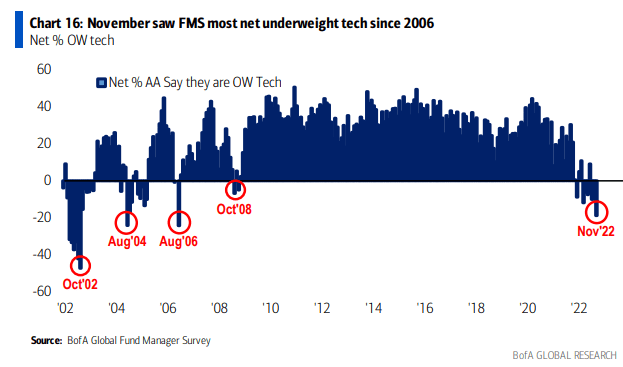
If you were buying high quality tech the last four times managers were this underweight (2008, 2006, 2004, 2002), you made money (see blue lines to the month) below:
Stockcharts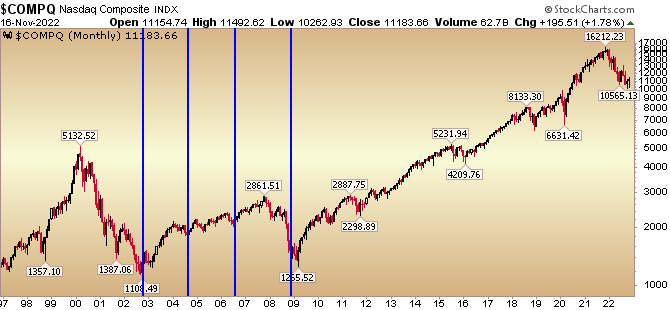
We added select tech/semis in decent size for client portfolios in October. It seems Warren Buffett had similar thinking with his recent $4B purchase of Taiwan Semi (TSM) (21% 5yr EPS growth rate – trading at 13.5x next year’s earnings). While most investors were convinced China would attack Taiwan imminently, Buffett swooped in to be “greedy when others were fearful.”
Some “No Brainers”:
- Amazon (AMZN): Down ~55%
- Disney (DIS): Down ~55%
- Meta (META): Down ~70%
- (KWEB)/(BABA)/China: Down 70%
Bloomberg Hedline FT Headline
AMZN is back at 2018 levels despite:
- AWS rev 2022 3x – +$80B (up from $25.7B in 2018)
- Ad rev 2022 3x -+$35B (up from $10B in 2018)
- E-commerce revenue doubled from 2018
- Prime members 163.5M (up from 100M in 2018)
Stockcharts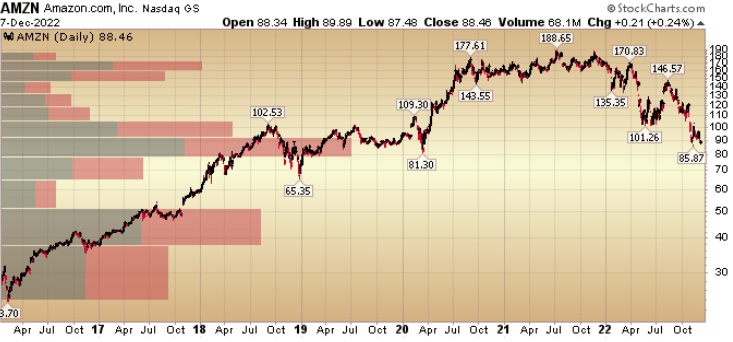
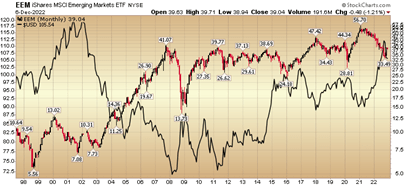
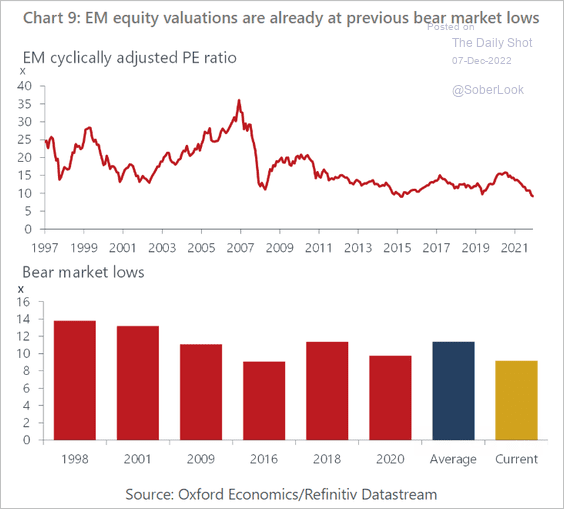
Emerging Markets:
Emerging Markets (EEM) are now trading at 2007 prices. Historically they trade opposite the $USD. When the dollar is strong (black line below) – as it has been rising since Spring of last year – Emerging Markets have sold off ~40%. When the Dollar stops going up as it did in 2002, 2009, 2016, 2020, you will see a monster rally in EEM – just as we saw:
- +480% from 2002-2007
- +189% from 2009-2011
- +96% from 2016-2018
- +97% from 2020-2021
Charlie Bilelllo Stockcharts Oxford Economics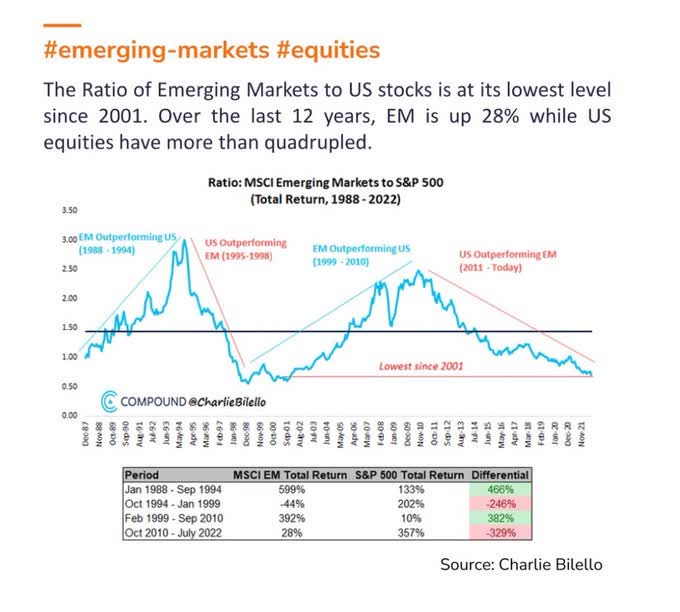
Now onto the shorter term view for the General Market:
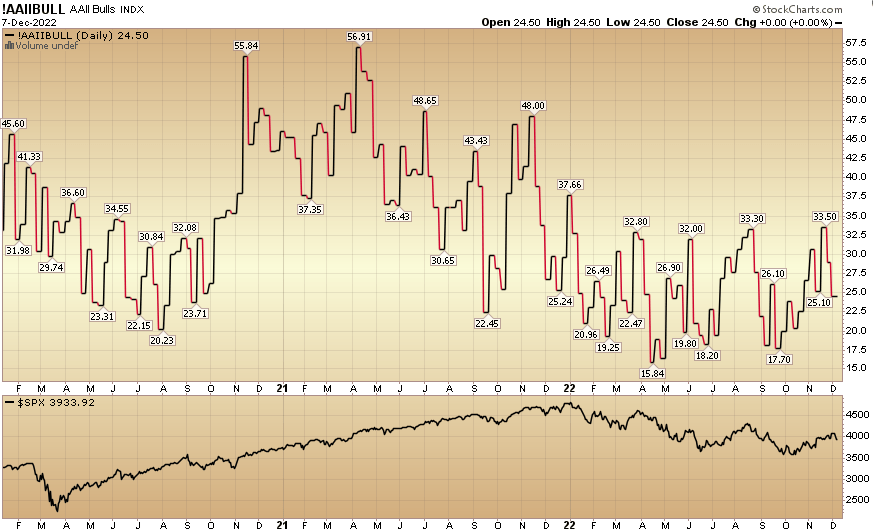
In this week’s AAII Sentiment Survey result, Bullish Percent flat-lined to 24.7% from 24.5% the previous week. Bearish Percent ticked up to 41.8% from 40.4%. Sentiment is still despondent for retail traders/investors.
AAII Sentiment Stockcharts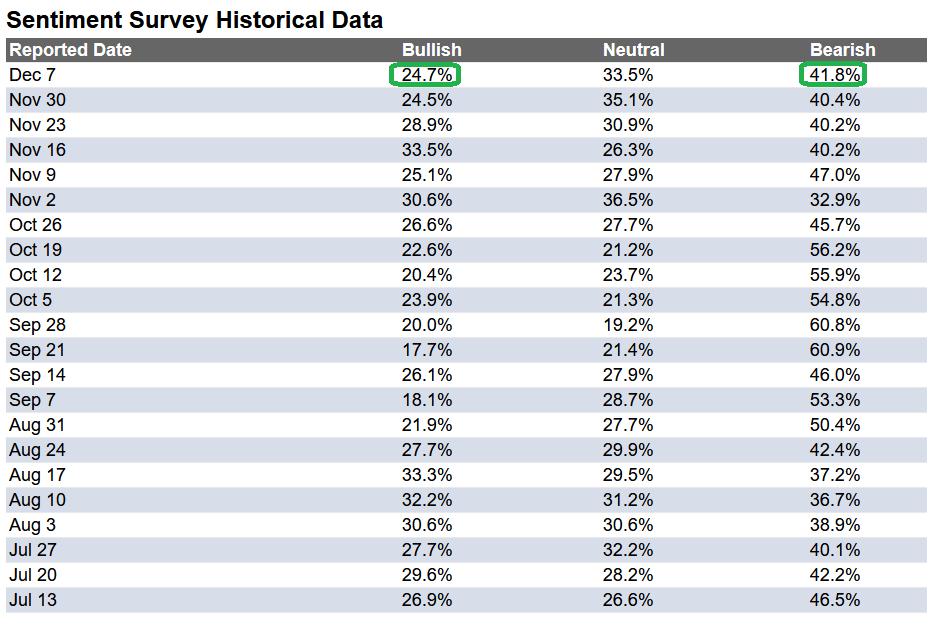
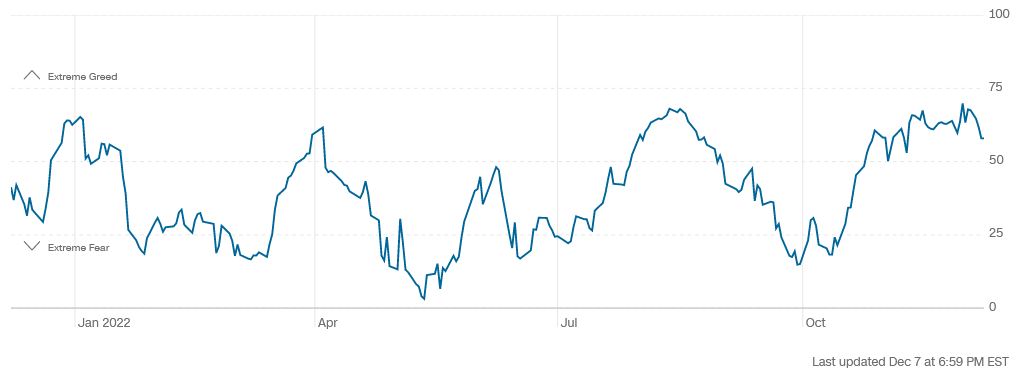
The CNN “Fear and Greed” moved down from 70 last week to 58 this week. Sentiment is accelerating.
CNN CNN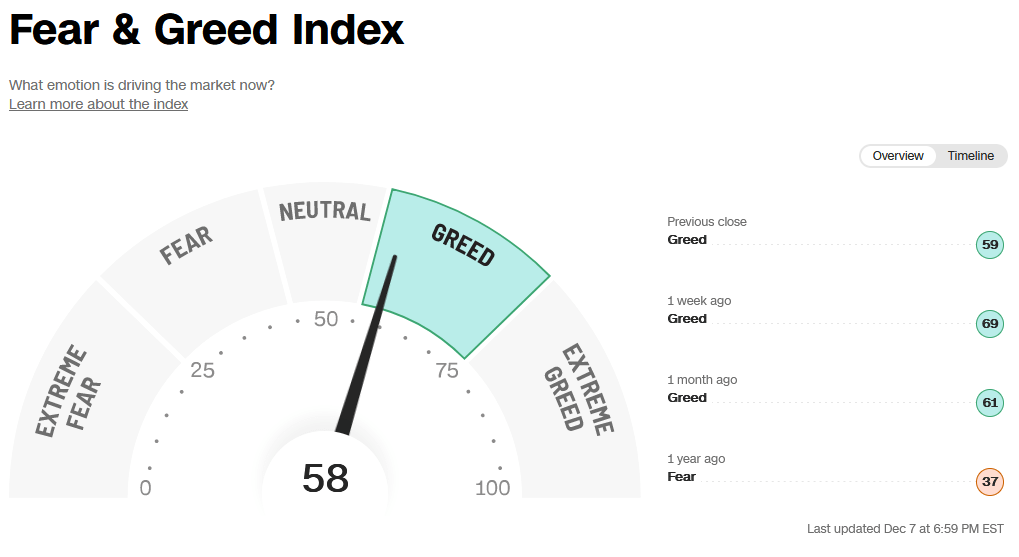
And finally, the NAAIM (National Association of Active Investment Managers Index) moved up to 64.36% this week from 60.29% equity exposure last week.
Stockcharts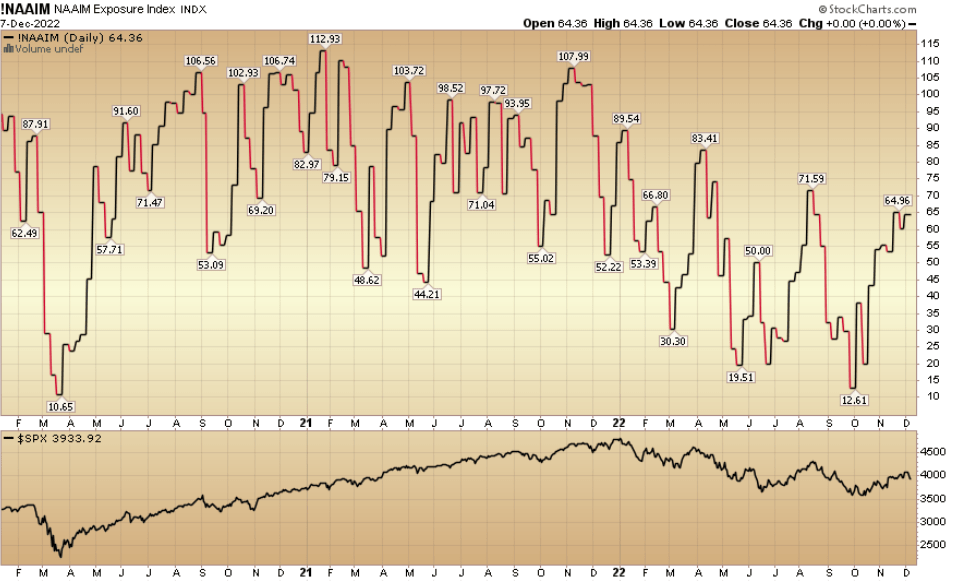
Author and/or clients may have beneficial holdings in any or all investments mentioned above.
Be the first to comment