

R&A Studio
A version of this article was published on Dividend Kings on Tuesday, November 29th.
——————————————————————————
Do you know what I love? Safe ultra-yield blue-chips.
During bear markets like this one, the yields you can lock in can change your life, save your family, or even change the world.
But do you know what’s even better than ultra-yield blue-chips in a bear market? Ultra-yield anti-bubble world-beater aristocrats with strong medium-term return catalysts.
These create what Warren Buffett calls “fat pitches,” blue-chip opportunities that can deliver incredible medium to long-term returns from slapping you in the face obvious opportunities.
Wait for a fat pitch and then swing for the fences.” – Warren Buffett
That’s what 6.5% yielding British American Tobacco p.l.c. (NYSE:BTI) represents today, and I wanted to share with you why its future potential 35% dividend hike makes it one of the best ultra-yield anti-bubble blue-chip bargains on Wall Street today.
One that could help you lock in a 12.3% yield on cost in a few years.
Let’s take a look at the three reasons why you might want to buy BTI today, before everyone else does.
Reason One: British American Is A Life-Changing High-Yield Aristocrat Opportunity
Ycharts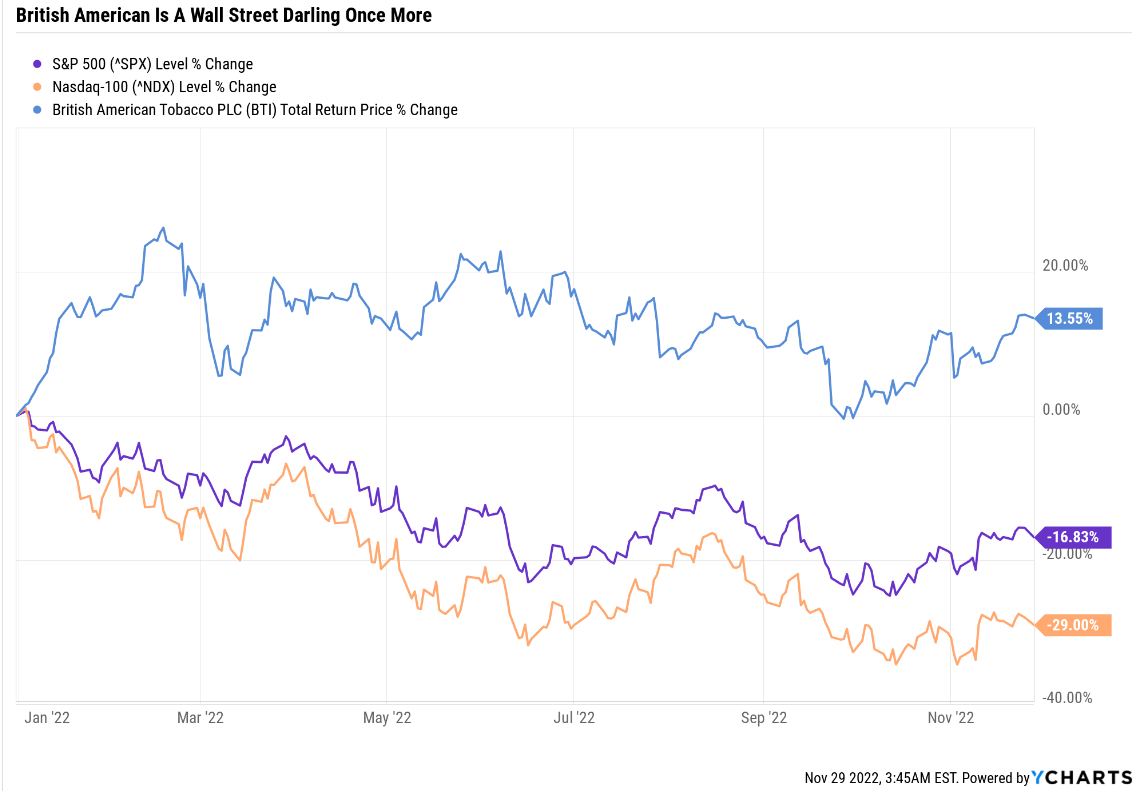
You might think that my enthusiasm for BTI might be due to how well it’s doing this year. While BTI longs certainly appreciates the growth to value rotation, that’s not why I’m recommending BTI today.
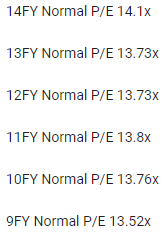
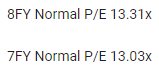
The Best P/E In 20 Years
FAST Graphs, FactSet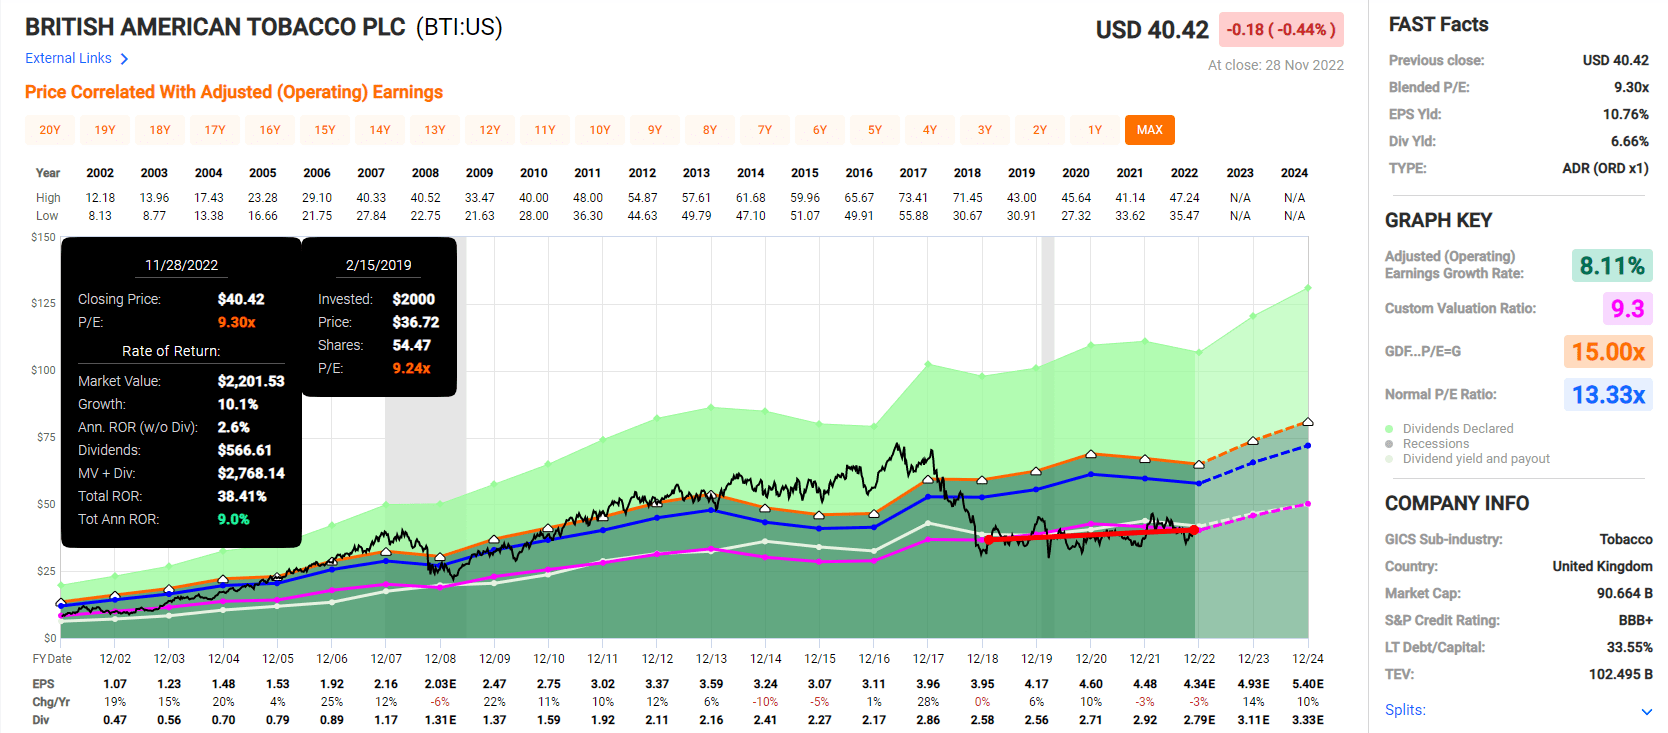
You might think it’s because BTI continues to trade at its lowest P/E in 20 years, which has been the approximate P/E during this multi-year bear market.
- during this time, investors have made 9% annual returns despite the 2nd worst bear market in BTI’s history.
While that’s certainly the reason I continued to recommend BTI for so many years, it’s not why I’m recommending it today.
(Source: earnings presentation)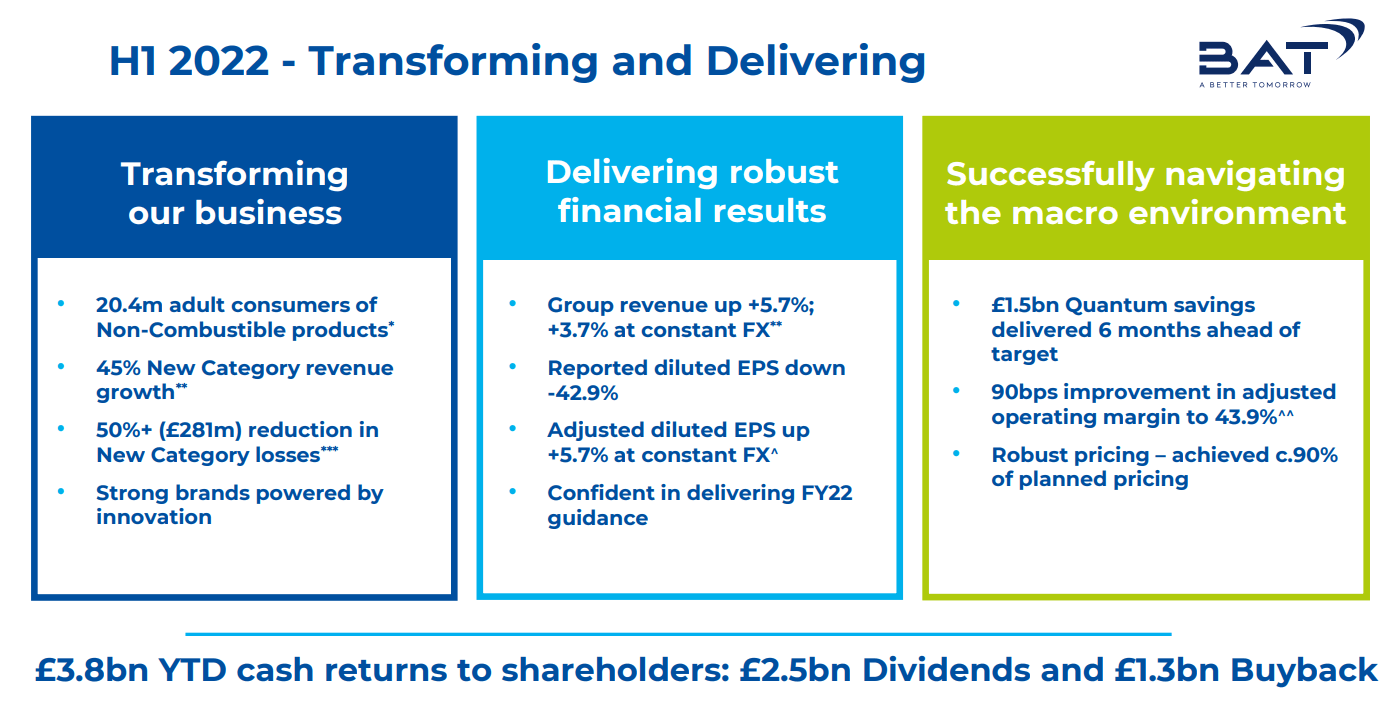
How about BTI’s 45% growth in reduced-risk or RRP products?
(Source: earnings presentation)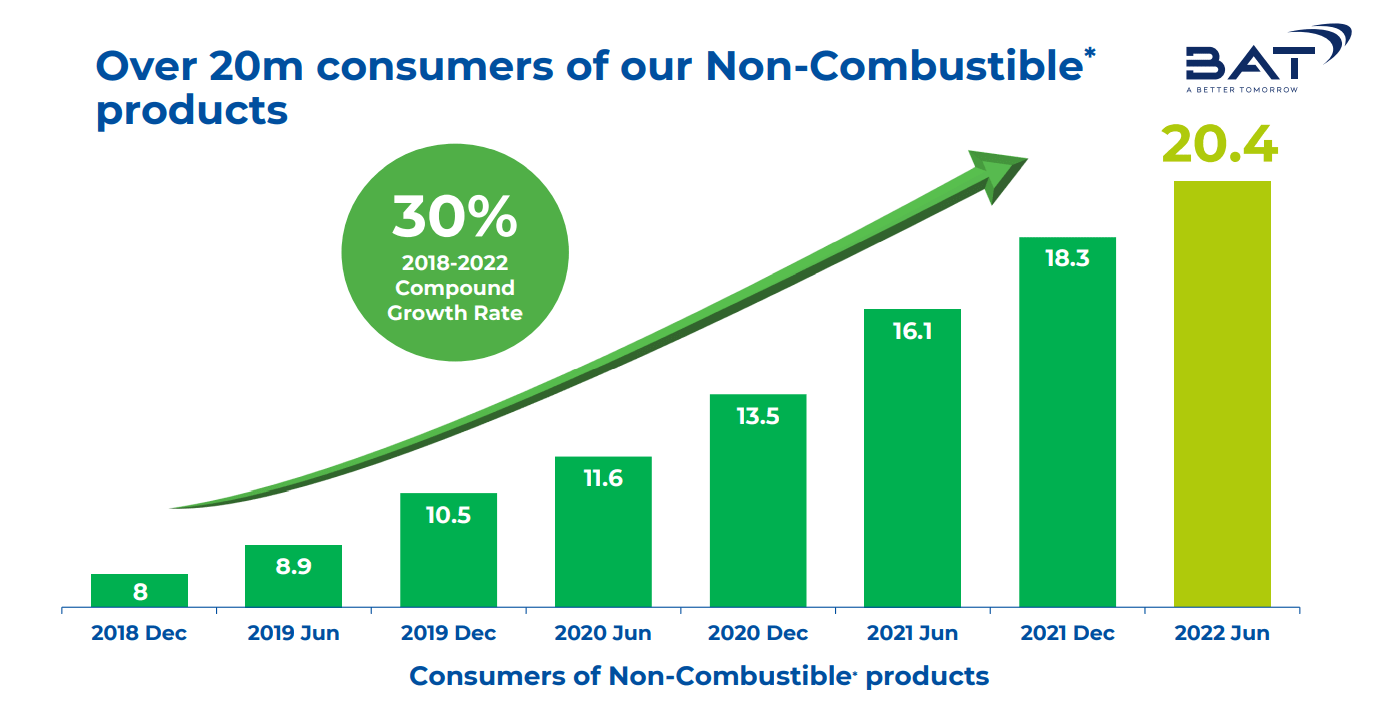
Or the fact that BTI now has more RRP users than Philip Morris, making it the world leader in RRPs as measured by users?
BTI was expected to generate about 7.5% of sales from RRPs by 2025 at the start of 2022.
(Source: earnings presentation)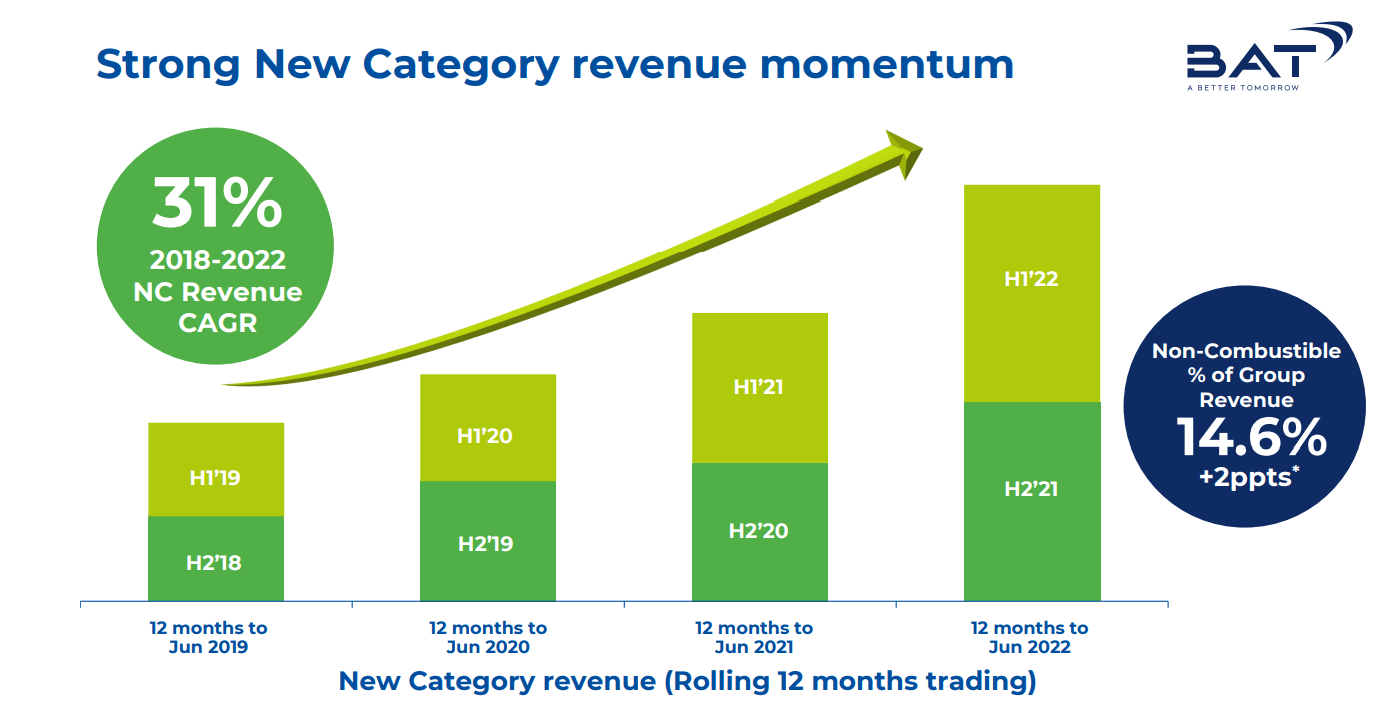
In the first half of 2022 RRP sales reached almost 15% of revenue.
- 2X the analyst 2025 forecast…three years early.
BTI’s exceptional execution of its smoke-free plans does not actually put it ahead of PMI in terms of the post-tobacco transition.
- BTI still isn’t making money on RRPs and PM’s iQOS has higher gross margins than traditional cigarettes
- PM plans to be over 50% of sales from RRPs by 2025.
Where it counts, BTI is still #2 in RRPs but gaining fast.
- RRP sales are growing at 2X the rate of PM.
As we’ll talk about in the growth section, BTI’s growth consensus of 10.4% CAGR long-term growth is the highest it’s been in 20 years.
- while the P/E is the lowest it’s been in 20 years.
The last time BTI’s valuation and growth were so mismatched, investors earned Buffett-like returns for the next 17 years.
Rolling Returns Since 1985
Portfolio Visualizer 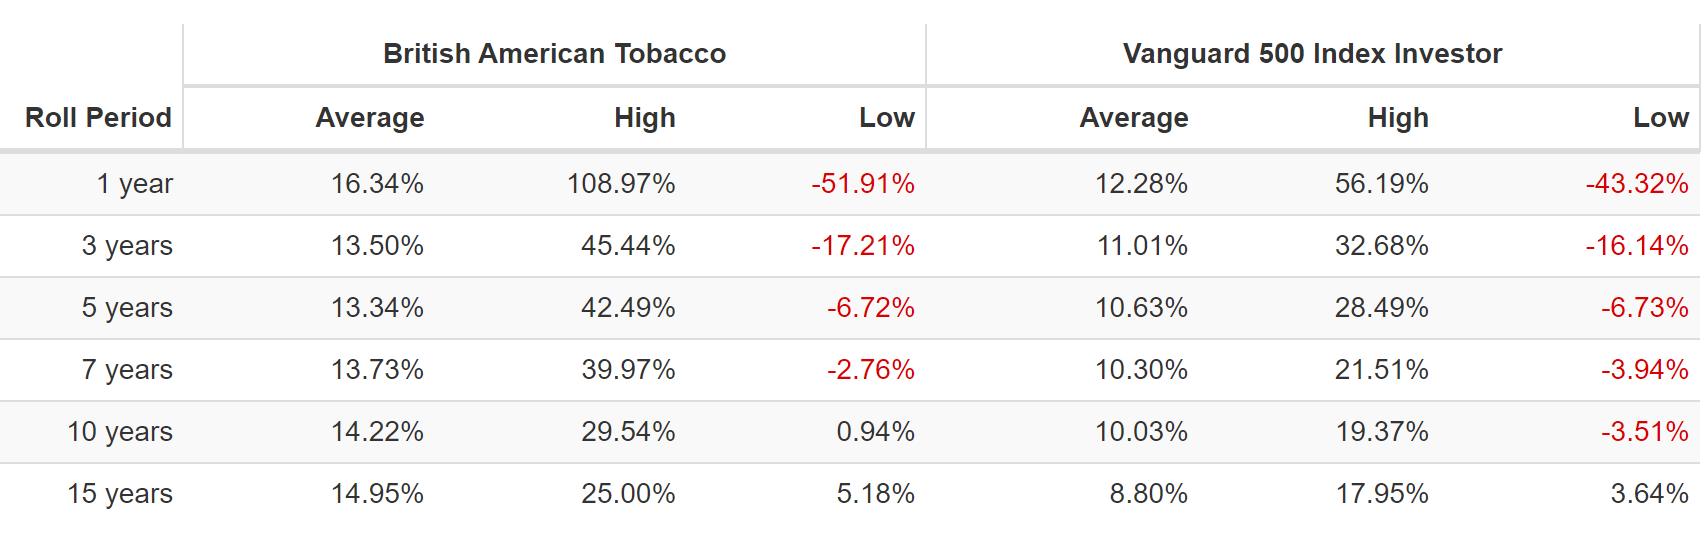
From its 2000 lows (the value bear market + Tobacco Master Settlement), BTI delivered 30X returns over the next 17 years.
- from 50% historically undervalued to 50% historically overvalued
However, there are two concepts we can hold to with confidence: • Rule number one: most things will prove to be cyclical. Rule number two: some of the greatest opportunities for gain and loss come when other people forget rule number one.” – Howard Marks (emphasis original)
BTI has been a coiled spring for several years. And smart long-term income investors who are comfortable with the risk profile have earned solid 9% annual returns by buying it at the same bargain-basement valuation for several years.
While many investors have been frustrated by BTI’s bear market, as Howard Marks would say, this bear market has been a gift.
The Right And Wrong Way To Think About Long Bear Markets
As long as a company’s fundamentals are intact and sales, earnings, cash flows, and dividends grow, it’s never a value trap.
Let me give you an example to show you why.
Consider two companies, A and B.
Both start out 35% undervalued, just as BTI is today.
- you can buy $1 in assets for $0.65
- a 54% gain if it returns to fair value
- a 9% annual valuation boost from valuation alone over 5 years.
Imagine this company, like BTI, yields a very safe 6.5% and is growing at 10.4%.
- 6.5% yield+ 10.4% growth = 16.9% CAGR long-term return potential
- even if the PE never recovers to historical levels.
But if it does return to long-term historical market-determined fair value (13 to 14 PE for BTI), then over 5 years, the return potential is:
- 6.5% yield + 10.4% growth + 9.0% valuation boost = 25.9% CAGR
- BTI’s best 5-year return was 43% CAGR for five years = 6X.
Now imagine two scenarios.
In the first, company A returns to fair value in year one.
- resulting in a 73% gain within 12 months.
It then trades at historical fair value the rest of the time, earning investors close to 17% annual total returns.
In scenario two, company B has traded at the same bear market valuation as BTI now for four years.
As BTI investors have done, investors earn good returns, but it doesn’t return to fair value until year five.
- both companies, A and B, have the same five-year return of 26% per year.
Which is the better scenario for long-term investors looking to maximize retirement income?
- one year of glorious returns and then great returns?
- four years of good returns and then one year of spectacular returns?
In scenario two, you can spend 4 years buying this world-beater ultra-yield blue-chip and reinvesting the dividends.
For four years, you can verify that management’s long-term growth plans are working.
- BTI’s fundamental risk is getting smaller every year as its RRP sales soar
In scenario one, you feel like a stock market genius right away.
In scenario two, you feel like an even bigger stock market genius in year five.
- because you own 5X as much of the shares
The longer the bear market, the more money and income you’ll ultimately make, all else being equal.
Now, do you see why I’m 100% focused on BTI’s fundamentals, not its price?
- growth outlook is the best in 20 years
- management is delivering on the expected growth
- smoke-free future plan is going much better than analysts were expecting just months ago
- valuation is still the best in 20 years.
And if all this wasn’t enough, now we have another potential profit catalyst for long-term BTI investors to profit from.
Why BTI’s Dividend Is Set To Potentially Soar 35%
BTI’s dividend growth streak is at least 22 years.
- in local currency every year since at least 2000
It’s a global aristocrat by S&P standards.
But because it pays dividends in Pounds, the U.S. dividend is variable over time.
- over the long-term currency effects cancel out.
Due to Brexit, the current recession, and the UK’s silly “mini-budget” fiasco, the pound hit a record low against the dollar this year.
The chaos caused Liz Truss to be the shortest acting Prime Minister in UK history (42 days).
- 30 year UK Treasuries (Gilts) fell 50% in two days
- a “risk free asset” that became 5X more volatile than Bitcoin.
The Pound has now recovered to 1.2 dollars/pound.
FactSet Research Terminal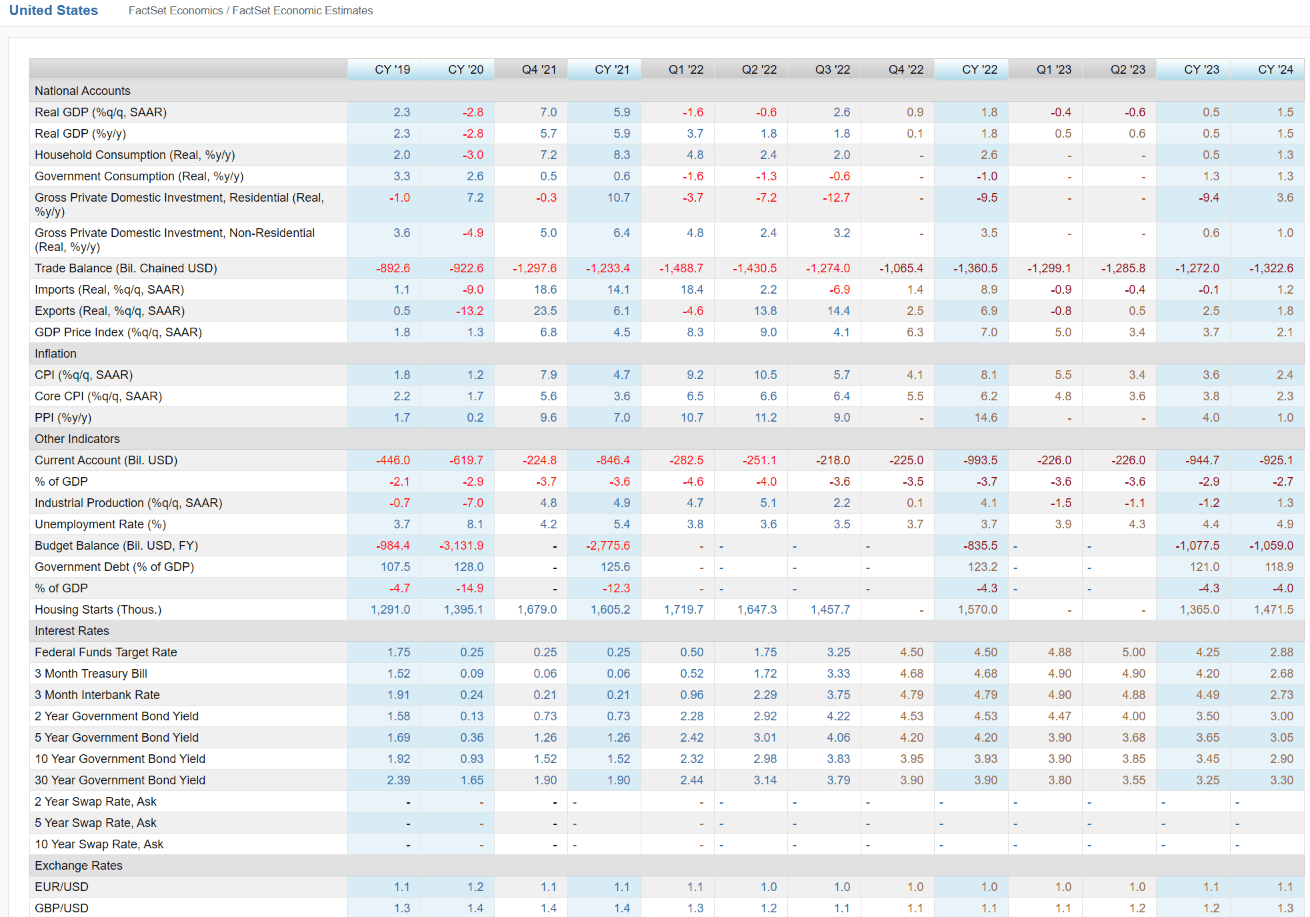
The blue-chip consensus is that the Pound will eventually recover to its post-Brexit/pre-crisis average of about 1.43.
By 2024 economists, expect the pound to recover to 1.3.
Here’s BTI’s consensus dividend in British Pounds.
- 2022: 2.30
- 2023: 2.51
- 2024: 2.70 *1.3 = $3.51 = 8.8% yield on today’s cost
- by 2024, the FactSet consensus thinks BTI’s dividend could soar by 35%
- by 2025, if the Pound returns to 1.4, BTI’s dividend could be 46% larger
- a yield on today’s cost of 9.5%
- for a company growing at double-digits
- and whose business model is becoming steadily less risky with every passing year.
Now, do you see why I’m so bullish on BTI? Why it’s my favorite ultra-yield, Ultra SWAN aristocrat?
BTI’s big rally in 2022 could be the beginning of a 10 to 20-year bull market that could make income investors rich.
- in five years, you could feel like a stock market genius
- in 10 years, you could be retired in comfort
- in 15 to 20 years, you could be retired in safety and splendor.
But you don’t have to wait years or decades to make good money with BTI.
BTI 2024 Consensus Total Return Potential
(Source: FAST Graphs, FactSet)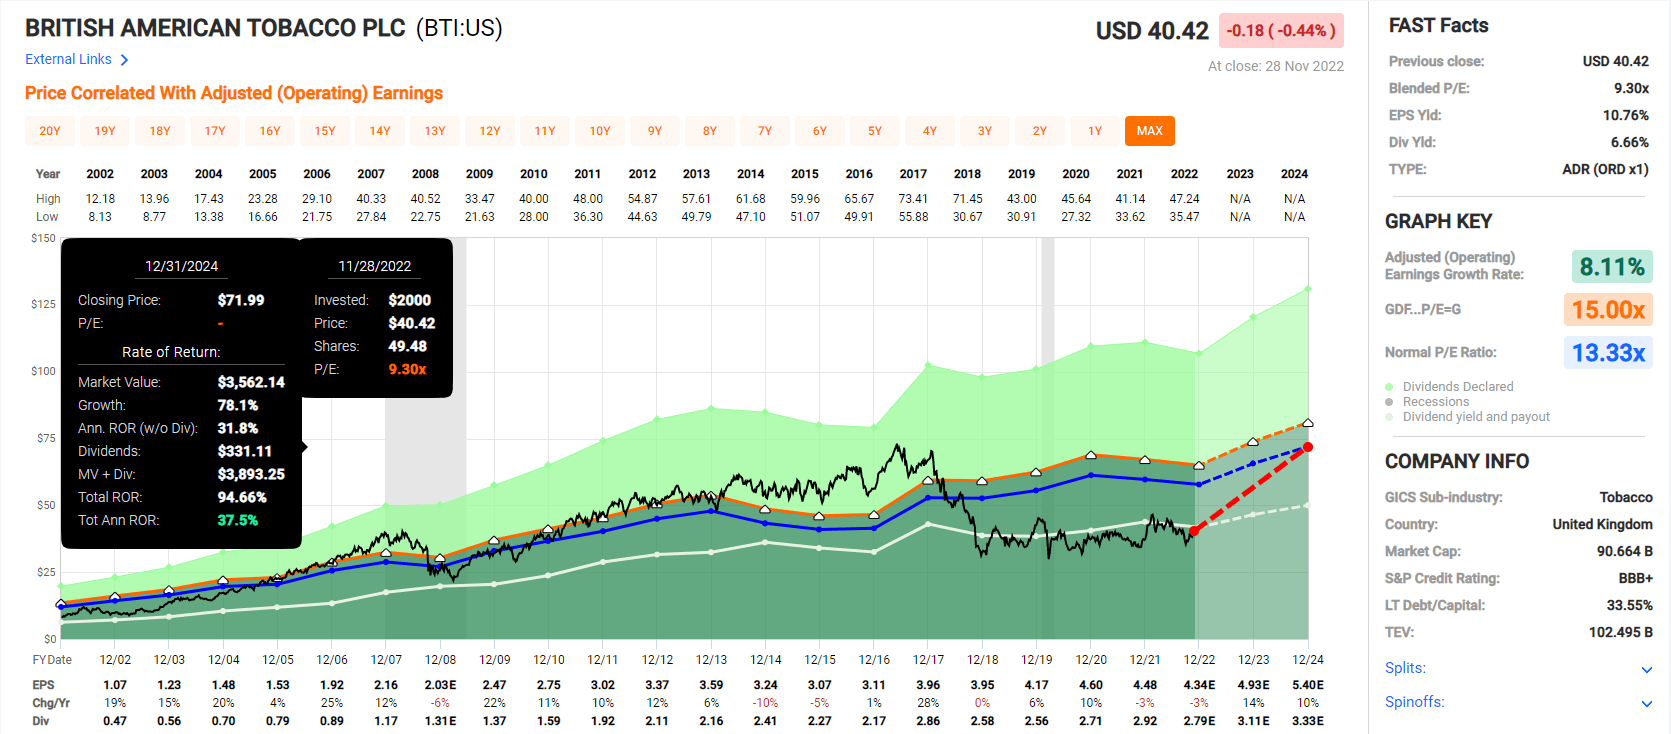
If BTI grows as expected and returns to historical mid-range fair value by 2024, it could double in two years.
- a Buffett-like 38% annual return potential for an anti-bubble blue-chip bargain hiding in plain sight
- 4X more than the S&P 500 consensus.
BTI 2028 Consensus Total Return Potential
(Source: FAST Graphs, FactSet)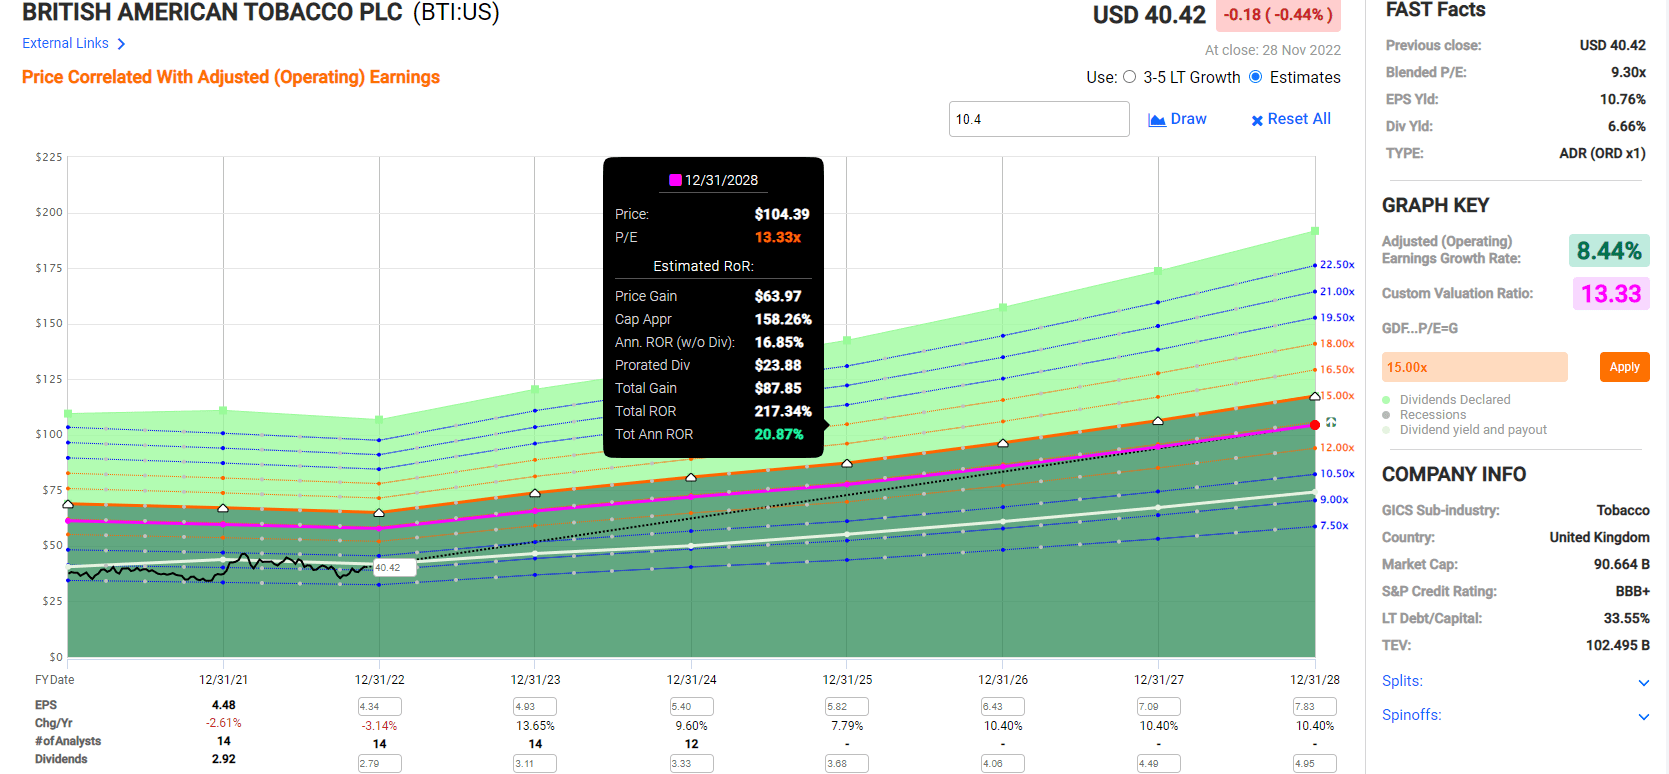
If BTI grows as expected and returns to historical fair value by 2028 it could more than triple delivering 21% annual returns.
- Buffett-like return potential
- 4X more than the S&P 500
- $4.95 consensus dividend = 12.3% yield on today’s cost.
BTI Investment Decision Tool
DK (Source: DK automated investment decision tool)
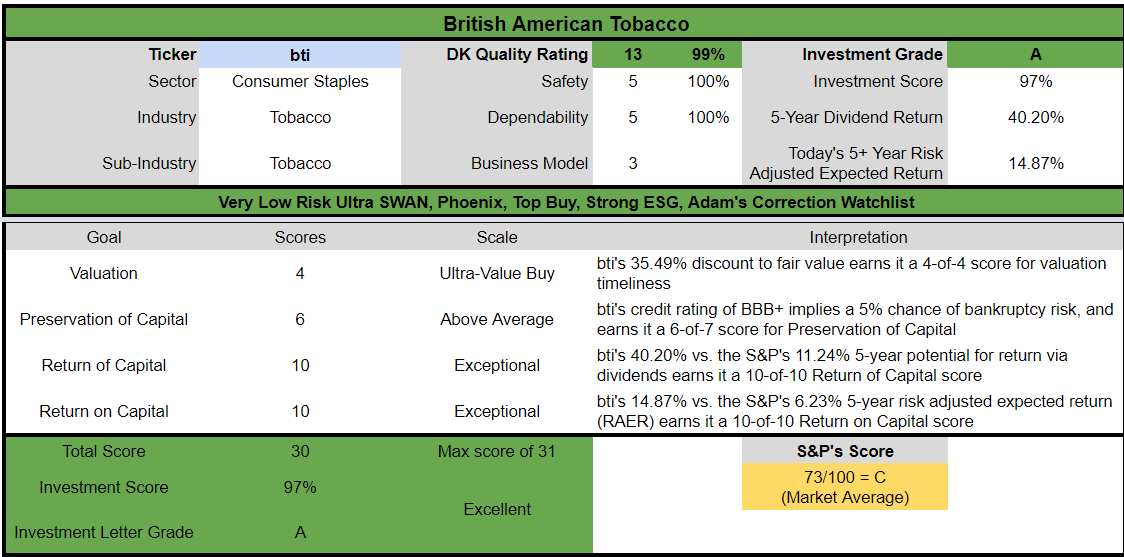
BTI is a potentially excellent and reasonable Ultra-Yield Ultra SWAN aristocrat opportunity for anyone comfortable with its risk profile. Look at how it compares to the S&P 500.
- 35% discount to fair value vs. 2% premium S&P = 37% better valuation
- 6.5% very safe yield vs. 1.7% (4X higher and much safer)
- approximately 17% long-term annual return potential vs. 10.2% CAGR S&P
- about 3X higher risk-adjusted expected returns
- 4X higher income potential over five years.
Reason Two: The Best Growth Outlook In 20 Years
BTI trades at 8.4X forward earnings and 8.4X cash-adjusted earnings.
That means it’s an anti-bubble blue-chip priced for -0.2% CAGR long-term growth.
Here are the growth analysts actually expect.
| Metric | 2021 Growth | 2022 Growth Consensus | 2023 Growth Consensus (Recession Year) | 2024 Growth Consensus |
2025 Growth Consensus |
| Sales | 7% | -4% (Currency Effects) | 9% | 4% | 8% |
| Dividend | 3% | 6% | 9% | 8% | 1% |
| EPS | -3% | -3% (Currency Effects) | 14% | 10% | 10% |
| Operating Cash Flow | 9% | 10% | 21% | 8% | 4% |
| Free Cash Flow | -2% | -4% | 20% | 4% | NA |
| EBITDA | 6% | -5% | 10% | 5% | NA |
| EBIT (operating income) | 4% | -3% | 9% | 8% | NA |
(Source: FAST Graphs, FactSet)
Does this look like a dying company to you? Does it look like a value trap?
Long-Term Growth Outlook
FactSet Research Terminal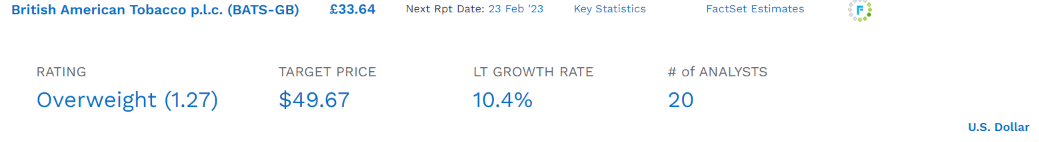
The median long-term growth consensus from all 20 analysts covering BTI is 10.4% CAGR.
- management guidance is 7% to 9% CAGR
- 20-year EPS growth rate: 8.4% CAGR.
How accurate are analyst forecasts (based on management guidance)?
FAST Graphs, FactSet 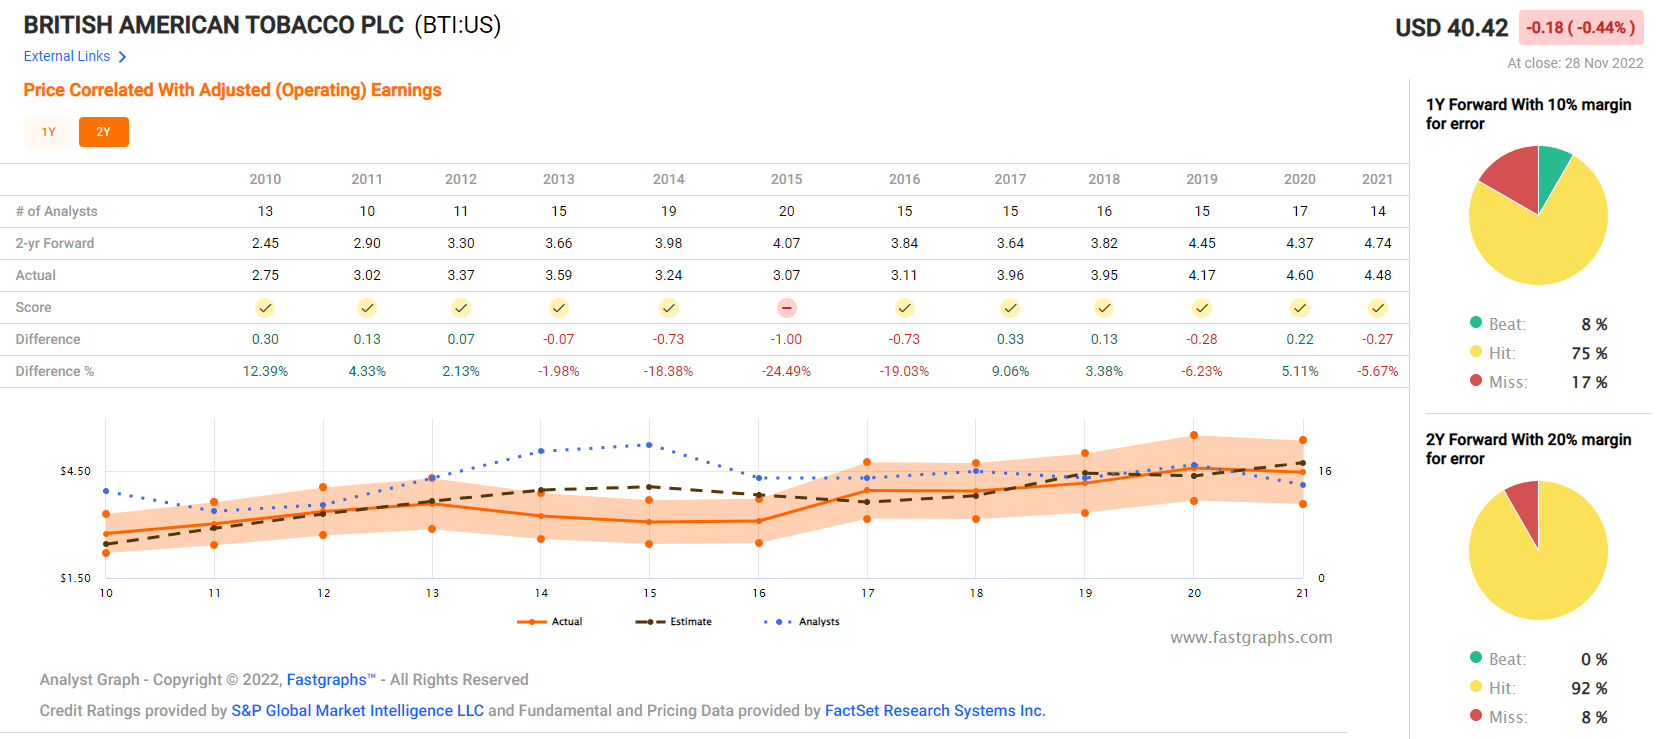
Smoothing for outliers, historical analyst margins of error are 20% to the downside and 10% to the upside.
- historical margin-of-error adjusted growth consensus range 3% to 12% CAGR.
FAST Graphs, FactSet FAST Graphs, FactSet FAST Graphs, FactSet 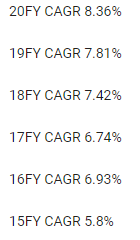
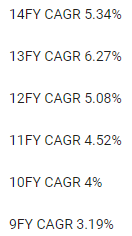
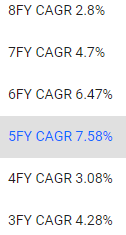
BTI’s historical growth rates range from 3% to 8%, and management says it can keep delivering that in the future on the back of strong RRP growth.
Long-Term Total Consensus Total Return Potential: Ignoring Valuation
| Investment Strategy | Yield | LT Consensus Growth | LT Consensus Total Return Potential | Long-Term Risk-Adjusted Expected Return | Long-Term Inflation And Risk-Adjusted Expected Returns | Years To Double Your Inflation & Risk-Adjusted Wealth |
10-Year Inflation And Risk-Adjusted Expected Return |
| British American (Analyst Consensus) | 6.5% | 10.4% | 16.9% | 11.8% | 9.5% | 7.6 | 2.48 |
| British American (Management Guidance) | 6.5% | 8.0% | 14.5% | 10.2% | 7.8% | 9.2 | 2.12 |
| REITs | 3.9% | 6.1% | 10.0% | 7.0% | 4.7% | 15.4 | 1.58 |
| Schwab US Dividend Equity ETF | 3.5% | 8.5% | 12.0% | 8.4% | 6.0% | 11.9 | 1.80 |
| Dividend Aristocrats | 2.6% | 8.5% | 11.1% | 7.8% | 5.4% | 13.2 | 1.70 |
| S&P 500 | 1.7% | 8.5% | 10.2% | 7.1% | 4.8% | 15.0 | 1.60 |
| Nasdaq | 0.8% | 11.8% | 12.6% | 8.8% | 6.5% | 11.0 | 1.88 |
(Sources: DK Research Terminal, FactSet, Morningstar, Ycharts)
Analysts think that BTI can deliver close to 17% long-term returns and management guidance is for 14% to 15%.
- on par with the greatest investors in history
- far better than the S&P, aristocrats, REITs, SCHD, or even the Nasdaq.
Inflation-Adjusted Consensus Return Potential (Ignoring Valuation): $1,000 Initial Investment
| Time Frame (Years) | 8.0% CAGR Inflation-Adjusted S&P 500 Consensus | 8.8% Inflation-Adjusted Aristocrat Consensus | 12.2% CAGR Inflation-Adjusted BTI Management Guidance | Difference Between Inflation-Adjusted BTI Management Guidance And S&P Consensus |
| 5 | $1,468.65 | $1,526.66 | $1,775.76 | $307.11 |
| 10 | $2,156.93 | $2,330.70 | $3,153.31 | $996.39 |
| 15 | $3,167.77 | $3,558.19 | $5,599.52 | $2,431.75 |
| 20 | $4,652.33 | $5,432.16 | $9,943.39 | $5,291.05 |
| 25 | $6,832.64 | $8,293.08 | $17,657.04 | $10,824.40 |
| 30 (Retirement time frame) | $10,034.74 | $12,660.73 | $31,354.62 | $21,319.88 |
| 35 | $14,737.50 | $19,328.67 | $55,678.20 | $40,940.70 |
| 40 | $21,644.21 | $29,508.37 | $98,870.97 | $77,226.76 |
| 45 | $31,787.72 | $45,049.33 | $175,570.84 | $143,783.12 |
| 50 | $46,684.97 | $68,775.14 | $311,771.20 | $265,086.23 |
| 55 | $68,563.78 | $104,996.45 | $553,629.97 | $485,066.19 |
| 60 (investing lifetime) | $100,696.06 | $160,294.18 | $983,112.44 | $882,416.38 |
| 100 (institutional time frame, multi-generational wealth, Perpetual charitable trust) | $2,179,486.17 | $4,730,019.35 | $97,201,280.76 | $95,021,794.59 |
(Source: DK Research Terminal, FactSet)
Using management’s guidance, which is for 12.2% long-term inflation-adjusted total returns, you can see how BTI offers potentially life-changing and even world-changing wealth creation.
Assuming the PE never improves from 8.4r, BTI is a potential 31X inflation-adjusted return over a retirement time frame and a potential nearly 1,000X bagger over an investing lifetime.
| Time Frame (Years) | Ratio Inflation-Adjusted BTI Management Guidance/Aristocrat Consensus | Ratio Inflation-Adjusted BTI Management Guidance vs. S&P consensus |
| 5 | 1.16 | 1.21 |
| 10 | 1.35 | 1.46 |
| 15 | 1.57 | 1.77 |
| 20 | 1.83 | 2.14 |
| 25 | 2.13 | 2.58 |
| 30 | 2.48 | 3.12 |
| 35 | 2.88 | 3.78 |
| 40 | 3.35 | 4.57 |
| 45 | 3.90 | 5.52 |
| 50 | 4.53 | 6.68 |
| 55 | 5.27 | 8.07 |
| 60 | 6.13 | 9.76 |
| 100 | 20.55 | 44.60 |
(Source: DK Research Terminal, FactSet)
Over the next 30 years, BTI could potentially triple the market’s returns (just as it’s done since 1985) and, over an investing lifetime, deliver about 10X better returns.
For my goals of a perpetual charitable trust that aims to eventually donate $1 trillion in inflation-adjusted wealth to eliminating poverty?
- Andrew Carnegie holds the record for the most charitable donations
- $438.5 billion adjusted for inflation
- the Charity Greatest of All Time (GOAT)
- I aim more than to double his record through my perpetual charitable trust.
BTI offers the chance to change the world.
- within a few decades BTI will be selling nothing but RRP nicotine and cannabis
- and killing less people each year than DEO, PEP or MCD
- so no moral issues from my perspective.
Reason Three: A Buffett-Style “Fat Pitch”
(Source: FAST Graphs, FactSet) (Source: FAST Graphs, FactSet) (Source: FAST Graphs, FactSet)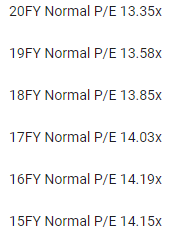
For 20 years hundreds of millions of income investors have consistently paid 13 to 14X earnings for BTI, outside of bubbles and bear markets.
- A 91% statistical probability that BTI is worth 13 to 14X earnings
| Metric | Historical Fair Value Multiples (all years) | 2021 | 2022 | 2023 | 2024 | 2025 |
12-Month Forward Fair Value |
| 13-year median yield | 4.17% | $70.50 | $62.67 | $62.67 | $72.42 | $78.90 | |
| 25-year Average Yield | 4.29% | $68.53 | $60.92 | $60.92 | $75.76 | $76.69 | |
| Earnings | 13.33 | $59.72 | $57.99 | $64.92 | $72.92 | $79.05 | |
| Average | $65.90 | $60.46 | $62.79 | $73.67 | $78.20 | $62.66 | |
| Current Price | $40.42 | ||||||
|
Discount To Fair Value |
38.67% | 33.15% | 35.63% | 45.13% | 48.31% | 35.49% | |
|
Upside To Fair Value ( Including Dividends) |
63.05% | 49.59% | 55.35% | 82.26% | 93.46% | 61.48% | |
| 2022 EPS | 2023 EPS | 2022 Weighted EPS | 2023 Weighted EPS | 12-Month Forward EPS | 12-Month Average Fair Value Forward P/E | Current Forward P/E |
Forward Cash-Adjusted PE |
| $4.35 | $4.87 | $0.25 | $4.59 | $4.84 | 12.9 | 8.4 | 8.4 |
I conservatively estimated BTI is historically worth about 13X earnings, the low end of its historical fair value range.
Today it trades at 8.4X earnings and 8.4X cash-adjusted earnings.
- as long as BTI grows faster than zero the dividend will always remain safe
- and it’s mathematically impossible for long-term investors to lose money
- as long as they avoid becoming forced sellers for emotional or financial reasons
| Rating | Margin Of Safety For Very Low Risk 13/13 Ultra SWAN Quality Companies | 2022 Fair Value Price | 2023 Fair Value Price |
12-Month Forward Fair Value |
| Potentially Reasonable Buy | 0% | $60.46 | $62.79 | $62.66 |
| Potentially Good Buy | 5% | $57.44 | $59.65 | $59.53 |
| Potentially Strong Buy | 15% | $51.39 | $53.37 | $53.26 |
| Potentially Very Strong Buy | 25% | $43.08 | $47.09 | $46.99 |
| Potentially Ultra-Value Buy | 35% | $39.30 | $40.82 | $40.73 |
| Currently | $40.42 | 33.15% | 35.63% | 35.49% |
| Upside To Fair Value (Including Dividends) | 56.04% | 61.81% | 61.48% |
For anyone comfortable with its risk profile, BTI is an anti-bubble, Buffett-style “fat pitch” Ultra Value buy.
Risk Profile: Why British American Isn’t Right For Everyone
There are no risk-free companies, and no company is right for everyone. You have to be comfortable with the fundamental risk profile.
BTI’s Risk Profile Includes
- regulatory risk (global and U.S.) – plain packaging laws, menthol ban, nicotine level regulation, RRP tax policies, RRP approvals
- smoke-free transition risk (PM is the industry leader)
- margin risk: RRP is currently unprofitable
- M&A execution risk (BTI tends to make occasional giant deals)
- labor retention risk (tightest job market in over 50 years)
- currency risk (including dividends)
- interest rate risk: rolling over debt at potentially much higher interest rates (could cause growth to come in lower than currently expected).
How about BTI’s transition risk in terms of timing? Does BTI have enough time to transition from tobacco to RRPs and cannabis fully?
The example of Australia gives some insight into how such a kink in the demand curve might occur. Since 2011, a series of Draconian anti-cigarette measures in Australia have led to the introduction of plain packs and tax increases that caused the doubling of the retail price of cigarettes in just six years, which in turn has led to the smoking rate falling from 16% to 13% over the same period, and to significant trading down between price segments. A pack of 20 cigarettes (equivalent; a standard pack contains 25 sticks in Australia) now costs roughly $26, well above the $17.80 retail price for a premium pack in the U.K., $6.50 in the U.S., and around $5.50 on average globally, according to the World Health Organization. Assuming the Australian experience is applicable to price elasticity in other markets, it appears a great deal of headroom remains for price increases globally. At 4% real pricing (based on 6% nominal price/mix and 2% global inflation), this crude calculation suggests that it will be 2051 before global pricing reaches levels at which price elasticity increased in Australia.” – Morningstar (emphasis added)
Morningstar estimates BTI has approximately 30 years left before its legacy business model begins to fail.
- easily enough time to move completely away from tobacco and to RRP nicotine and cannabis
- BTI owns stakes in 13 cannabis companies as part of its venture capital arm.
How do we quantify, monitor, and track such a complex risk profile? By doing what big institutions do.
Long-Term Risk Management Analysis: How Large Institutions Measure Total Risk Management
See the risk section of this video to get an in-depth view (and link to two reports) of how DK and big institutions measure long-term risk management by companies
DK uses S&P Global’s global long-term risk-management ratings for our risk rating.
- S&P has spent over 20 years perfecting their risk model
- which is based on over 30 major risk categories, over 130 subcategories, and 1,000 individual metrics
- 50% of metrics are industry specific
- this risk rating has been included in every credit rating for decades.
The DK risk rating is based on the global percentile of how a company’s risk management compares to 8,000 S&P-rated companies covering 90% of the world’s market cap.
BTI Scores 100th Percentile On Global Long-Term Risk Management
S&P’s risk management scores factor in things like:
- supply chain management
- crisis management
- cyber-security
- privacy protection
- efficiency
- R&D efficiency
- innovation management
- labor relations
- talent retention
- worker training/skills improvement
- occupational health & safety
- customer relationship management
- business ethics
- climate strategy adaptation
- sustainable agricultural practices
- corporate governance
- brand management
BTI’s Long-Term Risk Management Is Tied For The Best In The Master List (100th Percentile In The Master List)
| Classification | S&P LT Risk-Management Global Percentile |
Risk-Management Interpretation |
Risk-Management Rating |
| BTI, ILMN, SIEGY, SPGI, WM, CI, CSCO, WMB, SAP, CL | 100 | Exceptional (Top 80 companies in the world) | Very Low Risk |
| Strong ESG Stocks | 86 |
Very Good |
Very Low Risk |
| Foreign Dividend Stocks | 77 |
Good, Bordering On Very Good |
Low Risk |
| Ultra SWANs | 74 | Good | Low Risk |
| Dividend Aristocrats | 67 | Above-Average (Bordering On Good) | Low Risk |
| Low Volatility Stocks | 65 | Above-Average | Low Risk |
| Master List average | 61 | Above-Average | Low Risk |
| Dividend Kings | 60 | Above-Average | Low Risk |
| Hyper-Growth stocks | 59 | Average, Bordering On Above-Average | Medium Risk |
| Dividend Champions | 55 | Average | Medium Risk |
| Monthly Dividend Stocks | 41 | Average | Medium Risk |
(Source: DK Research Terminal)
BTI’s risk-management consensus is in the top 80 of all companies S&P rates.
The bottom line is that all companies have risks, and BTI is exceptional at managing theirs according to S&P.
How We Monitor BTI’s Risk Profile
- 20 analysts
- three credit rating agencies
- 23 experts who collectively know this business better than anyone other than management
- and the bond market for real-time fundamental risk-assessment.
When the facts change, I change my mind. What do you do, sir?” – John Maynard Keynes
There are no sacred cows at iREIT or Dividend Kings. Wherever the fundamentals lead, we always follow. That’s the essence of disciplined financial science, the math behind retiring rich and staying rich in retirement.
Bottom Line: Buy 6.5%-Yielding British American Before The Dividend Soars 35%
Let me be clear: I’m NOT calling the bottom in BTI (I’m not a market-timer).
Ultra SWAN quality does NOT mean “can’t fall hard and fast” in a bear market.”
Fundamentals are all that determine safety and quality, and my recommendations.
- over 30+ years, 97% of stock returns are a function of pure fundamentals, not luck
- in the short term; luck is 25X as powerful as fundamentals
- in the long term, fundamentals are 33X as powerful as luck.
While I can’t predict the market in the short term, here’s what I can tell you about BTI.
- One of the highest quality and safest ultra-yield blue chips on earth
- 18th highest quality company in the Master List, 97th percentile
- very safe 6.5% yield (4X the S&P yield and safer, growing 6% per year)
- 14% to 17% CAGR long-term total consensus/management guidance, better than the S&P, aristocrats, and the Nasdaq
- 35% historically undervalued, a potentially Ultra Value buy
- 8.4X earnings and cash-adjusted earnings = compared to historical 13 to 14X.
- 217% consensus return potential over the next six years, 21% CAGR, more than 4X better than the S&P 500
- 3X the risk-adjusted expected returns of the S&P 500 over the next five years
- 4X the income potential of the S&P over the next five years.
Can I guarantee that BTI will raise its dividend 35% by 2024? Of course not. That depends on it achieving its expected growth rate and the Pound recovering to 1.3.
However, what I can tell you is that BTI is a global aristocrat that’s been raising its annual dividend for decades through:
- four recessions
- six bear markets
- two economic crises
- inflation as high as 9.1%
- interest rates as high as 6.5%.
Given how well its smoke-free transition plans are going and how BTI keeps under promising and overdelivering, I’m more confident than ever in my favorite high-yield blue-chip recommendation.
There is no other company on Wall Street offering a very safe 6.5% yield growing at double-digits.
There is no other “fat pitch” trading at the best P/E in 20 years with the best growth prospects in 20 years.
The last time BTI was this undervalued, it delivered 30X returns over 17 years.
From 50% undervalued to 50% overvalued, with the same risk profile.
In 2000 it seemed insane to think that BTI would ever trade at 13X earnings again, much less 20X.
In 2017 it seemed insane to think it would fall back to 13X earnings.
And yet that’s what happened and has been happening with BTI for the last 120 years.
Blue-chip bear markets and bubbles can last a long time, much longer than most people realize.
But if you can recognize the difference between value traps and deep value opportunities, then you can truly achieve financial miracles.
Buying world-beaters like BTI when the market is ignoring fundamentally excellent fundamentals is exactly how you can achieve Buffett-like returns from blue-chip bargains hiding in plain sight.
It’s how you can take charge of your financial destiny and retire in safety and splendor, no matter what the economy or stock market throws at us in the coming decades.
Be the first to comment