

Michael Buckner
Foreword
Dan Burrows says in Kiplinger Investing:
The Berkshire Hathaway portfolio is a diverse set of blue chips and, increasingly, lesser-known growth bets. Here’s a look at every stock picked by Warren Buffett and his lieutenants.
Any collection of stocks is more clearly understood when subjected to yield-based (dog catcher) analysis, this Buffett/Berkshire batch is perfect for the dogcatcher process. Here is the November 22 data for 33 dividend paying stocks in the Kiplinger-documented collection of 49 owned by Buffett through his Berkshire-Hathaway firm as of 11/15/22.
Another resource consulted for this article was dogsofthedow.com which also keeps an ongoing spreadsheet of the Buffett/Berkshire stocks updated quarterly per BRK SEC filings, the next of which reports in February.
A rapid market recovery after the Ides of March 2020 plunge made the possibility of owning productive dividend shares reflecting this collection less viable for first-time investors.
This November 2022 update shows that the following four top dogs of Berkshire stocks now live up to the dogcatcher ideal of paying annual dividends (from a $1K investment) exceeding its single share prices: Paramount Global (PARA); Ally Financial Inc. (ALLY); The Kraft Heinz Co. (KHC); HP Inc. (HPQ).
Four more are within $7.00 or 15% of the ideal: U.S. Bancorp (USB); Citigroup Inc. (C); Jefferies Financial Group (JEF); Bank of New York Mellon (BK). Those four stocks show price decreases that would pay dividends at current payout levels from $1k invested equaling their single share prices.
To run-down the ‘safer’ dividends of those eight and all the rest, check-out the Dividend Dog Catcher marketplace site (by clicking on the last summary bullet above) after November 30.
Actionable Conclusions (1-10): Analysts Estimated 12.31% To 30.79% Net Gains For Ten Top Buffett-Held Dividend Stocks Come November, 2023
Three of these ten Buffett-held top dividend stocks by yield were also among the top ten gainers for the coming year based on analyst 1-year target prices. (They are tinted gray in the chart below). Thus, this yield-based forecast for these Buffett dogs was graded by Wall St. Wizards as 30% accurate.
Source: YCharts.com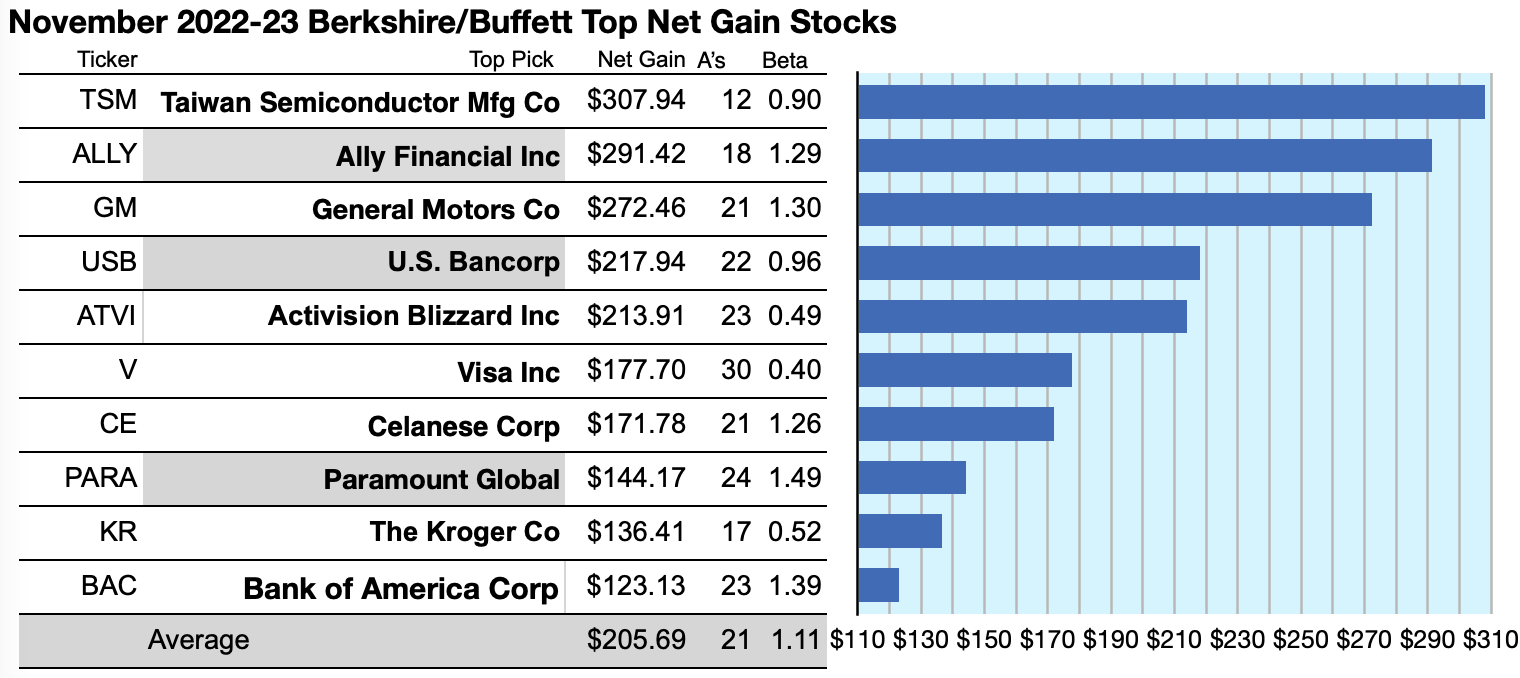
Estimated-dividends from $1000 invested in each of these highest-yielding stocks and their aggregate one-year analyst median target-prices, as reported by YCharts, produced the data points for the projections below. Note: one-year target prices by lone-analysts were not applied. Ten probable profit-generating trades projected to November 22, 2023 were:
Taiwan Semiconductor Manufacturing Co. Ltd. (TSM) was projected to net $307.84, based on dividends, plus the median of target price estimates from 12 analysts, less broker fees. The Beta number showed this estimate subject to risk/volatility 10% less than the market as a whole.
Ally Financial Inc was projected to net $291.42, based on the median of target estimates from 18 analysts, plus dividends, less broker fees. The Beta number showed this estimate subject to risk/volatility 29% higher than the market as a whole.
General Motors Co. (GM) netted $272.46 based on the median of estimates from 21 analysts, plus dividends. The Beta number showed this estimate subject to risk/volatility 30% greater than the market as a whole.
U.S. Bancorp was projected to net $217.94, based on a median of target price estimates from 22 analysts, plus dividends, less broker fees. The Beta number showed this estimate subject to risk/volatility 4% under the market as a whole.
Activision Blizzard, Inc. (ATVI) was projected to net $213.91, based on the median of target price estimates from 23 analysts plus annual dividend, less broker fees. The Beta number showed this estimate subject to risk/volatility 51% under the market as a whole.
Visa Inc. (V) was projected to net $177.70 based on a median of target price estimates from 30 analysts, plus dividends, less broker fees. The Beta number showed this estimate subject to risk/volatility 60% under the market as a whole.
Celanese Corp. (CE) netted $171.78 based on the median of estimates from 21 analysts, plus dividends. The Beta number showed this estimate subject to risk/volatility 26% greater than the market as a whole.
Paramount Global was projected to net $144.17 based on dividends, plus the median of target price estimates from 24 analysts, less broker fees. The Beta number showed this estimate subject to risk/volatility 49% greater than the market as a whole.
The Kroger Co. (KR) was projected to net $136.41 based on dividends, plus the median of target price estimates from 17 analysts, less broker fees. The Beta number showed this estimate subject to risk/volatility 48% under the market as a whole.
Bank of America Corp (BAC) was projected to net $123.13, based on the median of target price estimates from 23 analysts, plus annual dividend, less broker fees. The Beta number showed this estimate subject to risk/volatility 39% greater than the market as a whole.
The average net gain in dividend and price was estimated at 20.57% on $10k invested as $1k in each of these ten stocks. These gain estimates were subject to average risk/volatility equal to the market as a whole.
Source: Open source dog art from dividenddogcatcher.com
The Dividend Dogs Rule
Stocks earned the “dog” moniker by exhibiting three traits: (1) paying reliable, repeating dividends, (2) their prices fell to where (3) yield (dividend/price) grew higher than their peers. Thus, the highest yielding stocks in any collection became known as “dogs.” More precisely, these are, in fact, best called, “underdogs”.
49 Buffett Holdings By Target Gains
Source: YCharts.com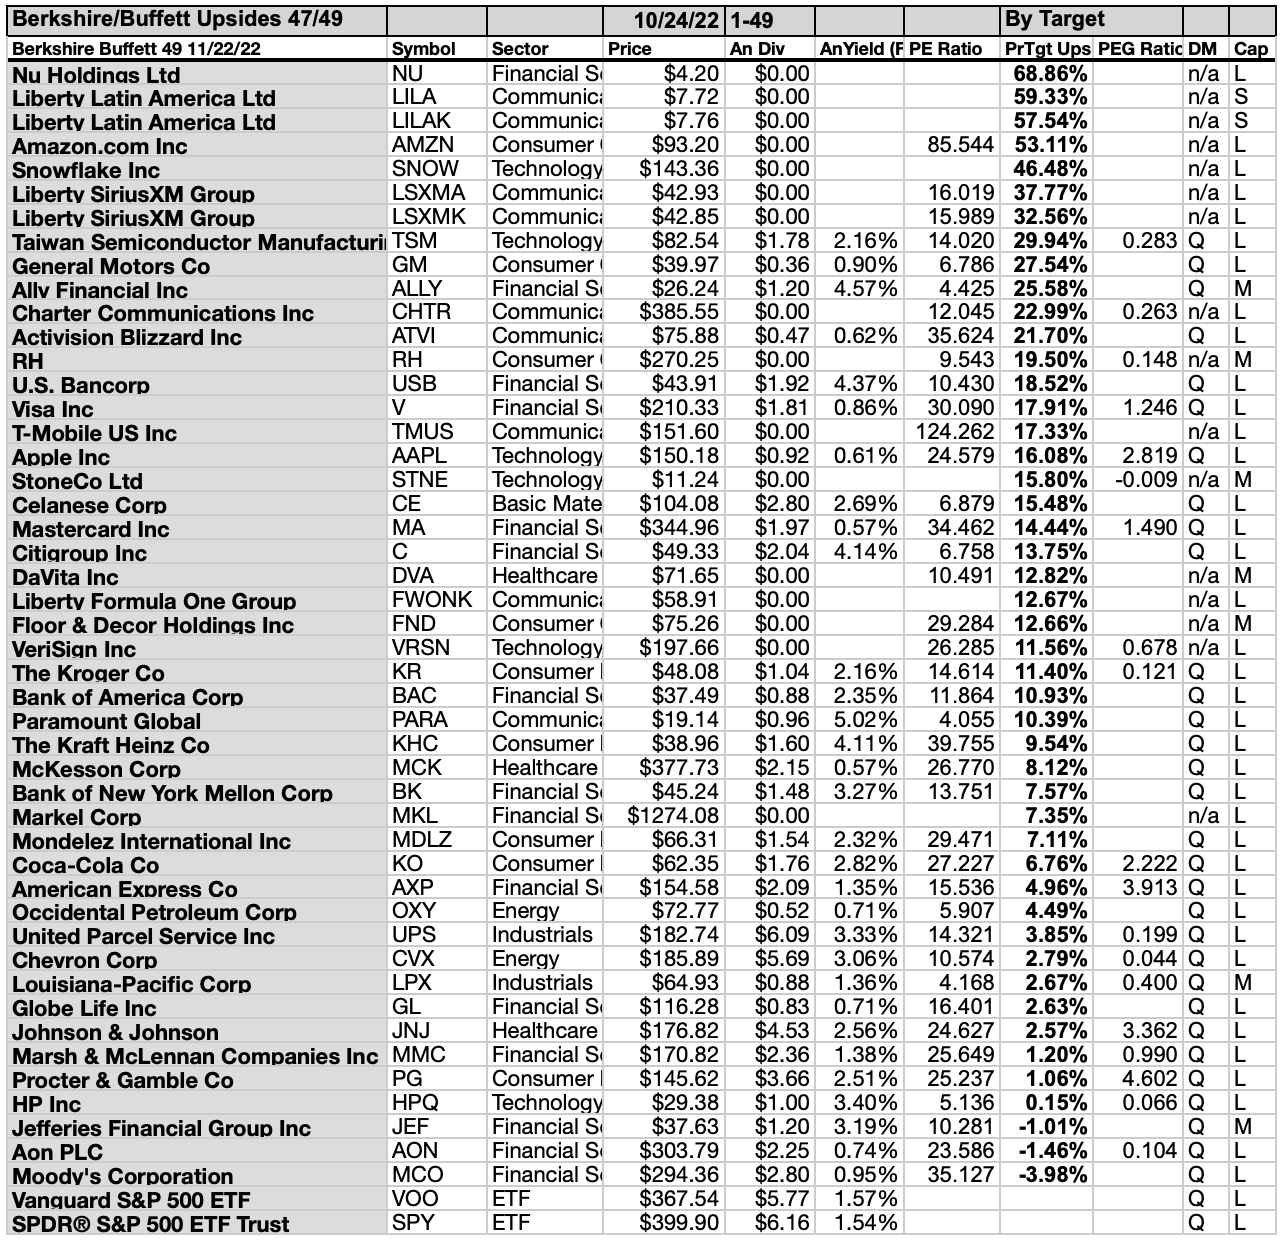
33 Buffett Picks By Yield
Source: YCharts.com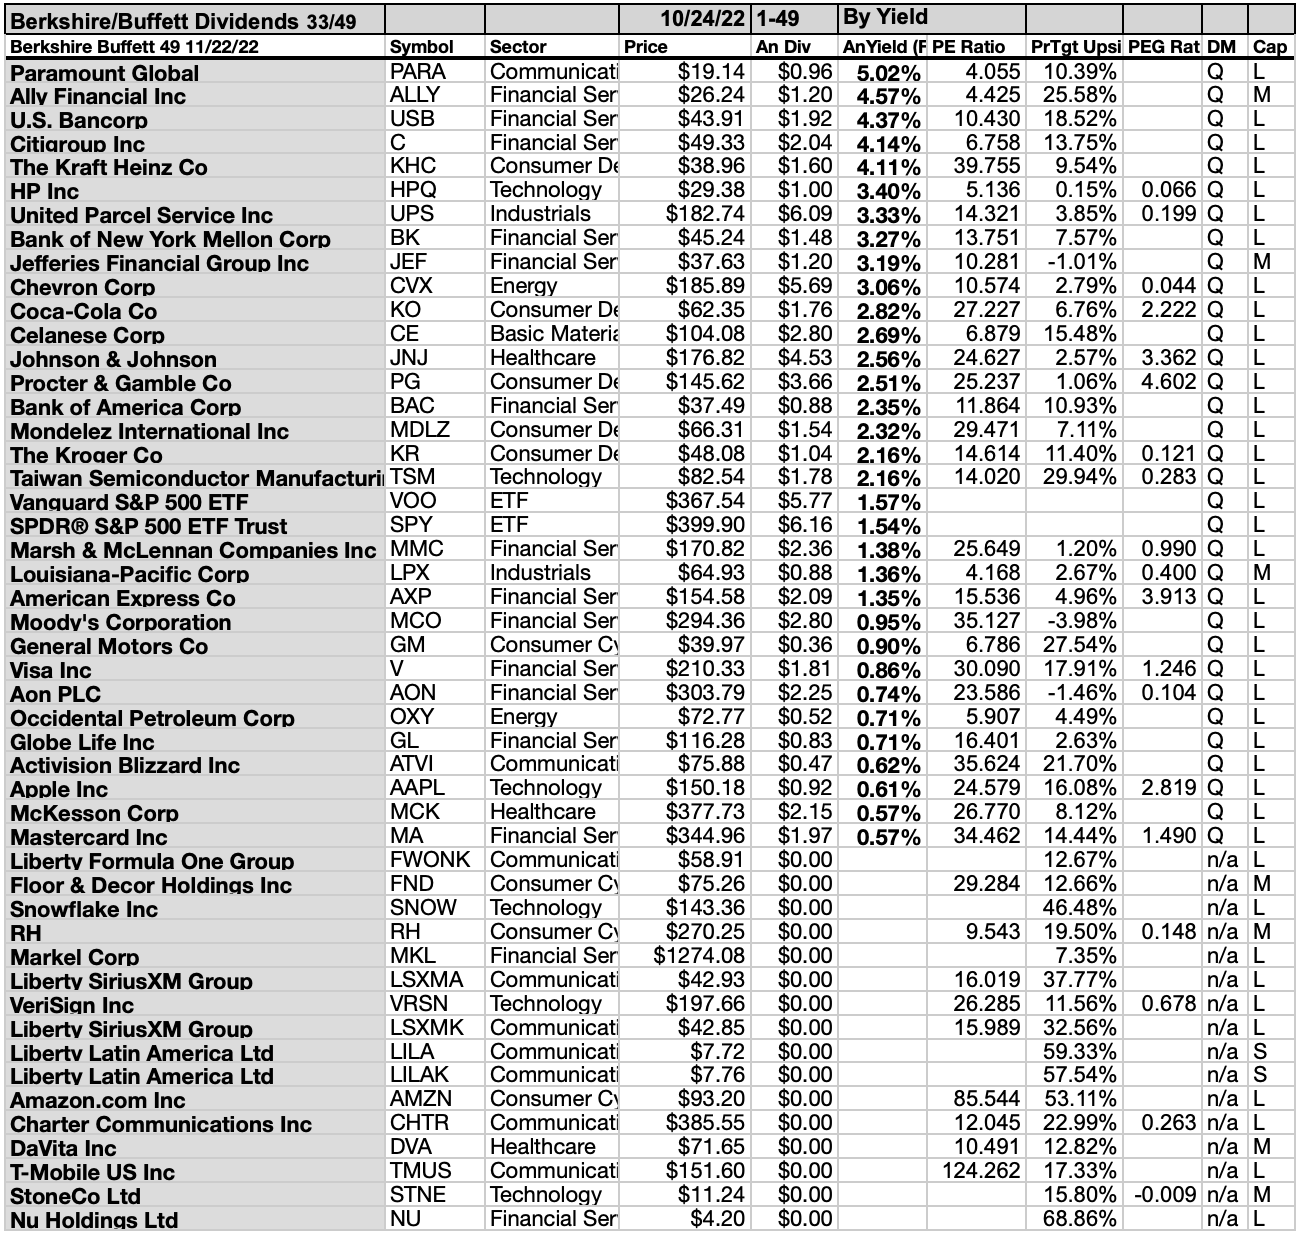
Actionable Conclusions (11-20): 10 Top Buffett-Held Stocks By Yield Are The Dogs of Berkshire-Hathaway
Top ten Buffett-held stocks selected 11/22/22 by yield represented six of eleven Morningstar sectors.
First place went to the lone communication services company, Paramount Global [1].
Five dogs from the financial services sector, placed second, through fourth, eight, and ninth: Ally Financial Inc. [2] U.S. Bancorp [3], Citigroup Inc. [4], Bank of New York Mellon Corp [8], and Jefferies Financial Group Inc. [9].
Next, the lone consumer defensive sector representative placed fifth, The Kraft Heinz Co. [5].
One from the technology sector, placed sixth, HP Inc. [6]. The lone industrials stock placed seventh, United Parcel Service (UPS)[7].
Finally. taking tenth, was one from the energy sector, Chevron Corp. (CVX) [10], to complete the November Buffett/Berkshire top ten dividend dogs, by yield.
Actionable Conclusions: (21-30) Top-Ten November Berkshire/Buffett Dogs Showed 10.96%-29.63% Upsides, While (31) Four Showed Downsides of -0.88% t0 -3.55%.
Source: YCharts.com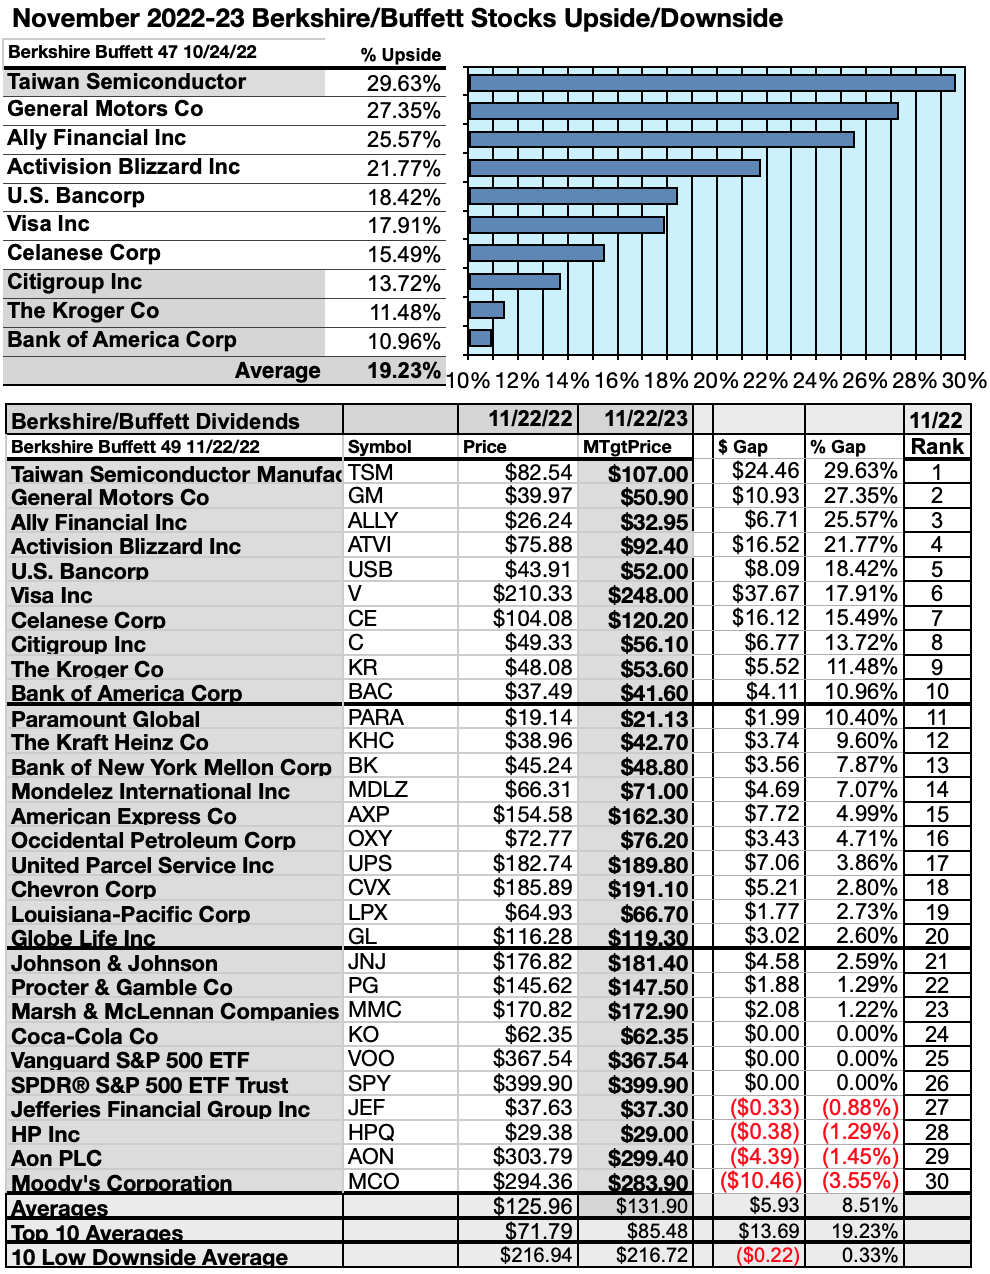
To quantify top-dog rankings, analyst median price target estimates provided a “market sentiment” gauge of upside potential. Added to the simple high-yield metrics, analyst median price target estimates became another tool to dig out bargains.
Analysts Forecast A 0.98% Disadvantage For 5 Highest Yield, Lowest Priced, Of 10 Top Buffett-Collected Dividend Stocks To November, 2023
Ten-top Buffett/Berkshire dividend dogs were culled by yield for this update. Yield (dividend/price) results provided by YCharts did the ranking.
Source: YCharts.com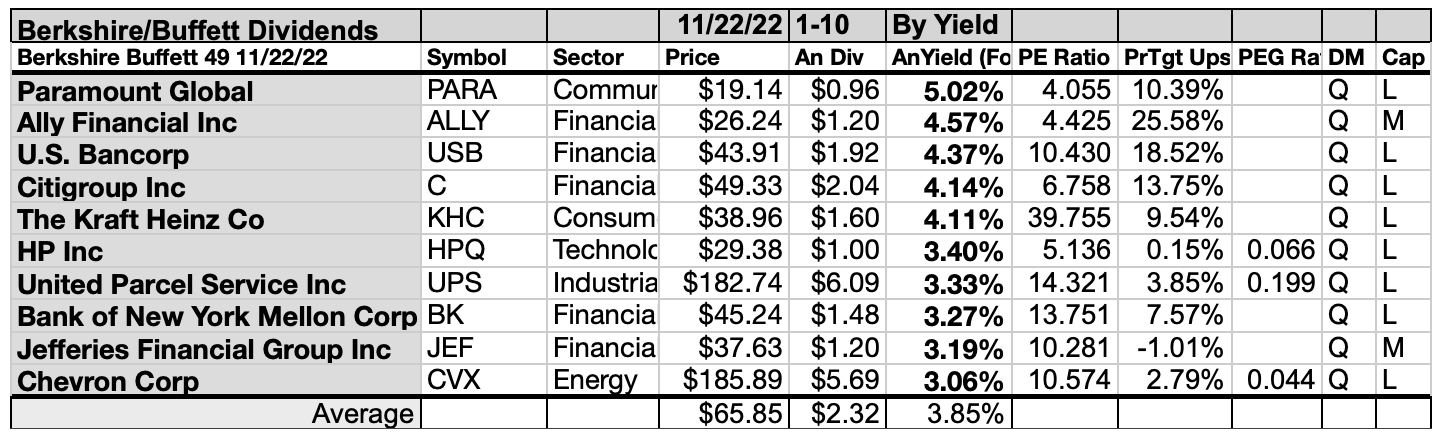
As noted above, top ten Buffett-chosen dividend dogs screened 11/22/22 showing the highest dividend yields represented six of eleven Morningstar sectors.
Actionable Conclusions: Analysts Predicted 5 Lowest-Priced Of The Top Ten Highest-Yield Buffett-Held Dogs (31) Delivering 11.74% Vs. (32) 11.85% Average Net Gains by All Ten Come November 22, 2023
Source: YCharts.com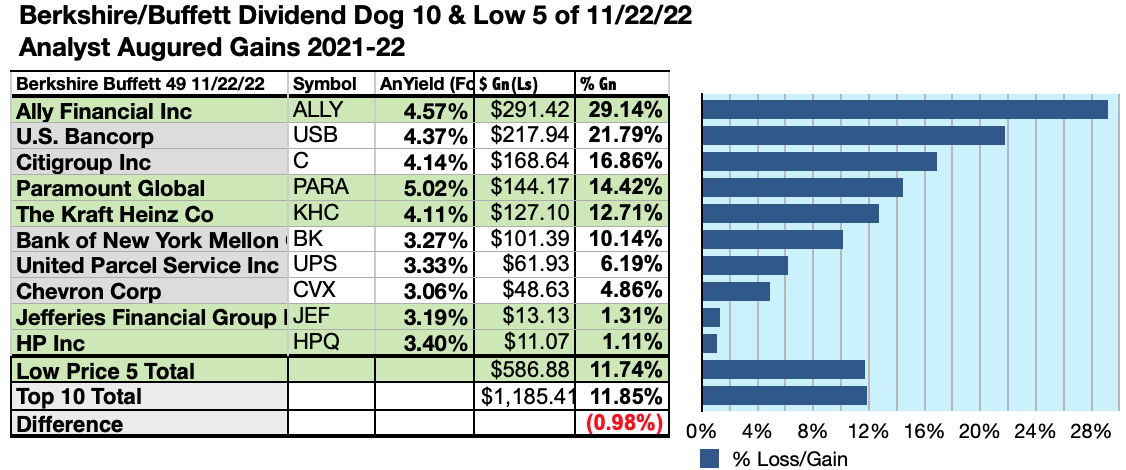
$5000 invested as $1k in each of the five lowest-priced stocks in the top ten dividend Buffett-selected kennel by yield were predicted by analyst 1-year targets to deliver 0.98% LESS gain than $5,000 invested as $.5k in all ten. The second lowest-priced selection, Ally Financial Inc, was projected to deliver the best analyst-estimated net gain of 29.14%.
Source: YCharts.com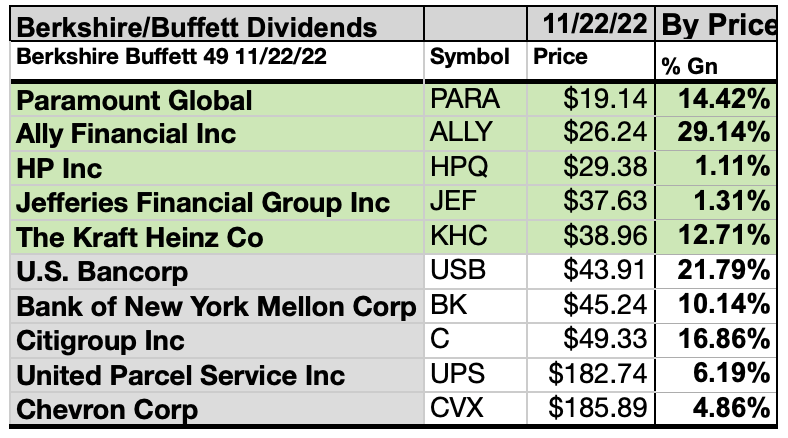
The five lowest-priced top-yield Buffett-backed dividend dogs as of October 24 were: Paramount Global; Ally Financial Inc; HP Inc; STORE Capital Corp; The Kraft Heinz Co., with prices ranging from $19.14 to $38.96.
Five higher-priced Buffett-picked dividend dogs as of November 22 were: US Bancorp; New York Mellon Corp; Citigroup Inc; United Parcel Service; Chevron Corp, whose prices ranged from $43.91 to $185.89.
The distinction between five low-priced dividend dogs and the general field of ten reflected Michael B. O’Higgins’ “basic method” for beating the Dow. The scale of projected gains based on analyst targets added a unique element of “market sentiment” gauging upside potential. It provided a here-and-now equivalent of waiting a year to find out what might happen in the market. Caution is advised, since analysts are historically only 20% to 85% accurate on the direction of change and just 0% to 15% accurate on the degree of change (within 2.5%).
Afterword
If somehow you missed the suggestion of the four stocks ready for pick-up and the four emerging ideal picks at the start of the article, here is a reprise of the list at the end:
This November 2022 update shows that the following four top dogs of Berkshire stocks now live up to the dogcatcher ideal of paying annual dividends (from a $1K investment) exceeding its single share prices: Paramount Global; Ally Financial Inc.; The Kraft Heinz Co.; HP Inc.
Four more are within $7.00 or 15% of the ideal: U.S. Bancorp at 0.25%; Jefferies Financial Group at 7.92%; Citigroup Inc at 8.39%; Bank of New York Mellon at 14.99%. Those four stocks show price decreases that would pay dividends at current payout levels from $1k invested equaling their single share prices.
To run-down the ‘safer’ dividends of those eight and even more, check-out the Dividend Dog Catcher marketplace site (by clicking on the last summary bullet above) after November 30.
Price Drops or Dividend Increases Could Get All Ten Dogs of Buffett Back to “Fair Price” Rates For Investors
Source: YCharts.com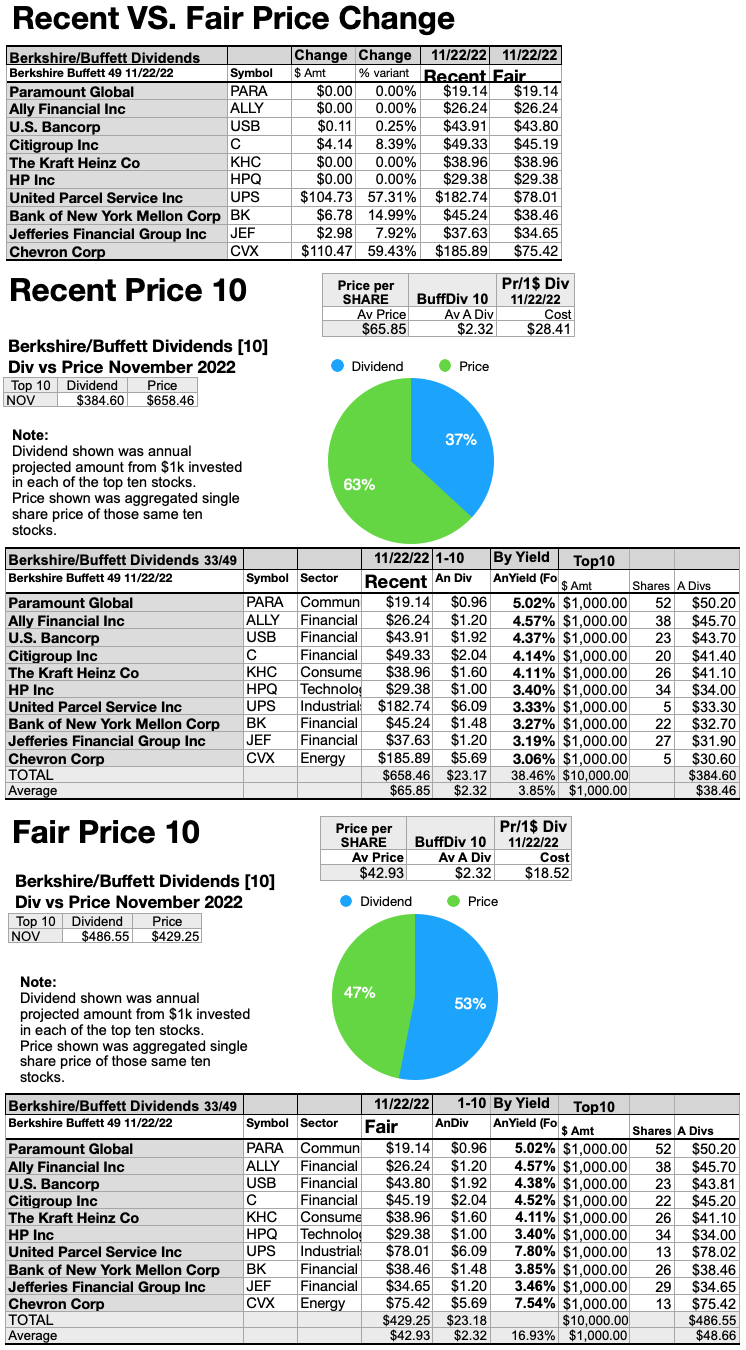
The charts above retain the recent dividend amount and adjust share price to produce a yield (from $1K invested) to equal or exceed the single share price of each stock. As you can see, this illustration shows the four fair priced dogs in the top ten (PARA, ALLY, KHC, & HPQ), plus six out-of- bounds-priced stocks. The outliers need to trim prices between $0.11 and $110.47 to realize the 50/50 goal for share prices equaling dividend payouts from $10k invested.
The alternative, of course, would be for these companies raise their dividends. That, of course, is a lot to ask in these highly disrupted, dollar-flooded, understaffed, short-supplied, and inflationary times.
Market action is the key. More needs to drop up to 60% for all to become Buffett Ideal dividend dogs.
The net gain/loss estimates above did not factor-in any foreign or domestic tax problems resulting from distributions. Consult your tax advisor regarding the source and consequences of “dividends” from any investment.
Stocks listed above were suggested only as possible reference points for your Buffett/Berkshire batch stock purchase or sale research process. These were not recommendations.
Disclaimer: This article is for informational and educational purposes only and should not be construed to constitute investment advice. Nothing contained herein shall constitute a solicitation, recommendation or endorsement to buy or sell any security. Prices and returns on equities in this article except as noted are listed without consideration of fees, commissions, taxes, penalties, or interest payable due to purchasing, holding, or selling same.
Graphs and charts were compiled by Rydlun & Co., LLC from data derived from www.indexarb; YCharts; finance.yahoo; analyst mean target price by YCharts. Open source dog art from dividenddogcatcher.com
Be the first to comment