Gold Price Outlook Talking Points:
- Gold prices surged to resistance around $1,686 as risk aversion soared and volatility spiked
- The rally has seen XAUUSD approach overbought territory
- A continuation higher might require further consolidation
Gold Price Forecast: Bullion May Require Consolidation Before Further Gains
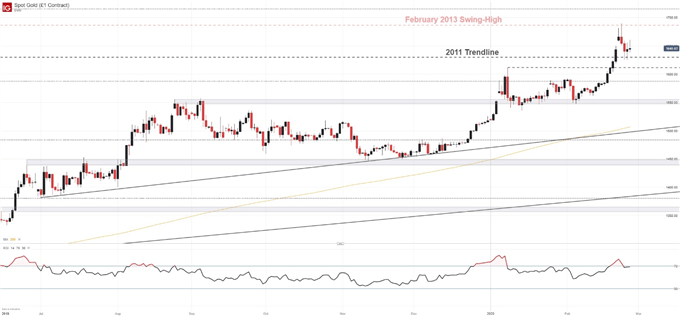
In my last gold update, I highlighted potential barriers to a topside continuation but noted the precious metal was aimed higher nonetheless. In the days since, gold posted another staggering breakout higher as risk aversion soared and the Dow Jones nosedived into correction territory. Despite continued equity weakness, gold has lacked a similar follow-through after failing at resistance around $1,686 and may require consolidation before attempting another leg higher.
Gold Price Chart: 4 – Hour Time Frame (September 2019 – February 2020)
How to Trade Gold: Top Gold Trading Strategies and Tips
To be sure, the fundamental landscape remains tantalizingly uncertain which allows potential for a continuation higher to occur at any point but a slowdown in gains over the last few days and hint at weakness. Long upper wicks on recent daily candles suggest the same, but they are somewhat nullified by similarly long lower wicks – highlighting indecision.
Gold Price Chart: Daily Time Frame (June 2019 – February 2020)
In turn, gold may look to consolidate and test support before resuming higher in the weeks to come. With that in mind, gold may look for initial assistance at $1,628.5 before subsequent support at $1,610 and $1,587 is required.


Recommended by Peter Hanks
Get Your Free Gold Forecast
Together, the levels should offer a bounty of support if prices continue lower. Over the longer term, however, prolonged uncertainty, loose monetary policy and the prospect of inflation as a result, may buoy gold prices. Consequently, gold may eventually look to retest the February 2013 swing-high around $1,686 which worked to stall the rally last week.
| Change in | Longs | Shorts | OI |
| Daily | 4% | 0% | 3% |
| Weekly | 18% | -24% | 1% |
If resistance at $1,686 can be surmounted, secondary resistance may reside at the Fibonacci line around $1,715. In between, the psychologically significant $1,700 could look to play a minor role. In the meantime, the risk-reward profile for bullish biases is not ideal, so waiting for a modest pullback may be prudent. Further, IG Client Sentiment data reveals retail traders are piling into the long-side, an indication XAU/USD may slip further before continuing higher.
–Written by Peter Hanks, Junior Analyst for DailyFX.com
Contact and follow Peter on Twitter @PeterHanksFX


Be the first to comment