

ugurhan
If you are invested in broad market indexes, ETFs (exchange-traded funds), or even individual stocks, there is no way to avoid the ups and downs of the market, sometimes to the extreme. Most folks, especially conservative investors, detest the roller-coaster ride of the stock market. Moreover, it is not even good for their wealth-building goals, as we know that high volatility generally results in relatively poor performance (unless you are buying at regular intervals, like each pay period). Also, income investors, including retirees who live off their investments, have a different problem. Since they need to withdraw income on a regular basis, they may be forced to sell when the prices are low and making such losses permanent. Even if they do not withdraw income, more than likely, they are not adding any fresh money to take advantage of low prices. Retirees can also face the problem of sequential risk if the market happens to go into a deep correction for multiple years in the early phase of retirement.
So, how can we ensure consistent income without drawing down our portfolio and conserving the capital? In fact, we framed our goals of an ideal portfolio around these problems. Here they are:
-
Capture at least 80 to 90% of the upside of the markets during the bull runs.
-
Avoid the worst of deep corrections and panics, and preserve capital to a large extent.
-
Match or exceed the market returns on a long-term basis.
-
Generate at least 5% income that can be withdrawn/used if needed.
With these goals, a few years ago, we introduced a portfolio concept (or strategy) in our articles on SA that we like to call NPP (Near-Perfect Portfolio) strategy. To some, the name may appear to be a bit over the top, but the underlying premise and goals fit the name. Generally speaking, we’re looking for a strategy that performs reasonably well during the bull markets, preserves capital when the market throws a fit or performs poorly, and provides a decent enough income stream on a consistent basis. This is the basis of the Near-Perfect Portfolio strategy.
In our view, the following type of investors should find the NPP strategy highly useful:
-
An income investor who does not like the roller-coaster ride of the stock market and who would rather sleep well even during the depth of a correction.
-
A retiree or a near-retiree who would want to avoid the sequential risk of the stock market but at the same time will like to stay fully invested.
-
Anyone who believes that low volatility leads to higher returns in the long-term (and vice versa), and especially folks who are nearing 50 or already 50+.
We follow the NPP strategy in our Marketplace service, “High-Income DIY,” but from time to time, we provide updates and progress of the NPP portfolio here on SA public platform as well. As usual, we will provide an overview of the live performance of the NPP portfolio vis-à-vis the S&P500 for the last 30 months since January 2020, in addition to back-testing performance going back to the year 2008. In the last section, we lay out how to structure a new portfolio based on the NPP strategy.
Aim for a Stress-free way of Investing
The past 3 to 4 years have seen an incredible roller-coaster ride for the broader market. Going back to the year 2019 and early 2020, we witnessed a continued and strong bull market. However, the 11-year long bull-market was interrupted suddenly and violently by the once-in-a-century pandemic. Very few investors could see that coming. However, fortunately, the correction was very short-lived, and the next phase of the bull market started that took the S&P500 as high as 4790.
However, this year, markets have faced very strong headwinds. At one point, the S&P500 lost nearly 23% from its most recent peak (though it has come back a little since then), and a vast number of individual stocks have lost even more. The biggest threat to the economy (and hence the stock market) that has emerged is the 40-year high inflation that shows few signs of abating any time soon. That has pushed the Fed from being dovish to extremely hawkish in a matter of few months. The current geopolitical situation and a prolonged war in eastern Europe have only made the situation worse. Inflation is the biggest threat to retirees and folks who are on a fixed income and their stock portfolios. Now, with rapidly increasing interest rates and an increasingly hawkish Fed, we are a step closer to a possible recession. Can we avoid the recession? Maybe or maybe not. But the market direction is likely to remain murky and volatile for the next few months, if not longer.
With all this turmoil going on in the market, it basically boils down to one simple question. Do we really want to constantly go through these ups and downs of the stock market and worry about the value of our portfolio on a daily or weekly basis? Or is there a better alternative, where a conservative investor or a retiree could have lower volatility, minimal drawdowns, and consistent income but still could enjoy the fruits of a rising market as and when that occurs? This is exactly the objective of this comparative analysis of the NPP strategy and the broader market indexes like the S&P 500.
What’s a Near-Perfect Portfolio?
Here’s some background. No portfolio can be perfect because it cannot meet all of its stated objectives in every situation or all the time. However, even if we could meet 80% of our objectives, 80% of the time, we should do pretty well. Also, we are not aiming to outperform or beat the market but meeting our pre-determined goals and expectations. If the backtesting results are any indication, chances are that we might just beat the market as well. Of course, that will be icing on the cake.
The NPP Strategy is a combination of three investment baskets with unique and diverse sub-strategies. The combined strategy aims to achieve the following goals and objectives:
-
Preserve capital by limiting the drawdowns to less than 20%.
-
Provide a consistent income of roughly 5% to those who need to withdraw.
-
Grow the capital for the long term at an annualized rate of 10% or better (including the income).
-
Strive to take the stress out of investing by providing low volatility, low drawdowns, consistent income, and SWAN (sleep well at night) like characteristics.
-
We must caution that these strategies need some work on an ongoing basis and may not suit highly passive investors. In addition, they require patience.
Performance Behavior of NPP Strategy During Bull & Bear Markets
Before we go any further, it may be beneficial to discuss how our rotational and buy-and-hold portfolios would have performed since the year 2008. Moreover, this will demonstrate how rotational portfolios can act as a counterbalance to buy-and-hold portfolios during times of crisis. We run and manage many such rotational portfolios and three buy-and-hold portfolios inside our Marketplace service.
Note: All the tables and charts included in this article are sourced from Author’s work unless specified otherwise underneath the image. The stock market data, wherever used, is sourced from public websites like Yahoo Finance, Google Finance, Morningstar, etc.
Know Your Tolerance for Drawdowns
Let’s talk about drawdowns a little bit. During the good times (bull runs), it is natural that most folks do not think much about drawdowns. However, for retirees and older investors, it is of paramount importance to know their risk tolerance and have a realistic idea about how much of a drawdown would be tolerable to them. In addition to the level of tolerance to drawdowns, there is always the inherent risk of negative sequential returns during the early years of retirement. So, if you think that in a worst-case scenario, you could only tolerate a 20-25% drawdown, then you should not be invested in broad market indexes. Broad market indexes like S&P 500 routinely have a drawdown (loss from top to bottom) of over 30% or even 50% (examples include the dot-com crash of 2000-2002, the financial crisis of 2008-2009, and the Covid crash of 2020). Sometimes a downturn can end quickly, but at other times it can be long, slow, and painful.
So, let’s compare the drawdown performance of our NPP strategy and the S&P 500 during some of the worst times during the last 14 years (based on backtesting). We are not in a position to go beyond 2008 due to a lack of reliable data, but at least it would cover the financial crisis and a few other deep correction periods.
List of Drawdown Timeframes:
• Jan-2008 to Mar-2009 (Financial and Housing crash)
• Oct-2018 to Dec-2018 (Crash of 2018)
• Jan-2020 to Mar-2020 (Pandemic crash)
• Jan-2022 to July 22, 2022 (the current period)
Table-1:
Author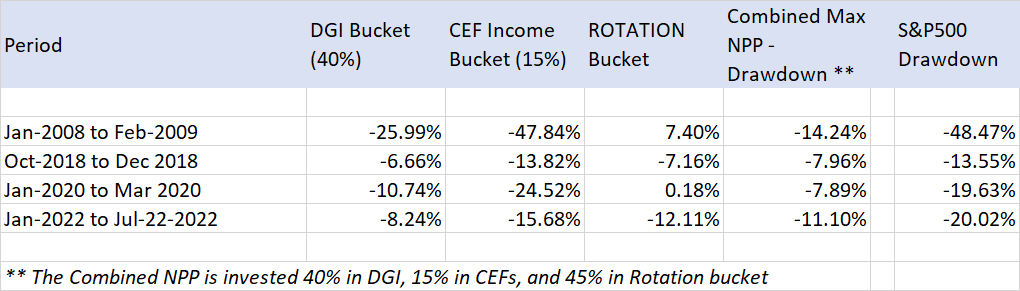
As you can see above, the drawdown of the NPP portfolio was less than one-third of the S&P 500 during an extreme downturn and nearly half (or less than half) at most other times. The current period is still an ongoing affair, and so the complete picture is not available as yet.
Performance of NPP Strategy
Below is the combined NPP portfolio performance (based on backtesting results from 2008 until July 22-2022). We will then provide more details on the three components of the NPP strategy.
Table-2:
|
As of July 22, 2022: |
CAGR** |
|
CAGR of DGI bucket since 2008: |
13.67% |
|
CAGR of CEF-High-Income bucket since 2008: |
10.59% |
|
CAGR of ROTATION bucket since 2008: |
15.51% |
|
CAGR of Combined NPP strategy since 2008: |
14.17% |
|
CAGR of S&P 500 since 2008: |
9.13% |
** CAGR – Compound Annual Growth Rate
Chart-1: The Combined NPP portfolio vs. S&P 500 Since 2008
(If no Income was withdrawn)
Author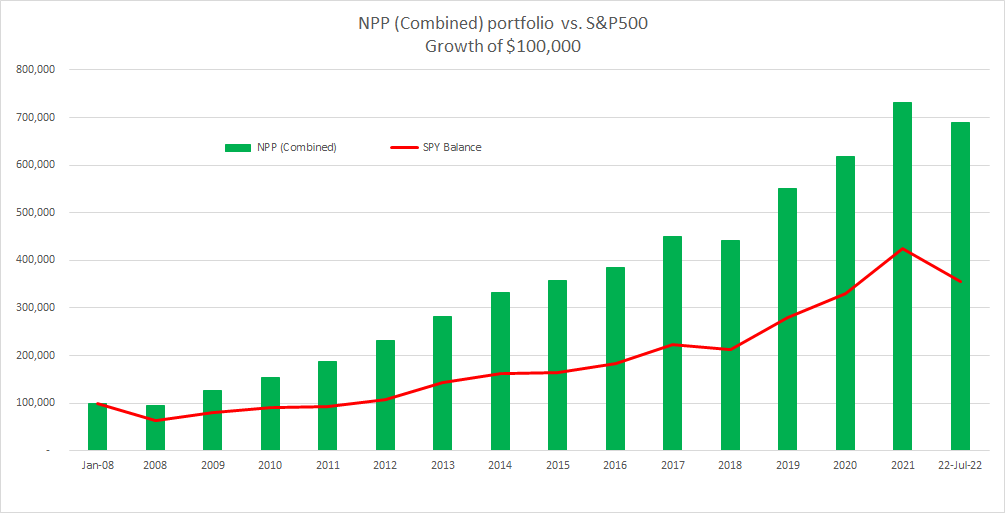
The chart below is the same as above, except that 6% (inflation-adjusted) income is withdrawn every year. It is very obvious that in terms of growth of capital, S&P 500 did a terrible job in spite of the fact that it has performed very well during the last 13 years. The reason was the huge drawdown right in the first year. This demonstrates very clearly the danger of risk of sequence returns mentioned earlier. However, due to very limited drawdowns, the NPP strategy balance grew very nicely.
Chart-1A: The Combined NPP strategy vs. S&P 500 Since 2008
(If 6% Inflation-adjusted Income was withdrawn)
Author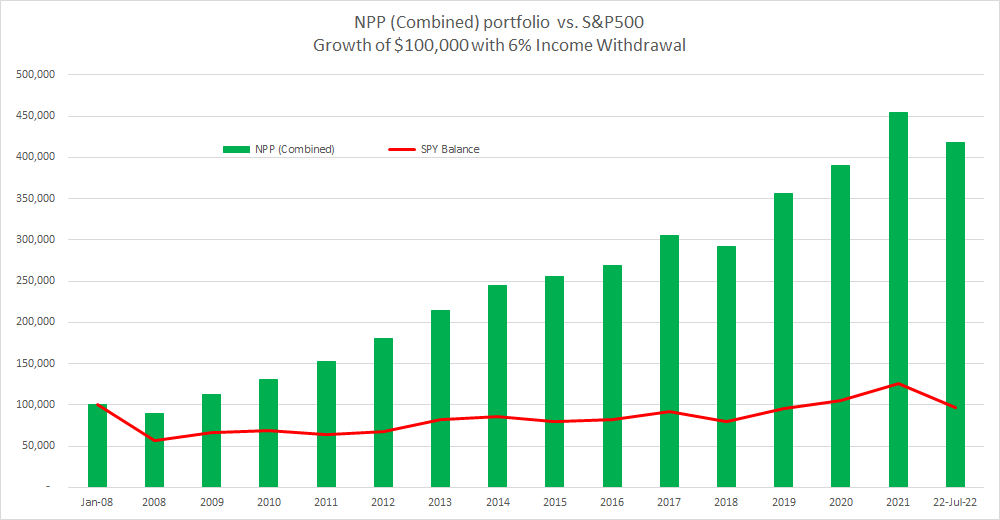
Below is the chart from the “live performance” of the NPP Portfolio since Jan. 2020. (Since this comes from our Marketplace service, it takes into account 6 Rotational portfolios and 3 Buy-and-hold portfolios). In practice, an investor would just need two buy-and-hold buckets and one (or maybe two) rotational buckets. In the chart below, you will notice that at the market bottom in March 2020, S&P 500 and Dow Jones were down nearly 30% and 35%, respectively; however, NPP was down only about 15%.
Chart-2: Live performance since 2020
Author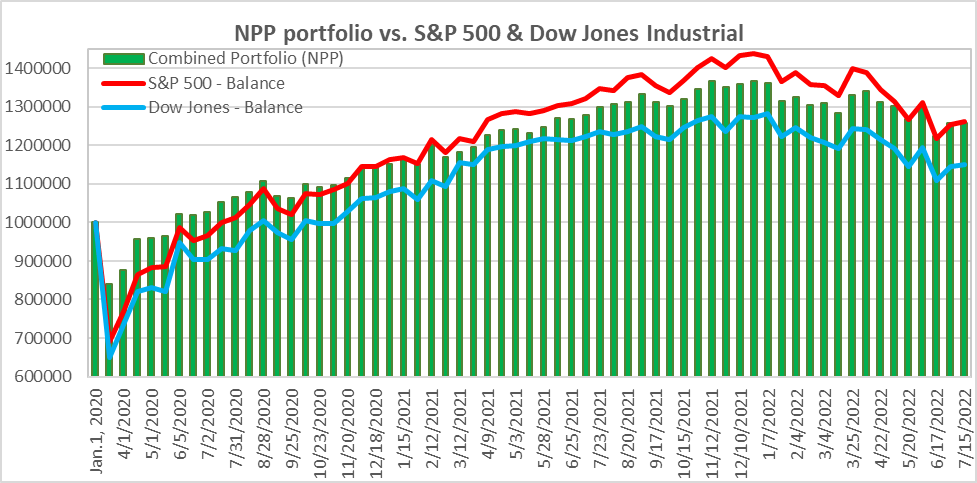
How to Get Started with a 3-Basket NPP Strategy
For readers, who are new to this strategy, we will present an actionable plan on how to start a 3-basket NPP portfolio. Sure, we will encourage readers to carefully analyze and do their due diligence and judge for themselves if the strategy suits their personal situation. We provide below a sample NPP portfolio, complete with its three components. At times, there may be some repetition, but we feel new readers could benefit from this greatly.
The idea here is to provide the basic framework. You do not have to follow the strategy exactly as it’s laid out here; rather, use these ideas in a manner that suits your needs based on your own unique situation. For example, the younger and more aggressive investors should include a fourth bucket for “Technology and Innovation” stocks, allocating 10% to 25% of the portfolio capital. However, the most conservative investors could instead use this fourth bucket as a cash-like investment.
It takes time to build confidence and conviction in any new strategy. So it’s highly recommended that one should move to any new strategy on a gradual basis over a period of time by adding in small lots rather than all in one go.
We would outline below a portfolio of three buckets if someone was to invest today. The fourth bucket would be optional based on the individual situation and thus not included here.
Bucket 1: DGI-Core
We believe that a diversified DGI (Dividend Growth Investing) portfolio should hold roughly 15-25 stocks. However, more passive investors, who do not have time or interest to manage individual stocks, could make this portfolio entirely of some select dividend ETFs (Exchange Traded Funds). For our sample portfolio presented below, we looked for companies that are large-cap, relatively safe, and have solid dividend records. Based on our previous work, we believe many of these stocks will likely provide a high level of resistance to downward pressure in an outright panic situation. In addition, we included two stocks that are providing an above-average yield and will lift the overall portfolio yield. We will present 15 such stocks with their current dividend payouts.
Goals:
-
Long-term investments 3%-4% dividend income
-
Long-term total return in line with the broader market
-
Drawdowns to be about 65%-70% of the broader market
In this bucket, we will invest roughly 35%-40% of the total investable funds. It will be our core investments in solid, blue-chip dividend stocks. It’s relatively easy to structure and form this bucket. However, we must put emphasis on diversifying among various sectors and industry segments of the economy. A selection of roughly 15-25 stocks could provide more than enough diversification.
A Sample DGI Portfolio:
For this part of the portfolio, our focus is to select stocks that tend to do reasonably well in both good times and during recessions/corrections. This is especially important if you are a retiree.
Stocks selected:
AbbVie Inc. (ABBV), Amgen (AMGN), Clorox (CLX), Digital Realty (DLR), Enbridge (ENB), Fastenal (FAST), Home Depot (HD), Johnson & Johnson (JNJ), Kimberly-Clark (KMB), Lockheed Martin (LMT), McDonald’s (MCD), Altria (MO), NextEra Energy (NEE), Texas Instruments (TXN), and Verizon (VZ).
Table-2: DGI Basket
Author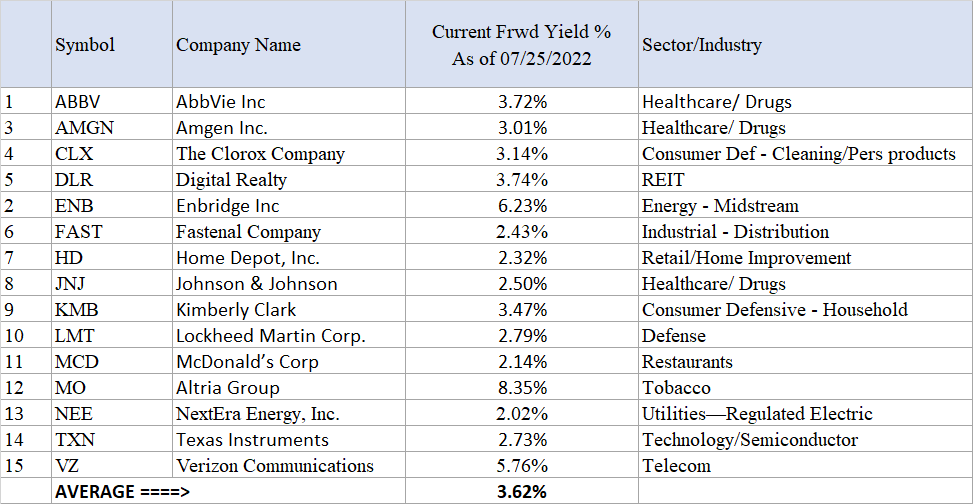
The average yield from this group of 15 stocks is very respectable at 3.62% compared to 1.5% from S&P500. If you still have some years before retirement, reinvesting the dividends for a few years would take the yield on cost up to 4% easily.
Chart 3: 15-stocks DGI performance vs. S&P500
Author
Bucket 2: Rotational Portfolio
So, what’s a Rotation strategy, and why invest in it? First, this is our insurance bucket (or hedging bucket), which should preserve our capital in times of crisis or panic. In addition, it would reduce volatility, provide a decent return, and could provide a good income as well.
Along with the DGI portfolio, these strategies are an essential part of our overall portfolio. Investment in stocks is inherently risky, and the Rotational strategies provide the necessary hedge against the risk. They bring the overall volatility of the portfolio down and limit the drawdowns in a panic or a major correction scenario. The biggest advantage is that they let the investor sleep well at night. They bring a level of assurance that helps the investor to maintain calm and stay invested in good times and bad.
However, we must caution that these strategies require some regular work on a monthly basis. One can start with one rotation strategy, but eventually, one should invest in at least two rotational strategies. As one gains more experience and confidence, one could diversify in multiple strategies. We provide eight such strategies in our Marketplace service to suit a wider audience.
Note: A word of caution for new investors – just because we’re allocating 40% of the portfolio to this strategy, we are not recommending that you change to this strategy overnight with large sums of money. Rather, it should be done gradually over time and in multiple lots. There are two benefits: first, you need time to gain confidence and have a conviction on the new strategy. Second, gradual deployment will avoid any whipsaws or reversals in the market.
A Rotation Strategy for both Bull and Bear Markets
In the Rotational bucket, we normally rotate between a fixed set of securities on a periodic basis (usually a month), based on the relative performance of each security during the previous period of defined length.
This portfolio is designed in such a way that it aims to preserve capital with minimal drawdowns during corrections and panic situations while providing excellent returns during bull periods. Due to much lower volatility, this portfolio is likely to outperform the S&P 500 over long periods of time. However, please note that it may underperform to some extent during the bull runs. It can also underperform in some years due to frequent whipsaws.
The strategy is based on eight diverse securities but will hold only two of them at any given time, based on relative positive momentum over the previous three months. Basically, we will select the two top-performing funds. The rotation will be on a monthly basis. The eight securities are:
- Vanguard High Dividend Yield ETF (VYM)
- Vanguard Dividend Appreciation ETF (VIG)
- iShares MSCI EAFE Value ETF (EFV)
- iShares MSCI EAFE Growth ETF (EFG)
- Cohen&Steers Quality Income Realty Fund (RQI)
- iShares 20+ Year Treasury Bond ETF (TLT)
- iShares 1-3 Year Treasury Bond ETF (SHY)
- ProShares Short 20+ Year Treasury ETF (TBF)
Chart-4: Comparative performance (backtested) for B&B Model and S&P 500
Author
Note: TBF did not have a history prior to 2010, so it was excluded for the years 2008 and 2009.
Bucket 3: High Income Bucket
It is a huge challenge for retirees to generate decent income while not risking their capital. Sure, the dividend stocks can generate roughly 3% income (at time 4%) relatively safely, but that may not be enough for everyone to meet their livable expenses. If one has a large enough capital, for example, $2 million or $3 million, even a 3% dividend income could generate a decent income. But we are talking of investors who have $1 million or less. How can they generate large enough income without risking the capital? This is where our NPP strategy invests one of its buckets in high-income securities like Closed-end funds. We recognize that this is a relatively high-risk bucket. That’s why we recommend no more than 15%-25% allocation to this bucket. However, this bucket gets most of the income with limited capital risk.
For high income, one has to essentially look at investment vehicles like REITs (Real Estate Investment Trusts), mREITs (mortgage REITs), BDCs (Business Development Companies), MLPs (Master Limited Partnerships), and CEFs (Closed-End Funds).
For this income bucket, we need to be highly selective and choose only the best of the best funds in each of the respective asset classes. Also, one should consider this part of the portfolio as a sort of “annuity” subset of the overall portfolio. But, in our opinion, these investments are a lot better than annuities in many respects. This portfolio gives a kind of assured high level of income and is still likely to grow better than the rate of inflation over a long period of time. More importantly, annuities usually leave nothing for the investor’s heir, whereas this portfolio could be fully passed on to heirs.
We present here a set of 11 high-income investment funds. However, one of them is an individual company stock and an MLP.
Below are some of the best funds within each asset class. The average current yield of the portfolio presented below is roughly 9%.
The funds/securities that we would consider in a long-term portfolio would be: (CHI), (UTF), (UTG), (PDI), (BBN), (FFC), (BST), (HQL), (MMP), (USA), and (RQI).
Table-3:
Author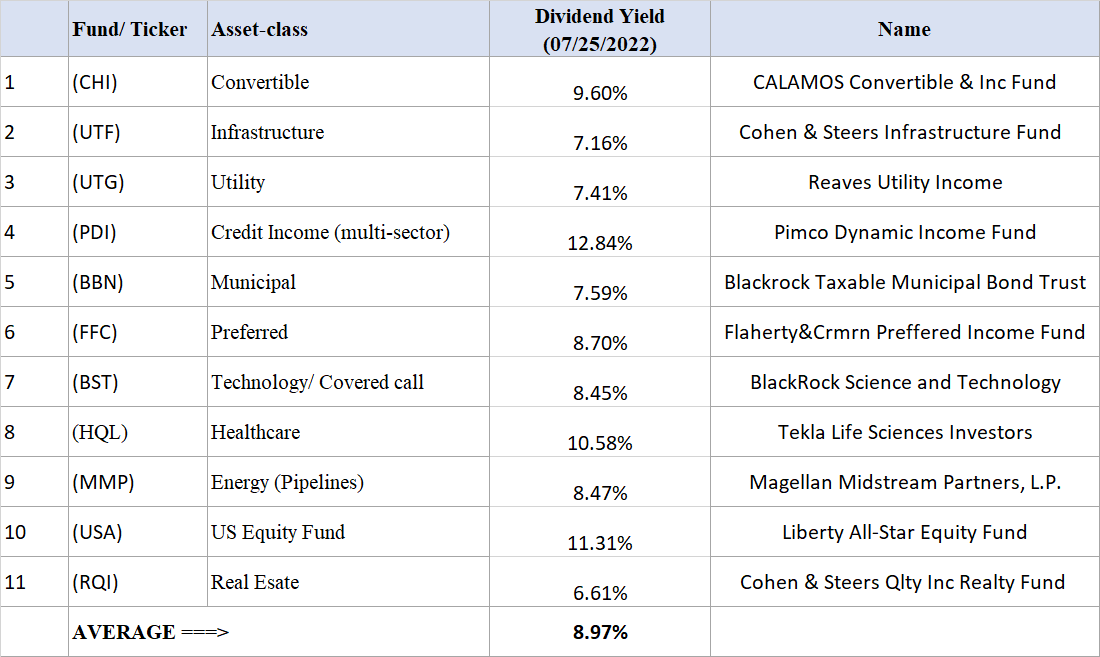
Note: Please note that MMP (Magellan Midstream Partners) is an MLP (Master Limited Partnership) in the midstream energy sector. As a partnership, it issues form K-1 for tax purposes instead of 1099-div.
Chart 5: 11-Positions CEF Portfolio vs. S&P500
Author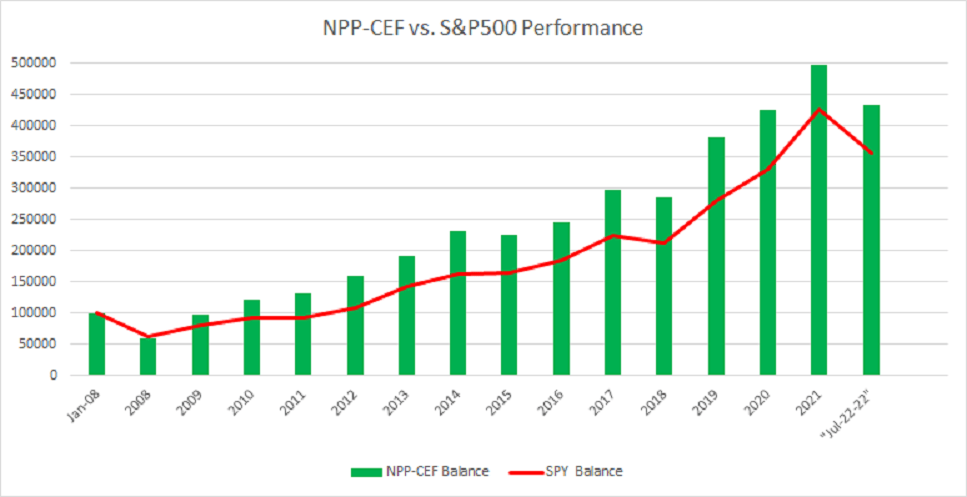
Concluding Thoughts
The stock market is at a critical juncture and is giving highly mixed signals. On the one hand, we have 40-year high inflation, unresolved supply-chain issues, and record-breaking high energy prices. We have seen an array of large companies that have issued warnings about their future earnings. The Fed is obviously behind the curve, and it appears that it may be trying to slow an economy that may already be slowing, which is exactly a recipe for a recession. On the other hand, we have a job market that is still strong, unemployment is low, and workers are hard to find. In a nutshell, there are a lot of uncertainties in the market. It is very hard to say if the market is going to recover from its current depressed levels or if it is just the beginning of a deeper downturn?
Nonetheless, as long-term investors, we have a different approach to facing uncertainties in the market. We invest in a set of three strategies (alternatively called the three-bucket strategy) that provide an extra layer of safety and diversification. Above all, this approach (that we call as NPP strategy) should generate a very decent income of 5%, provide protection from bigger drawdowns, and provide at least 10% overall growth (if not more) in the long term.
These strategies require a long-term investment horizon, a lot of discipline, and some time and effort on a monthly basis, especially in managing the Rotational part of the portfolio. So, in that sense, this strategy may not suit everyone. Also, the Rotational strategies work best inside a tax-deferred account. However, if you are a long-term investor and determined to save and build wealth in a more systematic and stress-free way, then this strategy may be right for you.
Be the first to comment